1
Creating the Global Greenscape: developing a global market entry framework for the green and renewable technologies
Associate Professor Margee Hume *(correspondent), University of Southern Queensland
Mr Paul Johnston South-South Capital Partners Dr Mark Argar. South-South Capital Partners Mr Craig Hume Griffith University
Introduction and overview of Chapter
The following chapter develops the case for the global greenscape. The chapter introduces the green global market place (Greenscape) and discusses the
market, consumer types and attitudes. The chapter introduces current green market practices and adopts case study methodology to present three distinct green companies related to renewable energy, process technology and waste water recycling and their international market activities. The chapter offers discussion on findings and incorporate the novel technique of discourse
analysis using Leximancer 3.0. The chapter concludes with a framework for the global greenscape and reflections for global marketing of green technologies.
The Stern report is the result of major review undertaken in the UK to better understand the economics of climate change. The report aimed to clarify comprehensively the nature of the economic challenges of climate change and how they can be met, in the UK and globally. The study examined the
implications for energy demand and emissions in both developed and developing countries. The study considered the risks of increased climate volatility and major irreversible impacts, air pollutants, greenhouse gas emissions, the role of land-use changes and forestry and the effectiveness of national and international policies. The study consulted with key stakeholders including academic, private sector, scientific, NGO and other experts,
internationally and domestically, to understand views and inform analysis. Several archived documents exist elaborating and advancing the Stern findings and position this report as seminal to the debate on climate change (HM
Treasury
http://webarchive.nationalarchives.gov.uk/+/http://www.hm-treasury.gov.uk/sternreview_backgroundtoreview.htm). The report concluded that “all individuals, firms and communities, in relation to production of housing, transport and food consumption decisions must unite to develop sustainable change and well being. The Stern report offered the notion that dangerous climate change cannot be avoided solely through high level
2
development and diffusion of a diverse range of products, processes and services and the adoption of corporate socially responsible policies (Tukker, Charter, Vezzoli, Sto & Andresen 2008; Uiterkamp & Vlek, 2007). This chapter will discuss product and process innovation and diffusion into green ready markets and offer a framework for developing and penetrating the global greenscape.
Achieving sustainable consumption and corporate social reasonability is a response to the scientific and international communities’ concern that the world is living beyond its ecological systems (Placet, Anderson & Fowler, 2005) and is facing a potential crisis with regard to environmental and other resources (Tukker et al, 2008). Defining sustainable consumption is difficult because of the multiple perspectives that surround the concept (Peattie & Collins 2009; Tukker et al, 2008). It is best viewed as an umbrella term that incorporates sustainability’s environmental, social and economic dimensions and takes on such ideas as reducing environmental impact, enhancing quality of life, minimising waste, taking a life cycle approach and looking at ecological preservation for future generations (UNEP, 2002). The goal of sustainable living is to ensure that society is able to be maintained over time and can be applied to all layers of community and business. Solutions to sustainable consumption are multidimensional and involve three parties; governments (policy makers); producers (business); and consumers (Tukker et al 2008). Issues of energy security, food security, cost management and waste
minimisation all come to play. The notion of consumption in this context extends beyond the initial purchase of products to include their manufacture, use and disposal; a concept that is wider than a narrow marketing ideology (Peattie & Collins 2009; McDonald & Oates 2006). Moreover, the way in which we market these products in the marketplace will depend on the notion and philosophy of sustainability, renewal goals and green practices. These ideals will form the foundation of this chapter.
Business contributes to sustainable consumption through the manufacture of goods and services that are more ecologically efficient and durable, using fair trade practices and ensuring an economic benefit to the community (Tucker et al 2008; Peattie & Charter 2003). Consumers contribute to sustainability through purchase, use and waste. Consumer demands can drive business production and provide consumers with a direct opportunity to contribute to the goals of
3
and national market commercialization of these sustainable technologies
provides a number of benefits to the economy, including improving the terms of trade, allowing specialization in green product development and development of clean and process technologies (cleantech) (REEEP, 2008), development of export and internationalized markets and support and development to the
primary industries. However, the most recent data indicates that market success for green/clean technology is low (REEEP, 2008) and requires marketing
development support (Hume, 2010). There are some countries with strong market potential and green stewardship, such as China, India and Brazil with smaller markets like Australia not taking advantage of these opportunities. Interestingly North America is also slow to adopt green development programs (Greendex Report, 2012).
As a market, China, India, Malaysia, Latin American and in particular Brazil, are actively scanning the globe for a range of clean technologies to implement in order to maintain their policy of a minimum of 50% renewables or green technologies throughout its energy matrix (REEEP, 2008). This directly relates to opportunities for new implementations and international transference of green technologies for penetration into these developing markets. Companies with the right set of skills can capitalise on these markets with product
portfolios like wind, biomass, bioenergies (such as Ethanol and Biodiesel), hydro, tidal, ocean / wave, geothermal, solar and agribusiness innovations, to name a few. In order to leverage products and programs, companies need extensive commercial support, market development and education to assist them in penetrating markets like China, India and Latin American. To increase the chance of success for global green innovator companies, the requirement for market commercialization strategies and ‘market entry’ support is warranted. More knowledge on market development, market entry and planning needs to be shared for international partnerships, such as the Australasian Latin
American Business Council (http://www.alabc.com.au/) to prosper. This chapter aims to contribute to the discourse in the field of market
commercialisation of new technologies to global market opportunities such as China, India and Latin America and offer a conceptual framework for market entry, diffusion and growth.
The chapter will incorporate three case studies on process innovations and product sectors that have penetrated global markets and develop a green entry framework. The case study process is designed to identify and develop a toolkit for market success criteria and pitfalls of commercializing and
4
such as supply chain elements, and how these interrelate with achieving sustainability goals.
Overview of the current green markets and global renewable energy market
The case for a going global green marketing framework
The increasing realisation that global economic prosperity and employment depends on a stable climate and healthy ecosystems is spurring investment in green products, green process technologies and services. As the OECD has recognised, strong environmental policies can no longer be regarded as a burden to economies. On the contrary, ambitious environmental policies have an
impressive track record in generating innovation, industry development, job creation and economic prosperity. The case of Germany (BMU, 2006) and Denmark (Christensen, Godskesen, Gram-Hassen, Quitzau & Ropke, 2007; REN21, 2008) leading the way in wind and renewable energy provides good examples of where active environmental industry policy has led to the
development of strong domestic markets. Brazil and India have emerged recently as two of the world’s fastest growing markets for renewable energy investment and green buildings. These developments in global destinations have opened up a range of opportunities in energy, technology, construction, architecture, engineering, building materials and equipment manufacture for domestic firms to seek overseas investment. Australian businesses have been moderately successful in the ‘clean green growth’ scenario accessing overseas markets. However, in other areas, particularly solar energy and other renewable energy technologies, some of Australia’s most promising technologies have only been commercialised overseas due to a lack of political interest and investment support in Australia (Green Gold Rush,
http://www.actu.org.au/Images/Dynamic/attachments/6211/Green_Gold%20_R ush_final.pdf; REN21, 2008). This chapter will advance the notion of overseas market development by identifying the types of green products and process technologies available in the marketplace and through case study analysis offer some success and failure criteria.
Green Market Opportunity
5
Current market for green services and product globally
In the Annual Greendex Report (2012), the emerging economies of Brazil, India, and Russia (BRIC)(O’Neil, 2008), along with Mexico and Argentina, rated in the top eight countries that had the highest sustainable behaviour. Green markets and industries, rapidly evolving globally in response to climate change and other environmental challenges, have significant potential for global businesses and local economies. Overall, global green markets are projected to double from $US1.4 trillion per year to $US2.7 trillion by 2020. Based on this analysis of 30 green industries globally, green innovator businesses are
particularly well positioned to succeed in the following six key markets:
• Renewable energy. Generally defined as the production of energy directly from natural resources, for instance; solar, geothermal, hydro and wind. • Energy efficiency. Improvements in current design, such as a better form
of lighting or water heating.
• Sustainable water systems. Reuse of Grey water, or hand washing, laundry and showering.
• Biomaterials. Eg, Biodegradable plastics.
• Green buildings. Akin to energy efficiency, natural lighting, recyclable grey water, water harvesting and automatic lighting.
• Biomass. Varied descriptions include; the use of waste products from processing of sugar (bagasse) for electricity generation, whole trees or part thereof for heating and electricity generation.
(Source: REN21, 2008).
Many global economies such as Australia, China, India, UK and LATAM, Brazil are aiming to implement government policy that creates strong market demand and pathways for industry development. It is predicted that in the six key industries, the creation of strong domestic markets supported by strong climate change and other policies could result in additional jobs for all economies by 2030. Unfortunately, in many scenarios inadequate domestic market demand fails to address skills and training for green industry
development and investment in green businesses with firms needing to look for opportunities overseas. The most recent data indicates that market success for green/clean technology is low and needs marketing development support (REEEP, 2008; Cadman and Hume, 2012). Using Australia as an example exporting of green technologies tends to make up only small contributions of all businesses (IDC, 2011) with mixed success in translating innovation capacity and natural resource advantages into business success in green industries globally (Green Gold Rush,
6
ush_final.pdf) with most successful innovators taking product overseas to larger markets with a greater green investment.
Stakeholder Analysis: Global Green players
Globally, the growth of clean technology indices is now consistently outpacing the broader market and presents a strong market potential. As a proportion of global venture capital investment, green industries are up from just 1.6 per cent of total investment in 2003 to 11 per cent in 2008 suggesting we are slowly improving success. Industries including biofuels and renewables, clean
technology and biomass as leading the way in investment capital. The value of sales from green energy sources like wind, solar and geothermal power and biofuels will continue to grow to as much as $US1 trillion globally a year by 2030, according to investment analysts (Green Gold Rush.
http://www.actu.org.au/Images/Dynamic/attachments/6211/Green_Gold%20_R ush_final.pdf). More than $US148 billion in new funding entered the
renewable energy sector globally in 2007, up 60 per cent from 2006. The highest levels of renewable energy investment are in Europe, followed by the USA. However, China, India and Brazil (REN21, 2008) have been drawing growing investor interest, their collective share of new investment growing from 12 per cent in 2004 to 22 per cent in 2007, representing an increase in absolute terms of 14 times, from $US1.8 billion to $US26 billion. With the move towards a low-carbon and more sustainable world, growing numbers of jobs are being created in these sectors (WBCSD, 2007). Almost 1.2 million workers are employed in generating biomass-derived energy in just four leading countries: Brazil, the United States, Germany (BMU, 2006) and China
(WBCSD, 2007). Overall, the number of people presently employed in the renewable energy sector runs to about 2.3 million (Securing Australia’s Energy future, http://www.efa.com.au/Library/CthEnergyWhitePaper.pdf) . The industry relies on strong consumer markets and aims to develop these over the next few years to maximise the market.
Who are the green consumers?
Climate change is viewed by most as a global problem. Concerns about the cost of energy and shortages of natural resources cloud the future of the environment and are important consumer considerations for sustainable living. Indian,
7
on sustainability and the global greenscape. The stakeholder customers include individual consumers, governments and businesses. Process technologies and green products are purchased for many reasons with focus on increased
efficiencies, lower waste, minimising negative climate effects and lower carbon. Particular reference to Latin America consumers will be incorporated into the case analysis, highlighting reference to initiatives and sectors that have been gaining traction. Despite improvements in renewable home energy saving systems such as solar and energy saving appliance, little improvement in food and goods manufacture and consumption can be found in the general green market place. Developed countries consumers’’ such as Australia and America rank poorly in transportation with little future changes planned for renewable energy usage and vehicle modification with Australians are among the least likely to use public transportation and to walk or cycle to their destinations. In Latin America, with higher populations and a longer focus on renewable energy, consumers are more familiar and supportive of green initiatives (State of the environment http://www.environment.gov.au/soe/2011/report/built-environment/2-1-livability.html)
Behaviour process in buying green products
Consumer behaviour, green habits and the drivers of green consumption are little researched in academic discourse, save for The National Geographic Society’s Greendex report (2012), which surveys 17,000 consumers across 17 countries to quantitatively measure environmentally friendly people. Consumer search and choice differs across the green consumer segments with personal, firm and government values and agendas influencing approaches. Interestingly, the social conscientious of firms impact these attitudes with many firms rarely opting for green innovation and portraying socially aligned and responsible innovation. In many countries, in particular Australia consumers have increased their consumption of imported goods and reduced consumption of self-grown foods. These are small trends toward market communities and consuming locally grown food, however the numbers are small and at this stage insignificant (State of the Environment,
http://www.environment.gov.au/soe/2011/report/built-environment/2-1-livability.html). Interestingly, in many countries a lower rate of drinking bottled water is evident however consumption of beef and chicken has not changed and these make a large environmental impact. These behaviours are all indication of the consumer’s understanding and approach to green and sustainable
practices ((WBCSD, 2007; State of the Environment,
8
What do the consumers think about green products?
Understanding the demographics and drivers of green consumerism can help entrepreneurs explore the environmental market domestically and globally and focus on likely prospects. Australian consumers’ attitudes toward the environment suggest a relatively high level of concern and a lower level of action (Hume, 2010). Climate change is viewed by most as a national and government problem. Concern about the cost of energy and shortages of water are considered of concern and important, with Australians feeling supportive of environmental problems (Hume, 2010). Consumers however also suggest that individual efforts are not worth it if governments and industries do not also take action. Cost considerations and environmental concerns are suggested to motivate consumers to adopt more environmentally sustainable behaviour. In general terms the actual retail cost, a lack of environmentally friendly options and clear information about green products and service offered are considered a deterrent to buy green (Hume, 2010). It appears that consumers are sending a message that they want “less talk and more action” from business and government, or at least action before talk.
In general terms much market research has been done on green consumers with market research suggesting green consumers: are sincere in their intentions, with a growing commitment to greener lifestyles. Most consumers suggest their environmental practices are inadequate. Consumers show a tolerance for
companies and green practice, they do not expect companies to be perfect in order to be considered 'green’ however they easily distrust firms who are caught making false claims. They look for companies that are taking some substantive steps and are making the commitment to improve. Consumers want green practice to be easy with only minimal inconvenience is tolerated by consumers of green products. In a recent poll, 58% of respondents cited poor product availability as a reason for not purchasing more green products.
Irrespective of the negative attitudes, consumers globally are eager to learn, and this means that consumer education is one of the most effective strategies that entrepreneurs can use when taking green products to market. There is a
perception amongst consumers that ‘green’ products will be less effective than existing brands with these consumers less likely to sacrifice quality than price. Assurances of quality are absolutely essential, and must be communicated convincingly. Quality is judged on many features, including performance, look, feel, fit, comfort, and durability. There is suggestion that currently the loyalist 'deep-green' market is too small to attract major competition with recent
estimates putting the size of this market at about 2% of North American
9
for environmental improvements. Premiums of more than around 2% can be charged only if the consumer perceives additional product value. This segment is moderately attractive with these factors influencing pricing strategy of any marketing and global strategy.
The most responsive age groups of green consumers tend to be children, teens and young adults, some adults, many of whom are influenced by their children. In addition, women are a key target for greener products, and often make purchases on behalf of men. The best 'green' customers are people with more money to spend (Pitney Bowes: http://news.pb.com/press-releases/corporate- citizenship/pitney-bowes-business-insight-and-earthsense-uncover-the-top-ten-green-us-states.htm). As a result, the most promising products for 'greening' tend to be at the higher end of the market. The most promising outlets for green products are retail stores frequented by wealthier shoppers, businesses with high carbon load and global markets looking for energy and food security. In
general, green consumers have the education and intellectual orientation to appreciate value; they will understand evidence that is presented in support of environmental claims and be discerning of information that is unprincipled.
Nielsen (www.nielsen.com/au/en.html) and NMI’s (The National Measurement Institute ,www.measurement.gov.au/) research identifies the, LOHAS model (Lifestyles Of Health And Sustainability) and suggests these green consumers are the top spenders in many areas. For entrepreneurs targeting their green innovations, this model can offer some valuable consumer insights. NMI estimates U.S. LOHAS products to be a $209 billion industry, and projects U.S. sales of LOHAS products to be more than $400 billion by 2010. These figures are similar for the other large global populations and markets positioning these markets are opportunistic for many green markets including renewables,
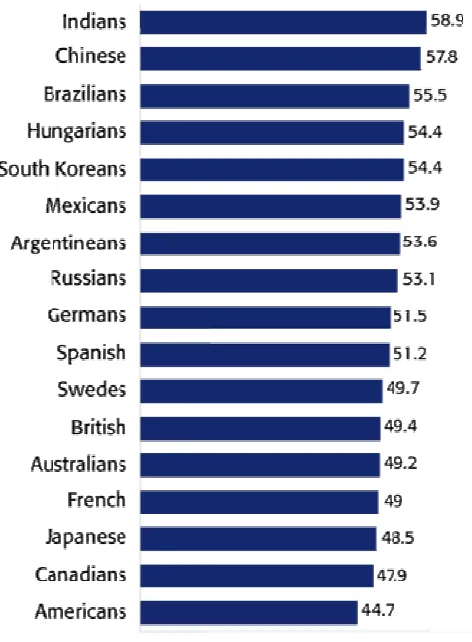
biomass and clean technology. The following table is the output of the Greendex Report (Greendex, 2012). The research explores individual
consumer behaviour and material lifestyle of 17,000 consumers in 17 countries around the world, and measures the specific choices and behaviours that
10 Figure 1: Ranking green consumers
Source: Greendex 2012: Consumer Choice And The Environment – A Worldwide Tracking Survey Highlights Report Published By National Geographic
To succeed, eco-entrepreneurs must not neglect the traditional values of price, quality, convenience and availability, we these factors supported by the
11
The green supply chain
In conjunction with specific product types firms have several opportunities to capitalise on green market opportunities and many ways in which they can innovate products and processes to fit green markets and creating differentiated products based on green attributes. Current practices in the green supply chain can support going global with a green strategy as a new process and as an efficient element for a current supply chain. Moreover, innovations in the green supply chain add green improvements and innovations to products that allow for differentiation and repositioning. Key areas include green design, green supply chain, G(reen) procurement, G(reen) design, G(reen) manufacture ,
G(reen)waste management and G(reen) retail and the role of development and distribution as a tool to increase productivity and eco-efficiency. This section will introduce these terms and apply them to the global greenscape.
Current Green Practice and Design
Business contributes to sustainable consumption through the manufacture of goods and services that are more ecologically efficient and durable, using fair trade practices and ensuring an economic benefit to the community (Tucker et al 2008; Peattie & Charter 2003). Consumers contribute to sustainability through purchase, use and waste. Consumer demands can drive business production and provide consumers with a direct opportunity to contribute to the goals of
sustainable business consumption through demand with governments driving sustainability through policy and incentive. Practices such as green
procurement, green manufacture, green retailing (Jones, Hillier, Comfort, & Eastwood, (2005) and the integration of these practices into service design are the fundamentals practices available to firms in creating a greenscape that deliver green product services, process innovations and promotional claims to consumers.
Marketers have responded to growing consumer demand for environment-friendly products in several ways, each of which is a component of green
practice and should be considered in any quality management programs. These include: 1) promoting the environmental attributes of products; 2) introducing new products specifically for those concerned with energy efficiency, waste reduction, sustainability, and climate control, and 3) redesigning existing products with an eye towards these same consumers. Marketing campaigns touting the environmental ethics of companies and the environmental
12
environment and satisfy consumer needs and desires (Tukker et al 2008). Indeed, true green marketing emphasizes environmental stewardship with green or environmental business and marketing defined as any business and marketing activity that recognizes environmental stewardship as a fundamental business development responsibility and business growth responsibility (Kanellos & Valos , 2010). This expands, to some extent, the traditional understanding of a business's responsibilities and goals.
Service Design transects many functional departments including marketing, finance, operations, human resource, research and development and information technology with the aim of service design to develop and design methods of coordinating and delivering ideas to the market place. Environmentally
responsible or "green" business practice takes into account consumer concerns about promoting preservation and conservation of the natural environment. In particular, green marketing campaigns highlight the superior environmental protection characteristics of a company's products and services. The sorts of green characteristics usually highlighted include such things as reduced waste in packaging, increased energy efficiency of the product in use, reduced use of chemicals in farming, or decreased release of toxic emissions and other pollutants in production.
Green design seeks to reduce negative impacts on the environment, and the health and comfort of stakeholders in the supply chain with the basic objective of sustainability and green services reduced consumption of non-renewable resources, minimization of waste, and creation of healthy and productive environments. Coupling this with the distinct objectives of traditional services design, green service design firms can offer efficient, productive and quality products from a “green” ideology. Although it’s not yet mainstream, many big companies are now pushing triple bottom line and corporate social
13
As procurement policies can have a significant impact on a company’s
environmental "footprint," given that somewhere between 50 and 70 percent of a company's overall costs originate from purchasing" green procurement has become a popular are of adoption and promotion for the green firm. Green procurement is a fundamental and essential element of green design with the ethos aiming to seek out and buy goods and services that are less
environmentally damaging. Generally, goods and services that are produced locally are less environmentally damaging than goods and services produced from afar, as less energy is expended getting them to the consumer. Green procurement is often supplemented with other environmentally friendly practices, such as reusing and recycling.
Green procurement integrates into the green manufacturing chain with it
focusing on manufacturing methods that support and sustain a renewable way of producing products and/or services that do no harm to you or the environment (Walton & Hume, 2011). Green manufacture and process flow and small incremental changes can make large differences to the environment and will flow on to other areas of the supply chain. Reducing the use hazardous chemicals, no testing on animals and packaging, labels and office
communication that are recyclable and minimise energy consumption are all elements of green manufacture. These claims are often used by green firms to legitimate and communicate their green practice. Green distribution is about being efficient, timely and cost effective, and supporting the sustainability
agenda with sustainable distribution focusing on storage and movement of goods in a way that supports continued economic growth while protecting the
environment and delivering a better quality of life for future generations. The need to reduce carbon emissions has driven the environmental challenge and positions green distribution as a key consideration in green design.
The final green activity within firms is green retailing with it often adopted by firm as a means of green practice (Tukker et al 2008). According to new research from the Australian Centre for Retail Studies (Tukker et al 2008) consumers are willing to spend more for green; green with increasing numbers demanding greener products from retailers and green brands. The major trends in global best practice green retail includes energy efficient stores, offering energy-efficient products, reducing packaging, green marketing and
14
highlight to current marketeers that marketing and retail practices; current trade practices issues and product line modification must be considered in the
positioning of the green product and services when penetrating international marketing. Issues including green locations and leasing, more sustainable customer interactions such as web and E Retail, greener and eco-advertising and green packaging need consideration in the branding of a green firm and product.
Green design seeks to reduce negative impacts on the environment, and the health and comfort of stakeholders in the supply chain. The basic objectives of sustainability and green services are to reduce consumption of non-renewable resources, minimize waste, and create healthy, productive environments. Coupling this with the distinct objectives of services design, green service design aims to offer an efficient, productive and quality service tailored to the requirements of the firm, the customer and other stakeholders and is delivered and developed from a “green” ideology (Joyce, Green & Winch, 2006).
Data and methodology
Exploratory research is a flexible and valuable tool for research (Babbie, 1989; Churchill, 1979; Kinnear and Taylor, 1996). The objective of exploratory research offer depth and thick descriptions to areas where little is known increasing the researcher’s familiarity with a problem and clarifying concepts (Patton, 1990; Churchill, 1979; Miles & Huberman, 1995; Zikmund, 1991; Churchill, 1979). It is suggested the interpretation of the findings are subjective and with small sample cases that cannot be projected to a wider population (Zikmund, 1991; Miles & Huberman, 1995) however the depth of data obtained is informative, valuable and offer insight not obtained from empirical research. This paper adopts a case study methodology to identify overall themes and practices and offer a deeper understanding of the global Greenscape the cases identified for examination are reflective and retrospective and include a range of green firms. These are selected to offer an in depth overview of the green innovation marketplace.
This research adopts a qualitative ethnographic approach and employs a
15
each of the case studies to provide the data variation and the theoretical saturation as recommended by Glaser and Strauss (1967), Eisenhardt (1989), Eisenhardt and Graebner (2007) and Perry (1998). Data from the multiple sources was divided into themes and categories based on literature findings The next stage progresses to narrative analysis, a subfield of discourse studies. Discourse studies have increasingly using types of linguistic analyses
(Alvevesson & Karreman, 2000; Soderberg, 2006). A computer-assisted text analysis of the interview transcripts was undertaken using Leximancer (Smith, 2000) and relying on a corpus-based approach (Stubbs, 1996). One advantage of the use of the Leximancer 3.0 system is argued that it makes the investigator aware of the global context and significance of concepts and helps avoid fixation on particular anecdotal evidence, which may be atypical or erroneous (Smith and Humphreys, 2006). Identification of the dominant themes of the cases was undertaken by examining the maps. Leximancer stochastically calculates of the concepts in the corpus, as recommended by McKenna and Rooney (2005). This visualisation technique enables investigators to see, in a global representation, the important concepts in the corpus and relationships between these concepts. Concepts that occur in very similar semantic contexts tend to form clusters. Each map is then used by the investigator to present an overall representation of the corpus and to guide interpretation.
Case examples of international alliances pitfalls and processes of practice “Latin America
[image:15.612.89.538.579.724.2]This section will highlight and discuss the criteria and globalisation processes of three cases. Each of these cases chose to enter the LATAM market and table 1 offers insight into the key PESTLE issues for going global to this market. The table depicts the Australian Brazilian relationship. Brazil offers incentive and encouragement for clean technologies whereas this has not yet been established in Australia, China, Indian and Russia. Brazil also has strong government support with electoral candidates running on the green ticket. It appears one of the key considerations distinguishing these countries is size, government objectives and population.
Table 1: comparison table of Australia and Brazil PESTLE
COUNTRY POLITICAL ECONOMIC SOCIO –
CULTURAL
TECHNOLOGICAL
AUSTRALIA Carbon Tax introduced in July 2012 Company establishment is simple Resources driven economy 2012 GDP growth = 3.5% GDP = $1.3T
Green if it is profitable Bo viable biofuels, biomass industry Solar, wind, wave receive
Innovative nation with small market
16 Ranking = 13
market acceptance BRAZIL Government
grant and incentive programs for electricity, biofuel / ethanol growth and biomass export programs Difficult for foreign company to establish presence Resources & Agribusiness 2012 GDP growth = 3.2% GDP = $2.2T Ranking = 6
Green candidate in 2012 election received 17% of round 1 votes Significant investment across ‘clean tech’ portfolio spectrum
Net buyer of
technology with large technology base of users
Investment available for local partnership Technology transfer is preferred model of government
The 3 cases will cover the 3 distinct green markets 1. Biofuels 2. Biomass and 3. Water technology. This section elaborates on the success criteria and pitfalls for market introduction, entry and diffusion through these case studies of agribusiness, biofuels and biomass technology transfers.
Case Study 1 – Energy Security and home grown transportation fuel
Description and idea origination
17
while Australian users were stating their green credentials, no-one had interest to introduce an environmentally-friendly transport fuel.
Market opportunities and scanning
Exploratory quantitative research identified two international markets, namely: United States of America (USA) and Brazil. Qualitative research clarified each market, identifying strong market barriers in the USA to foreign inventions, when compared to local competitive offerings and the constant food versus fuel debate. In comparison, Brazil offered an attractive investment and market profile, though presenting its own barriers, in this instance, language and regulatory, while dispelling any food versus fuel concerns, given biofuels have been produced for over 35 years, using only 1% of arable land and supplying 52% of fuel transport consumption with no impact on food production (Neves, Pinto, Conejero and Trombin (2011: 20). Comparatively speaking, Australia had no government support and a private sector presenting strong resistance to an environmentally friendly transport fuel, USA had some penetration, though deep set within the food versus fuel debate and heavily supported by government incentives, while Brazil was in its fourth decade of a country-wide revolution in the use of home grown biofuels and openness toward continued innovation.
Market selection
It is widely recognised that Australia’s economy in 2012 is growing on the back of a shovel, driven by a resource hungry international market. Fossil fuels, in part, are by products of some raw materials extracted from the earth that find their way back into the equipment used to further excavate and transport this material to the seaside ports. Thus, it could be said, there is reason to continue to use these refined fuels. Brazil, whose economy is also growing, due in no small way to international commodities demand, in contrast, has a home grown biofuels market, started as a result of the Middle Eastern oil crisis of the 1970’s. Two countries with similar economic drivers have developed far differing strategies for their passenger transportation. One, whose car manufacturing industry is strongly linked to overseas control. The other, who has attracted almost every car manufacturer inside its borders to research and manufacture vehicles to use biofuels, Three decades later, early prototypes have developed and vehicle manufacturers produce over eighty (80) passenger vehicle models, while the government mandates a twenty five percent (25%) consumption of biofuels in a tank of gasoline.
18
market looking for a biofuels solution for its non-passenger fleet, a government prepared to assist and an existing proof of concept validation of a process innovation is in place. The answer to ask, therefore, is ‘how does the innovative early stage company leverage itself to take advantage of the opportunity?’
Case Study 2 – Energy Crops for electricity grid and innovative supply chain management
Description and idea origination
This case study looks at process innovation for a device to reduce the supply chain costs associated with harvest of short rotation crops. Born from the notion of harvesting fast growing trees for use as a power source, Australian farmers saw the need for ‘energy cropping’ as a revenue stream for themselves while achieving a clean energy basis for the market. Market forces prevailed with power stations driving the financial model by giving a transparent floor price to the farmers, for the delivered raw material. Working backward to the field, calculations showed that harvesting and transportation consumed over Seventy percent (70%) of the raw materials’ delivery cost. A decade-long research and development program to understand the origins of these costs, funded through long enormous federal, state-government and private enterprise, resulted in a supply chain management innovation that cost $6 million to build the initial prototype. This product proposes to reduce harvesting and transportation costs by as much as fifty percent (50%) of the existing harvesting and transportation costs.
Market opportunities and scanning
The initial prototype successfully demonstrated the concept that a significant cost reduction could be achieved through a technology-enabled harvesting supply chain management innovation. In parallel, this process demonstrated two key unknown areas. Due to the geographical expanse of Australia and the associated population density, or lack thereof and the heavily-engineered design for purpose product, the actual cost of the invention proved prohibitive to a market that needed it, but did not have the quantity or density to leverage its potential. Australia, with growing regions track its coastline compares to Brazil and its growing regions sitting within a 2,000 by 2,500 kilometre region sitting within reach of the Tropic of Capricorn and containing large areas reaching rainfall of up to 1,600 millimetres (mm) per year, Australia’s largest rainfall areas of 600-700 mm per year fail to match the opportunity.
19
various species, particularly Eucalyptus, which surprisingly had been imported into Brazil from Australia one hundred years (100) earlier, a number of commercial entities had established themselves, broadly in the forestry market space but with a strategy to fulfil market requirements for Mandatory Renewable Energy Targets (MRETS) and deliver clean energy to the growing Brazilian energy matrix, what became known as the ‘pure energy play’ began to emerge. The uptake of MRETS is advanced more in European countries than Brazil, resulting in the growth of an export market with a commencement date of 2013. So, Brazil has the land mass, growing conditions, market forces and market participants as a potential target zone.
Market Selection
The trade-off between oil extraction, water content, cost of growth, a plantation’s holding cost and cost associated with harvesting the relevant tree size are some of the variables facing the decision of when to plant and when to harvest. At the time of writing, approximately 1 million hectares of short rotation or energy crops are planted in Brazil, thereby answering the second issue of demonstration. A market of sufficient size to require large number of harvesters, whose production costs would conceivably reduce through the learning curve of development and production, as it nears commercial release. Some more advanced than others, key market participants are readying themselves to fulfil demand (delivery) contracts commencing in eighteen months. Profit margins for the early mover and higher returns for the investor buoyed by the emergence of a new energy market await the astute participant.
Case Study 3 – Low Water, Low Carbon and the scalability of recycling Description and idea origination
Case Study 3 reviews a process innovation for the industrial sector in relation to the recycling of grey water and conservation of electricity. A son’s awareness of the soaring electricity and water costs and their impact on the profitability of the family-owned laundry business, gave rise to an innovative process that recycles eighty percent (80%) of water use, while simultaneously reducing electricity consumption by as much as Thirty percent (30%). Funded internally by the organisation to achieve savings for the business, the initial prototype took an elapsed timeframe of twenty four (24) months. The intellectual property process was followed and a patent application exists. Expansion into multi-story buildings followed and the company had successfully demonstrated external rigour to their invention, while simultaneously opening a new market segment.
Market opportunities and scanning
20
company for use in a separate environmental area. Upon discovery of this international company, presentation of this new market sector resulted in an exclusive, performance-based global agreement for the laundry industry. Armed with a partnership to attack the world, the key competitors are chemical based products and therefore, do not carry the green credentials of the innovation.
A key Brazilian mantra is Low Carbon, Low Water. Committed to continuing the green content of the energy matrix and maintaining a minimum fifty percent (50%) clean energy threshold, low Carbon is evident in the market place and is often demonstrated through investments by typically non-green participants into green technologies. The recent Vale investment of $350 million into the building of wind farms is one example. In a country where rainfalls can reach over 1,600 millimetres per annum, it would appear on the surface that there is an abundance of water. The truth is that half the nation remains water-poor and the sustainable retention of this natural resource is a critical element in the nation’s future sustainability strategy.
Market Selection
Performance-based contracts last as long as the partner is prepared to achieve. Akin to a ticking time bomb giving notice to its detonation, the signing of a global agreement forces the company into an action to which it may not be prepared. A successful sourcing of capital gave rise to documentation for process innovation and technology validation. Commissioned research highlighted priority market segments and Brazil sat in the top 10. In a land of dense population where the typical home sits inside a multi-storied building, laundry is an outsourced activity. Laundries are as common as street corners and as visible as the high rise buildings from where the cleaned product originates. The geographical size of a major capital city of Australia, such as Melbourne, matches that of Sao Paulo, whose population matches that of Australia. As the market waits for a solution, the company has capital in place, external rigour on validation conducted and a documented process innovation to strengthen the company’s foundation for international entry. Who is the right partner and when can they be found?
LATAM Brazil’s Green Market Summary
21
and the government imposes heavy tariffs on the importation of goods, not so as to douse foreign technological advances reaching its shores but to encourage technology transfer with local entities through formal partnerships. Respecting the will of the country to successfully enter the nation, behold its wishes and use the willingness to form a partnership as an arrow in the quiver of strategic entry. Australian-based technology validation is the ‘door-opener’ to attracting the eye of the partner. Appropriately focused quantitative and qualitative research is a methodological approach to targeting the right partner, while conducting locally-based validation, either through a well established private-public research partnership model or directly with the targeted commercial partner, gives the stamp of approval from which to proceed with market penetration.
Investment inside Brazil differs from that in Australia. Digging precious commodities from the ground and growing the food basket above the Earth are two sectors shared by Australia and Brazil, who also share the Southern Cross as an integral element of their respective nation’s flag. Brazilians are aware of its connection with Australia and several technology transfers have taken place in these sectors that further enhance the willingness to conduct business. Angel investment is a key source of funding in Australia (http://www.australianinvestmentnetwork.com/home. It is true that an investment angel community exists in Brazil but family offices are the visible
face of technology investment
(http://www.australianinvestmentnetwork.com/home). Brazil is an older country than Australia. While Australia celebrated its bicentennial in 1988, in 2012, twenty four years later, Sao Paulo celebrated its 400th year since birth. Business ownership of this period has produced numerous family dynasties with many adopting a diversification approach to investment with renewable technologies placed high on the priority list. Relationships hold the keys to success in this market and the primary form of networking is through personal contacts. To achieve entry into this environment, a broad range of contacts is required, particularly in the commercial centre of Brazil, Sao Paulo. Home to 22 million persons in the greater Sao Paulo city and 40 million in its state, it contributes over 30% of the country’s gross domestic product.
22
Findings and Analysis
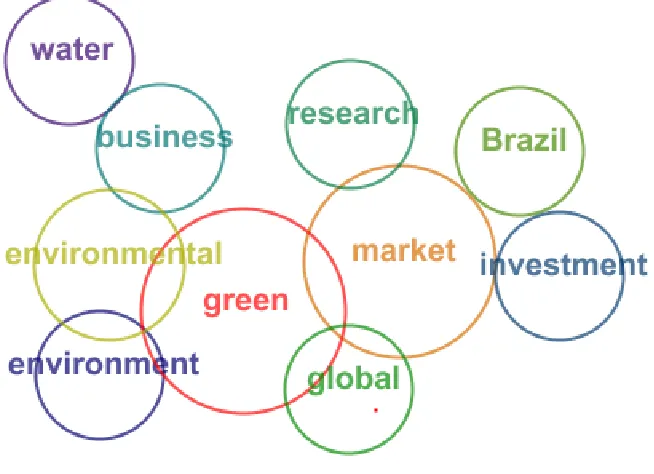
This section will elaborate on the descriptions of the short cases offered and the findings of the case, the leximancer results and the case assessments. The leximancer maps allow for collation and assessment of vast amounts of case materials and allow for unbiased judgement of this material. A global map of the themes was produced leading to an enriched interpretation. The cases were analysed using data analysis from Leximancer 3.0
[image:22.612.167.494.391.628.2](https://www.leximancer.com/) output, the key and global concepts and green cases material and interview data and were collated and themes identified. Each firm was analysed separately and in cross comparison. The data output and global mapping is discussed in this section. The following map Figure 1 identifies the global nodes of the combined cases with the pathway map, Figure 2, offering insight in related themes, concepts and relationships of the case content. The process offers affirmation and verification of the case analysis and adds to the ethnography and identifies the important areas of function that should be considered for successful market penetration with green product. These following maps will inform and add value to the discussion.
23
Examination of the map presented in Figure 2, themes and concepts within the maps led to the identification of a number of recurring themes. The global themes of Green and Market are most prominent in the analysis and represent the focus of the firms and the nature of each case. The overlapping concepts of
research and global suggest that research is essential for market development and the green market is global in nature and support the critical analysis of cases offered in Table 1. Interestingly, Investment and Brazil present newer concepts that are yet to intersect the market node and suggest the novelty of the Brazilian market with investment in this market emerging and growing.
The evident themes of green, environment, environmental and business were consistently identified in the map of narratives of all cases and case material. These were identified explicitly as key nodes central to the map. Specific firm material and documentation analyzed supports the themes/central node from each firm. Environmental, environment and green all overlap identifying the nature of the green markets is directly related to environmental causes and improvement to the environment. The pathways of business and water depict the emergence of businesses offering environmental product and services related business. The map depicts the popularity of business related to water security, purification and conservation. Hydro energy and water business are also aligned to the goals of many global markets for energy security and this node depicts that popularity. Moving beyond the cross compared map the pathway diagram offers an enriched interpretation of the interrelationships of many concepts and themes. Each pathway is identified by considering the global themes, the centrality in the map, relationship with other themes and concepts within themes. The pathways are discussed in the following section and adopt a collective approach to all cases.
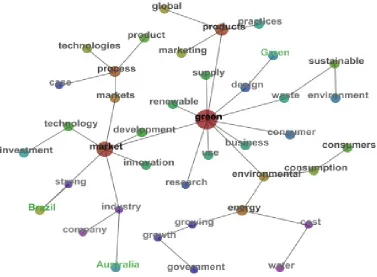
Using leximancer 3.0 a pathways diagram is offered that advances the critical analysis and the global node map of the cases offered. The pathways diagram demonstrates the relationships from the four key nodes of green, market, products and process. As expected, the majority of pathways emanate from
Green, as it forms the central node of the case study analysis. Market and
Products link directly to Green, where Research, Use , Renewable, Supply and Business have no further linkages. This may be due to the notion that they are logical elements of Green, though as yet, undetermined as to why they may not link directly to other pathways and could be advanced by further specific
research. Environmental is deemed to have consumption and consumers as its connections, suggesting it is more of a mindset than an output. Should this hold, Environmental products would have a solid link to markets with consumers who have beliefs in the environment. Waste has two logical
24
Environmental with cost a demand input and Water, an important market segment. This is consistent with the ‘waste water’ case study that connects the strong demand originating from Brazil for hydro or water products and the need for associated technologies. Energy is growing and shows growth with a
connection to some form of government intervention. Again, this is consistent with each of the case studies, where Brazil has solid government intervention on biofuels, biomass and water. As process-defined Products, it is logical to see that Practices are required in order to deliver the product, where Marketing is an inclusive determinant to pursue the Global nature of the Product.
Markets are a pathway from Market that include the Process relationship of
technologies that in turn, relates to product as one endpoint and case as the other. These relationships are understandable, given the relevance of the case study analysis and the product’s basis in technology. A Market as a subset of a dynamic environment or country would require ongoing development and
continuous innovation to meet the market’s demands. Technology as a defined linkage of Market, further emphasises the relationship of the technology-based case studies and highlights the need for investment in order to flourish in the designated market choice.
There is a strong market link to Brazil and Australia sits at the pathways’ end in relation to the industry and the company’s within. It could be said that Australia is included due the nature of the case studies originating from Australia;
25
Figure 3: Leximancer pathways and relationships
[image:25.612.89.496.569.713.2]Table 2 offers a summary of the current practices of each of the cases used and applies this to marketing theory and knowledge. Using critical analysis the content has been coded and aligned to known marketing terms and practices. It is clearly identified that basic market functions are required and should be mapped from commencement. It should be noted that research and data validation is seen as a vital practice for these firms into the emerging markets with testing and market research an essential requirement for market success. Markets such as Brazil, Philippines, Latin America, United Arab Emirates and in particular Brazil were all identified as strong prospects for penetration and success. All products were in the growth phase of the product life cycle.
Table 2: Summary of case findings
Company 1 Biofuels
Company 3 Water
Company 2 Biomass Global
Market selected
Brazil, Philippines
Latin
America(LATAM), United Arab
Emirates
Brazil, LATAM
Product or service
Product process Product Process Product process
26 Company 1 Biofuels Company 3 Water Company 2 Biomass in cycle Mode of entry Research partnership & Joint Venture (JV) investment partner Technology transfer to local distribution / investment partner
Manufacturing partnership & local investment
Government support
High Medium-high Low-medium
Venture capital
Yes. Levels to be determined by JV partner
Yes. funding through local distribution partner
Yes. Funding being pursued via manufacturing partnership Other global market potential South Africa, USA South Africa, LATAM, Mexico, UAE LATAM, Northern Europe, USA, Canada Marketing functions needed Laboratory testing to confirm data validation, government liaison for lobbying, local pricing needs to be better
understood
Local agent to develop installation process, transpose original to local conditions, government assistance to be detailed
Map
manufacturing process to local conditions, conduct local validation, investment personnel Global practices needed Data validation, Product development, process design Data validation, Management education, research options Data validation, Technology transfer
Proposed framework, discussion and recommendations for going global with green/renewables
27
business and marketing material focussed on market entry into Latin American Markets. Figure 2 maps the entry, arrival and ongoing practices required for global market entry into Brazil for clean technology products and process, with Table 2 offering the specific nuances for each product and process. On entry is essential to create value, and plan. On arrival the activities are focussed on creating partnerships and alliances with local stakeholders and competing research to support product claims and market needs. Finally, it is essential for ongoing development to ensure that research is continued, marketing is
28
29
Reflections and future research
Technology Type Group 1 Sustainability Group 2 Process Group 3 Biomass Entry objectives
Awareness that it is an active and growing market. Product development positioned through research, is essential
Particular to industry type
Establish relationships and partnerships through the early stage of market growth Examples of Marketing development practice Large company structures and diversification strategies Through solid industry associations, demonstrate market benefit Spinoff planning associated with existing market condition
Marketing objectives
Joint ventures are proving a successful model
Identify traditional sales and distribution operating in market
Specific to market participant
The needs of Industry specific research Linkage between theoretical research and commercial application. Benefit analysis modelling
Industry wide impact. Productivity increase and return on
investment
Logistics and supply chain relevance Cross-border collaboration Geographical positioning reflects technological market similarities
Existing research can leverage advanced market deployment
[image:29.612.90.527.76.503.2]Australia tends to lead development for this product through a government research agency, though the practical application lags emerging economies
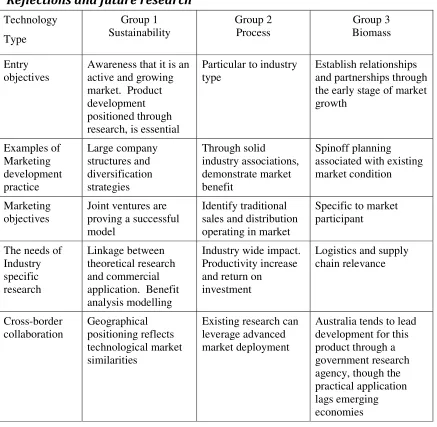
Table 3: Reflections and Recommendations
The Table 3 depicts some specific reflections for market entry of the potential green products segments discussed; clean technology, process technologies and renewables. The table offers insight to the penetration of product into global markets and offers insights to global green technology penetration. It is noted that these companies are technically-skilled however have little understanding of marketing principles and their position within international market entry. This includes opportunities for external linkages to research facilities and industry associations, the impact of successful government liaison on funding, establishment of alliances and penetration of new markets, and ongoing market research. These factors are all vital to the successful penetration of new world green markets.
30
Conclusions
The chapter has offered 3 case studies on process innovations and product sectors and has shown how these cases have developed a strategy of entry to Brazil as a green market opportunity. Given the position Brazil has within the Greendex Report (2012), it would be acceptable to extrapolate that India, China and Russia, who make up the other top three positions and the developed
nations of United States of America, France and Canada make up the bottom rankings, this document relates to the BRIC nations and is not just confined to Brazil. The ‘success and failure criteria” identify how planning, patent and partnerships are essential for successful entry. The chapter offered insight into the different types of green products and supply chain process technologies that form the green marketplace. This included specific content on G (reen)
markets, market information, marketing functions for market entry and market diffusion for renewable products and process technologies such as supply chain elements, and how these interrelate with achieving sustainability goals. Finally, this chapter presented a strong case for entry into Brazil, and positioned this destination as a prime opportunity for green investment.
References
Alvesson, M., & Karreman., D. (2000). Varieties of discourse: On the study of organizations through discourse analysis. Human Relations 53 9 1125–1150
Angel Investors (2012) retrieved from
http://www.australianinvestmentnetwork.com/home
Austrade’s International Data Comparisons (IDC) (December 2011) Australian Government Australian trade commission. Australia Unlimited.
Australian Latin American Business Council (2012) retrieved from http://www.alabc.com.au/
Babbie, E. (1989) The Practice of Social Research, Belmont CA, Wadsworth Publishing Company Inc.
Franz P., Taeger U., & S Tidow (2006). Ecological Industrial Policy - Memorandum for a “New Deal” for the economy, environment and
31
Cadman, T., & Hume, M. (2012). Developing Sustainable Governance Systems for Regional Sustainability Programmes and ‘Green’ Business Practices: The Case of ‘Green’ Timber. In I. Management Association, USA (Ed.), Regional Development: Concepts, Methodologies, Tools, and Applications (pp. 467-485). Hershey, PA: Information Science Reference. doi:10.4018/978-1-4666-0882-5.ch 304
Eisenhardt, K. (1989) Building Theories from Case Study Research, Academy of Management Review, October, 14 4 532-550.
Eisenhardt, K., & Graebner, M.E., (2007) Theory Building from Cases: Opportunities and Challenges, Academy of Management Journal, 50 1 25-32.
Glaser, B. & Strauss, A, (1967) The Discovery of Grounded Theory: Strategies for Qualitative Research, Chicago, Aldine Publishing Company
Global scan http (2012) retrieved from://www.globescan.com/
Greendex (2012) Consumer Choice and the Environment – A Worldwide Tracking Survey Highlights Report Published By National Geographic
Green Gold Rush
http://www.actu.org.au/Images/Dynamic/attachments/6211/Green_Gold%20_R ush_final.pdf)
HM Treasury Independent reviews (2010)
http://webarchive.nationalarchives.gov.uk/+/http://www.hm-treasury.gov.uk/sternreview_backgroundtoreview.htm
Hume, M. (2010) Compassion without action: examining the young consumers consumption and attitude to sustainable consumption. Journal of World Business, 45 4 385-394. ISSN 1090-9516
Instituto do Brasileiro de Geografia e Estatistica (IBGE). (2011) retrieved from www.ibge.gov.br
Joyce, P., Green, R., & Winch, G., (2006) "A new construct for visualising and designing e-fulfilment systems for quality healthcare delivery", The TQM Magazine, 18 6 638 – 651
32
Overall Business Strategy. Published by Faculty of Business and Law Deakin University
Kinnear, T C & J R Taylor (1996) Marketing Research: An Applied Approach, New York: McGraw-Hill.
Leximancer 3.0 (2012) retrieved from (https://www.leximancer.com/)
McDonald, S. and Oates, C. J. (2006), Sustainability: Consumer Perceptions and Marketing Strategies. Business Strategy and the Environment, 15:157–170
McKenna, B.,Rooney, D., (2005). Wisdom management: Tensions between theory and practice in practice. Conference Proceedings of Knowledge Management in the Asia Pacific (KMAP). Wellington, NZ. November.
Miles, M,B & Huberman, A,M. (1994) An Expanded Sourcebook :Qualitative Data Analysis (2nd edition), Sage Publications International.
Nielsen statistics (2010) retrieved from (www.nielsen.com/au/en.html)
Neves, M.F., Pinto, M.J., Conejero, M.A. and Trombin, V.G. (2011). Food and Fuel: The Example of Brazil. Wageningen Academic Publishers.
OECD, 2003. Environmentally sustainable buildings – challenges and policies.
O’Neil. J., (2006) Another BRIC In The Wall The Perils Of Overestimating Emerging Markets. The Economist, 4 1
Patton, Q M (1990) Qualitative Evaluation and Research Methods, (2nd edition), Sage Publications.
Peattie, K. and Collins, A. (2009), Guest editorial: perspectives on sustainable consumption. International Journal of Consumer Studies, 33 107–112.
Perry, C. (1998). Processes of a Case Study Methodology for Postgraduate Research in Marketing, European Journal of Marketing, 32, 9/10, 785-801.
33
REN21, Renewables (2007) Global Status Report (Paris: REN21 Secretariat and Washington, DC: Worldwatch Institute). retrieved from
www.ren21.net/globalstatusreport/default.asp
Renewable Energy and Energy Efficiency Partnership (REEEP) and Clean Energy Council Australia, (June 2008), Regional Export Opportunities for Australia’s Clean Energy Industry
Stern. N. (2006) Stern review on the economics of climate change; UK Treasury United Kingdom
Stern, N., (2006) Stern Review on the economics o climate change: What is the Economics of Climate Change? Discussion Paper, Office of Climate Change UK Government.
Stubbs, M., (1996). Text and Corpus Analysis: Computer-Assisted Studies of Language and Culture. Cambridge, MA, USA, Blackwell Publishers
Sustainable systems and energy management at the regional level: comparative approaches. Information Science Reference (IGI Global), Hershey, PA, USA, 365-382. ISBN 9781613503447
Securing Australia’s Energy future (2009), retrieved from http://www.efa.com.au/Library/CthEnergyWhitePaper.pdf
Søderberg, A-M., (2006). Narrative interviewing and narrative analysis in a study of a cross-border merger. Management International Review, 46 4 397-416
State of the Environment, 2011 retrieved from
http://www.environment.gov.au/soe/2011/report/built-environment/2-1-livability.html
The National Measurement Institute (2011), retrieved from www.measurement.gov.au/
Tukker, A., Cohen, M. J., de Zoysa, U., Hertwich, E., Hofstetter, P., Inaba, A., Lorek, S. and Sto, E. (2006), The Oslo Declaration on Sustainable
Consumption. Journal of Industrial Ecology, 10 9–14.
UNEP (United Nations Environmental program) 2002: Environment for Development - UNEP-Publications retrieved from
34
Uiterkamp A.J M & Vlek, C. (2007) “Practice and Outcomes of
Multidisciplinary Research for Environmental Sustainability” Journal of Social Issues, 63 1 175--197
World Business Council for Sustainable Development (WBCSD)
2007. Powering a sustainable future: policies and measures to make it happen\
Walton, A. and Hume, M. (2011), Creating positive habits in water
conservation: the case of the Queensland Water Commission and the Target 140 campaign. International Journal of Nonprofit Voluntary. Sector Marketing 16 215–224