Rochester Institute of Technology
RIT Scholar Works
Theses Thesis/Dissertation Collections
1998
Trends in the use of technology in hospital menu
system
Karen Wunder
Follow this and additional works at:http://scholarworks.rit.edu/theses
This Thesis is brought to you for free and open access by the Thesis/Dissertation Collections at RIT Scholar Works. It has been accepted for inclusion in Theses by an authorized administrator of RIT Scholar Works. For more information, please [email protected].
Recommended Citation
TRENDS IN THE USE OF TECHNOLOGY
IN
HOSPITAL MENU SYSTEMS
by
Karen A. Wunder
A thesis submitted to the
Faculty of the School of Food, Hotel and Travel Management at
Rochester Institute of Technology
in partial fulfillment of the requirements for the degree
of
Master of Science
FORM I
ROCHESTER INSTITUTE OF TECHNOLOGY School of Food, Hotel and Travel Management
Department of Graduate Studies
M.S. Hospitality Tourism Management Presentation of ThesislProject Findings
Name: Karen A. Wunder Date: 7-20-98 SS#:
-Title of Research: Trends in the Use ofTechnology in Hospital Menu Systems
Thesis Committee:
Faculty Advisor:
(1) (2)
Dr.Carol Whitlock (Chairperson) Elizabeth Kmiecinski. MS
Elizabeth Kmiecinski. MS
Number of Credits Approved:
I1?3
J
f'!Y
Date
06 Credits
Committee Chairperson's Signature
Department Chairperson's Signature
ROCHESTER INSTITUTE OF TECHNOLOGY Department of Hospitality and Service Management
Graduate Studies
M.S. Service Management
Statement Granting or Denying Permission to Reproduce Thesis/Graduate Project
The Author of a thesis or project should complete one of the following statements and include this statement as the page following the title page.
Title of Thesis/projeet: Trends in the Use of Technology in Hospital Menu Systems
I, KarenA. Wunder , hereby (grant, deny) permission to the Wallace
Memorial Library ofRLT., to reproduce the document titled above in whole or part.
Any reproduction will not be for commercial use or profit.
OR
I, ,prefer to be contacted each time a request
for reproduction is made. I can be reached at the following address:
ABSTRACT
As the trenty-first centuryapproaches, hospital foodservice directors are
facedwith theconflicting tasks of cutting costs in response tovarious budgetary
restraints while also providing quality service to customers with increased
expectations in an increasing competitive environment. New technologies such
as computerized, interactive menu systems have been developed in an attempt
to offer increased customer satisfaction while also cutting costs at all levels.
The focus of thisstudy wasto determine how hospitals nationwide were
responding to the dilemma of cost cutting while achieving increased quality
standards and in what ways technologies were being embraced to provide
service excellence at cost savings.
The studysought to identifythe mostcommonly utilized menu systems in
US hospitals and to identifytrends in the use of recent technologies for such
menu systems.
Questionnaireswere sent to 300 hospitals from 41 states and
Washington, DC. Programs and routines in the Statistical Package forthe
Social Sciences (SPSS-X, version 2.1, 1986, SPSS, Chicago, IL) were used
for all data analyses. One hundred and thirty-five (47%) of questionnaires sent
were returned.
Results indicated that 3 ofthe 135 respondents were utilizing automated
menu displaysystems, the majority (70%) of hospitals were still utilizing
utilized for recording menu choices, 12.6% were using a computer in the diet
office, 3% were using hand-held computers, 2.2% were using voice activated
computers, and 0.7% were using scanners. The question was not applicable
for 9.6% of respondents whooffered a non-select menu, and 1.5% of hospitals
who indicated that theyserve meals immediatelyas ordered.
The majority of respondents indicated that theywere somewhat satisfied
with theircurrent menu system regardless of whether or nottheyhad an
automated system in place. Most respondents indicated that they would
TABLE OF CONTENTS
Abstract ii
Acknowledgments vi
List of Tables vii
Chapter I. INTRODUCTION 1
Problem Statement 3
Background 3
Purpose 6
Significance 6
Hypothesis 7
Assumptions 7
Scope and Limitations 8
Long Range Consequences 8
Definition of Terms 1 0
Chapter II. LITERATURE REVIEW 12
The Changing Paradigms of Healthcare 12
Obstacles for Change 14
Meeting the Demands of Customers 15
Satisfying the Needs of Customers
Through Technology 1 6
The History of Technology in Foodservice... 1 9
Table of Contents (continued)
Addressing the Problems of Traditional
Menu Delivery Systems 21
Implementing Foodservice Technology 24
Automated Systems in Progress 27
Chapter III. METHODOLOGY 30
Questionnaire Development 30
Data Collection 30
Data Analysis Method 33
Chapter IV. RESULTS AND DISCUSSION 34
General Characteristics of Respondents 34
Characteristics of Menu Display Systems 37
Chapter V. SUMMARY, CONCLUSION,
RECOMMENDATIONS 51
Summary 51
Conclusions 51
Recommendations 52
Bibliography 53
Appendices 55
A. Cover Letter to Foodservice Directors 5 6
ACKNOWLEDGMENTS
I am grateful to Dr. Carol Whitlock for her constant support, extreme
flexibility, realistic wisdom, and generous encouragement.
I would like to thank Liz Kmiecinski for her patience and guidance
throughout the project.
I would also liketo thank Sharon Keys, Jim Frederiksen andthe staff of
Strong Memorial Hospital's Department of Food and Nutrition Services for their
time and assistance in getting thisproject started.
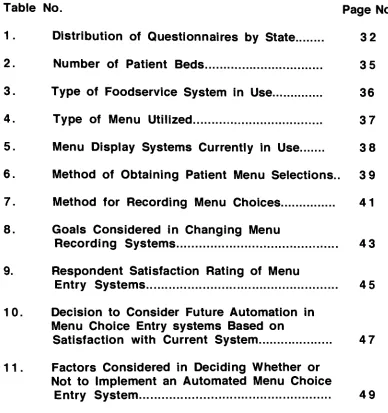
List of Tables
Table No. Page No.
1. Distribution of Questionnaires by State 3 2
2. Number of Patient Beds 3 5
3. Type of Foodservice System in Use 36
4. Type of Menu Utilized 3 7
5. Menu Display Systems Currently in Use 3 8
6. Method of Obtaining Patient Menu Selections.. 3 9
7. Method for Recording Menu Choices 41
8. Goals Considered in Changing Menu
Recording Systems 43
9. Respondent Satisfaction Rating of Menu
Entry Systems 45
10. Decision to Consider Future Automation in
Menu Choice Entry systems Based on
Satisfaction with Current System 4 7
1 1 . Factors Considered in Deciding Whether or
Not to Implement an Automated Menu Choice
[image:10.526.37.425.105.518.2]Chapter I.
INTRODUCTION
Today's hospital foodservice directors are faced with the conflicting and
challenging task of cutting costs in response to budgetary constraints while
providing service of utmostquality to customers with increased expectations in an increasingly competitive environment.
Budget cutting often involves reductions in the areas of department
staffing, availability of menu items and services, decreased use of high quality, brand-identifiable food items, and ultimately a reduction in quality of services.
However, the quality of the food service often produces positive word of mouth
among patients which is increasingly significant as competition grows.
Hospital food service and cuisine are fabled for literally leaving a bad
taste in one's mouth. One can envision the traditional scenario. Atrayoffood is
served byan employee who simply places the tray in the room and rushes out. The food is bland in both looks and taste, and probably not what the patient
ordered ifany ordering was done at all. Ifthepatient staysatthe hospital two or three days, he or she may eventually select from a menu or converse with a foodservice employee who will record his or her food preferences. For many
Average hospital stays have now become shorter in response to
increased ambulatory care and hospitals are increasingly responding to
market-based competition.
It is now imperative that hospital foodservice departments provide competitive
quality at the lowest possible cost. New technologies such as computerized,
interactive menu systems could theoretically allow foodservice departments to
offer increased customer satisfaction while also cutting costs atall levels. The
focus ofthisstudywas todetermine how hospitals nationwide were responding
to the dilemma of cost cutting while achieving increased quality standards and
in what ways technologies were being embraced to provide service excellence
PROBLEM STATEMENT
Numerous strategies may be utilized for adjusting a hospital menu
system in response to budget constraints and/or increased service quality.
Some hospitals have focused predominantly on financial limitations by offering
less food selections at meals or no choices of food items. Others have been
motivated by competition and service excellence, offering restaurant or hotel-type service or by offering increased personal interaction between patient and
hospital representative. Still others have attempted to find a way to both cut
costs and increase customer satisfaction, often utilizing technologies such as
computerized menu systems. This was an attempt to identify a wide range of current menu systems strategies and the rationale for such operations.
Specifically, thisstudyexamined the extentthatnew technologies were use and
theoutcome or predicted outcome tocost and patient satisfaction.
BACKGROUND
Thetraditional hospital menu service involves printed, paper menus that
are usually generated from a dietary department office and passed by hand to each patient. The patients are given a certain length of time to select menu
choices forall three meals forthe nextdaybefore theyare picked upby hospital
edited to assure that the selections picked by the patient comply with therapeutic diet restrictions.
This system has various shortcomings. Usually, many employees are
involved in the menu delivery and pick up process. For example, one
employee may be in charge of delivering all menus to a patient unit, another
responsible for delivering the menus to each patient, another in charge of
picking up the menus and returning them to the kitchen, and yet another
employee responsible forreview and editing the menu selections. Often various departments are involved. Foodservice employees, for example, may be
responsible for delivering the menus to patients, but it may be nursing or unit
staff who are actually available to patients on the unit to assist in the menu selection and retrieval process. Foodservice staff with clinical nutrition training
may then be responsible for reviewing and editing selections. Ifone of these employees fails in his or herduties, the patients will not receive their own meal
choices.
Paper menus are often expensive to print and are environmentally
wasteful. Theyofferlimited information to patients, are generally inflexible, and
are easily lost and soiled. Menus are usually picked up from patient rooms in theearly afternoon. If a patient arrives after the scheduled menu pick up time, he or she usually has no opportunity to select menu choices. In these cases,
thepatients must accept standard menu fare forall mealsforthe following day. Hospitals as a whole are responding gradually to theproblematic area of
others have made some modifications such as prescreening some patients for
food preferences and menu selections prior to admission or installing
computers to print menu selections and store patient food preference data.
Other facilities have taken more user friendly measures such as installing
interactive software thatallows patients toselect menu items fromtheir rooms or
providing staff with palm held computers that allow patient selections to be
personally retrieved and instantly conveyed tothekitchen diet office.
A brief pilot study of five Rochester, New York area hospitals was
conducted. Foodservice staff from Strong Memorial Hospital, Highland
Hospital, St. Mary's Hospital, Rochester General Hospital, and Park Ridge
Hospital were asked to briefly describe the menu presentation and selection
recording systems currently in place. All five hospitals presented meal choices
to patients via paper menus. Two of the five had computerized diet offices.
Three of the five were obtaining menu selections from patients by collecting
menus with patient circled food choices. One hospital was utilizing hand held
computers operated byfoodservice staffto obtain patient food selections, and
the other was experimenting with palm top computers at the time of this study.
PURPOSE
The purpose of this study was to identify the most commonly utilized menu systems in US hospitals and to identify trends in the use of recent technologies forsuch menu systems.
SIGNIFICANCE
Inthisera ofincreasing hospital downsizing, merging, and even closings,
identifying competitive methods involved in the inpatient foodservice menu
delivery system is important. Foodservice administrators will have interest in
thisstudyas a method ofobtaining market survey data to determine whether or
not their present procedures are up to current market standards and to obtain
ideas for possible systems improvements. The study is significant to
HYPOTHESIS
Theexpected result ofthis studywasthat,while automated menu system
technologies arebecoming increasingly available, they are currently not widely
used to convey menu choices. The hypothesis was based on the pilot study
wherein none of the five hospitals surveyed were utilizing automated methods
toconvey menu choices to patients. As the pilot study revealed that two of the
five hospitals surveyed (40%) were utilizing some form of computerization to
record patient menu selections, it is further hypothesized that the data will
reveal thatlessthan one-half ofhospitals surveyed will be found to be currently
using software packages toassist inthe recording of patient menu selections.
ASSUMPTIONS
Ideological
Any analysis to be done in the comparison of hospital menu systems
must guard against personal bias.
Procedural
Itwas assumed that foodservice directors were able to determine which
menu systems were presently in use or have been used in the past and that
they have provided accurate responses to the questions contained in the
questionnaire. Since the SPSS-X software was used for statistical analysis of
data, it was was assumed that the results were not manipulatable as data was
numerically scored.
SCOPE AND LIMITATIONS
This limitations of this study were affected by the selection of the
participants and by the scope of the study. The study was focused on
discovering trends in menu systems and does not detail the strengths and
weaknesses ofanyofthe menu systemscurrently being utilized.
LONG RANGE CONSEQUENCES
The results of this study can serve to stimulate further research on the
use of technology to improve customer satisfaction in regard to foodservice in
health care. Should the findings of this study be in accordance with the
hypothesis, further research should be undertaken to further validate the
hypothesis, will be beneficial for all foodservice directors in determining the
DEFINITION OF TERMS
Automation Automaticoperation of an apparatus, process, or
system by mechanical or electronic devicesthat take
the place of human operators (Webster, 1964)
Blast Chilling Process wherein food is cooked, quicklychilled, and
later reheated.
Continuous Quality
Improvement - A
long-term, proactive strategyto improve patient
care and satisfaction, increase utilization, strengthen
productivity, and enhance cost-effectiveness
throughout the organization (Byers et al., 1994)
Cycle Menu A menu that repeats at regular intervals
(Kotschevaretal., 1996)
Entrepreneurship - The act of organizing, managing, and
assuming
Full Time
Equivalent (FTE) Employeewho works on afull-time basis for a
specific period of time(Byers et al., 1994)
Paradigm A mental frameof reference thatdominates the
behavior and thought processes of an
individual or group of individuals (Albrecht, 1990)
Paternalism The principle or practice of governing or of
exercising authority (as over a group of employees)
suggesting the care and control exercised by afather
over his children (Webster, 1964)
Segmentation - The process of
dividing into many sections (Webster,
1964)
Service Ataskperformed by onepartyfor thebenefit of
another (Albrecht, 1992)
Technology - A technical method of achieving a practical purpose
(Webster, 1964)
Chapter II.
LITERATURE REVIEW
The Changing Paradigms of Healthcare
The health care industry is currently in a vast state of change. Costs are
high, with health care expenditures up over 800 percent since 1960 (Boyle et
al., 1994). By 1992, more than 14 percent of the gross domestic product was
spent on health care (Byers et al., 1994). Various societal factors have
contributed to this rise in health care expenditures, including an aging
population, increased demand fostered bymore consumer awareness of health issues, an increased focus on preventitive medicine, and continuing
technological advances in medicine. The rising costs associated with the
health insurance process, the healthcare liability insurance for practioners,
innovative technologies, and administrative expenses have also contributed
substantially tothe overall increase in the cost ofhealthare (Boyle etal., 1994).
Efforts to combat rising health care costs have included the reduction of
length of hospital stays and increasing copayments and deductibles for
physician reimbursement mechanisms, theslowing ofhospital construction, and
restrictingthe access of new technology (Boyle etal., 1994).
While contending with rising costs, the health care industry is also
experiencing such paradigm shifts as increased government intervention and
an increased focus on customer satisfaction, high-quality care, continuous
quality improvement and advances in technology, and a work force which is
increasingly older, less literate, and culturally diverse (Byers etal., 1994).
Zemkecites thedilemma oftoomany hospital beds competing fortoofew
patients as the core of the ills penetrating the American health care system.
Increasingly, overcapacity threatens to undermine hospital profits as patient
volume declines and costs increase (Zemke et al., 1989). Major medical
service providers have undergone vast changes in this world of cost
containment and budget controls. Shrinking revenues have spurred tight
competition among health service providers and patients are increasingly seen
as customers (Wielawski, 1993). Hospitals are now understanding that patients
are people, people are actually markets, and market needs must be addressed
to remain in business. According to Zemke, hospital administrators must
increasingly devote their predominant efforts on ways to stay ahead of the
competition, with the focus on marketing strategies and segmentation.
Hospitals are becoming increasingly hotel-like, with many offering luxury suites
forupscale patients. The focusofpersonnel training is changing, and hospitals
are now routinely offering people-skills training programs. Hospitals are finding
various new ways ofcreating revenues from classes in fitness and weight
reduction to packaging and selling meals for individuals with special dietary
needs (Zemke etal., 1989 ).
Obstacles for Change
In this age of change and customer service focus, Eisenberg states that
the health care industrymustovercome four traditional barriers todeveloping a
service orientation. These are:
1. hospitals are extremely regulation governed;
2. they hold atraditional resistance toentrepreneurship;
3. they breed a culture ofpaternalism; and
4. the traditional medical model serves as a pretextfor interactions
between health care workers and customers. (Eisenberg, 1997).
Perhaps one of the most recent significant additional government
regulation facing the health care system of the United States has been the federally instituted plan calling for payment by Diagnostic Related Grouping
(DRG). Under this system, initiated in October of 1983, the government
reimburses the health care provider a flat rate based upon the statistically
estimated amount oftimeinvolved in a given procedure. The theory is that the time and care required for a medical procedure can be based on a statistical
norm, with reimbursement to the provider being based on that midpoint.
Hospitals therefore stand to lose revenue on treatments requiring time above
the norm, but obtain increased profits intreating patients who move through the
Meeting the Demands of Customers
Thetraditional service firms, dating from the industrial revolution through
the 1970's, built market shares on two main strategies. First, the focus was to
maximize tangible quality attributes of products in an effort to raise perceived
value in the eyes of the consumer. Secondly, firms attempted to increase
productivityand optimize standardization techniques in order tokeep prices low
(Vandermerwe etal., 1988).
The 1980's, however, were marked by significant changes in service
firms. Services were no longer individual components, but rather a part of a
total marketing package. As value is now associated with overall performance
of the whole system, today's market leaders must offer product-service
combinations (Vandermerwe etal., 1988).
There are various premises that differentiate the consumer of today
versus thetraditional customer. Thetraditional consumer associated value with
thetangible, whereas theconsumer oftodayvalues results over actual products
and services. Modern firms must also increasingly respond by offering solution
systems consisting of product-service components which contain increasingly
moreservices (Vandermerwe etal., 1988).
Belanger and Dube surveyed 102 hospitalized patients in a specialized,
acute-care, urban hospital in Canada toinvestigate thedimensions of
patients'
emotional experiences of hospitalization and to investigate the correlation
between emotional experiences to satisfaction with foodservice. They found
that patients'
perceived control over situations had a powerful influence of
patient emotions, with patients who felt in control of situations during
hospitalization expressing substantially more positive emotions. Overall
satisfaction with foodservice was based on both interpersonal and technical
dimensions. Of the two, the interpersonal aspects were scored as having
substantially greater significance to patients than technical attributes (Belanger etal., 1996).
Satisfying the Needs of Customers Through Technology
Zemke dubs the 1970's and 1980's as the "wonder years"
of technology. In these past two decades civilization has witnessed magnificent advances
such as lasers, fiber optics, satellite relays, cellular networks, voice
synthesization, microwave transmission, digital switching, and a vast array of others (Zemkeetal., 1989). Between 1970 and 1985, the share of total capital invested by service industries increased nearly two-and-a-half times. Of all
technologies, those associated with information handling have had the greatest
impact in recent years (Heskettetal., 1990).
While the last twenty years have been the "wonder years", Zemke
(Zemke et al., 1989). Competitive corporations will combine the technological
advances of the last twenty years with the service philosophies of the present
and the future.
Adopting new technologies in services is not without its challenges.
Because customers always participate indirectly, and often directly in
technologically advanced services, the success of the innovation depends
directly on customer acceptance (Fitzsimmons et al., 1994). Hessket (1990),
Sasser (1990), and Hart (1990) describe the introduction of new technologies
as much the same astransplanting a human organ from one body to another in
thattheorgan maybe perfectlyfunctioning, yetthe body may still reject it. Both
the customer (the body) and the service (the organ) must believe that there are
benefits in using the new technology (Heskett, 1990).
Martin identifies four basic needs of customers as:
1 . the need to feel important;
2. theneed tofeel welcome;
3. the need tobe understood; and
4. the need forcomfort (Martin, 1989).
Because customers participate directly in the service process, success
will depend on customer acceptance. Corporations must consider whether or
not there will be a loss of personal attention for customers and whether or not
consumers will be required to learn new skills. The implementation of
automatic teller machines did involve a loss of personal attention and some
basic new skills forcustomers. However, because ofthe perceived benefitsof
convenience, minimized customer waits, and overall time savings, this
automation is now widely utilized. Acceptance of technology also depends on
whether or not there will be a perceived loss of consumer benefits. Self-serve
gasoline pumping stations were initially perceived as deleting the benefit of
personal service, although are now widely accepted secondary to consumer
cost savings (Fitzsimmons etal., 1994).
At Federal Express, early tests of hand-held shipment tracking devices
nearly failed because couriers objected to thefactthattheywere being asked to
input information that was not previously required, hence slowing the pick-up
and delivery process. A change in the software was made to reduce the
number of questions which resulted in the positive aspects of the technology
outweighing the negatives for both couriers and customers (Heskett et al.,
1990).
Another challenge involved in the investment in technology involves the
thought thattechnology can be substitutedforpeople in an organization. While
this maybe partiallytrue, manyservice firms fail to realize their expectations by
investing too much in the technology itself and not enough on the training of
employees touse iteffectively.
According to Heskett, Sasser, and Hart (1990), technological advances
must enable the creation of services that are more responsive to consumers.
Sasser and Fulmer (1991) state that this is achieved through identification of
individual customer needs, individualized improvement and execution of
Additionally, technological advances must succeed in the improvement of
overall quality (Heskettetal., 1990).
Heskett, Sasser, and Hart (1990) elude toa "holytrinityof
technology" in
that materials, methods, and information are intertwined in the successful
implementation of technology. For example, the development of lightweight
metals made possible theconstruction of more efficient aircraftthatresulted in a
change in thetechnology of methods used inthe airport business.
The History of Technology in Foodservice
Inthe health care arena, diagnostic and treatmenttechnologies have had
a dramatic impact. Yet, because of the capital expenditures involved in such
technologies, the food and nutrition services departments of many hospitals
have been left out of the technology loop (Byers et al., 1994). Overall, health
care has been traditionallyslow to implement software technology, especially in
the area offood service (Byers etal., 1994).
Technological advances in the food arena have included biotechnology,
sous vide (wherein freshly prepared foods are processed with low temperature
cooking and vacuum-sealed in pouches), irradiation, and fat replacement. In
hospital food service departments, technological advances include software
systemstomanage information such asprocurement, inventory control,
of-sale information, and standardized recipes. Clinically, usage of software
programs for nutritional analysis and clinical applications is on the rise (Byers
etal., 1994).
While almost nonexistent 1 0 years ago, software for foodservice is now
abundant. As of 1995, more than 450 hardware and software vendors were
supplying products for the foodservice industry. The technology services
foodservice in areas such as accounting, catering, inventory control, menu
design, menu engineering, nutrition analysis, payroll, recipe costing,
scheduling, and table management (Sherer, 1995).
Recentadvances in technology have also attempted to address the vast
restricitions associated with the long standing method of conveying food
choices to hospital patients: the paper menu. In a traditional paper menu
selection system, menus are delievered to patients by nursing or foodservice
staff. After patients have been given an opportunity to make selections, the
menus are then picked up by staff and returned manually to the diet office
wherein foodservice staff edits selections to comply with dietary restrictions.
One of the most significant limitations to this system involves an overall lack of
efficiency. Menu duties, including editing of individual patient information,
folding, storage, delivery, pick-up, and, in may instances, the manual tallying of
food choices, all require a significant amount of personnel time and energy.
Menu forecasting has traditionally been subject toerrors that result in increases
costs and reduced overall patient satisfaction. Additional limitations of this
associated with paper and printing, accuracy problems, and the related costs
associated with the need for abundant personnel ("Better Selection," 1997),
(Jamison etal., 1996).
Addressing the Problems of Traditional Menu Delivery Systems
Some solutions to this problematic system have included to development
of non-selective menus for patients or limited menus which reduce the number
of modified diets. Printed menus have sometimes been replaced by verbal
presentatition of entree choices topatients byfoodservice staff.
Vassar Brothers Hospital in Poughkeepsie, New York answered their
menu problems by utilizing a preadmit selection system. Patients undergoing a
pre-scheduled procedure atthe hospital are given a food preference sheet to
complete atthe timeofpresurgical testing, generally four to seven days prior to
admission. The food preferences are entered into a computer in the hsoptial
kitchen and are automatically printed on menus once the patients arrive. This
system has resolved the hospital's previous two day average lag in filling food
requestsforthese types of patients (Davis etal., 1994).
The Presbyterian Hospital of Piano, Texasis a 150 bed acute care facility
which formerly utilized a traditional seven day cycle menu. The hospital found
that patients were often unable to select from the paper menus, which were
passed out to patients after admission, because they were either not admitted
long enough ortheywere not accessible to food service employees in order to
receive menus. Many patients had complained that they were being forced to
selectfoods toofar in advance oftheactual meal time(Schuster, 1995).
The hospital recently switched to a limited selection for patients, offering
fourteen hot and fourteen cold entrees. The new menu offers one hot and one cold entree atlunch and dinner and is presented orally to each patient byfood
service employees. The entire menu was made heart healthy to eliminate the
need formany special diets(Schuster, 1995).
The goals of implementing the system were to avoid escalation of costs
and to increase patient satisfaction. The hospital found that both goals were met beyond their expectations. The foodservice staff plans meal production
based on theforecastsof selections. Each patient is verbally offered a choice of entree and beverage, butthesame salad and dessertare placed on mosttrays.
This new system allows formore effectiveforecasting and less waste (Schuster,
1995).
Physicians are pleased to be writing fewer restricted diet orders as the
standard fare already encapsulates several traditionally restricted diets, and the
hospital believes that it is a morale boost forpatients to be told that, in spite of
their dietary restrictions, theyarefreetoorder anyofthefood items found on the
menu. Additionally, delivering tomenu orally to patients gives foodservice staff
the ability to respond to patients on an immediate basis. For patients who are not satisfied with any of the food choices on the menu, foodservice staff are empowered to accommodate requests from the hospital's cafeteria menu
Ohio State University Medical Center is a 600 bed acute care facility
which formerly offered six menus with three varying cycle lengths. The facility
recently devised a new system consisting of an eight day patient menu cycle.
The number of entrees available has been reduced from thirty-five to fifteen.
Patients areofferedtwo hotentree choices and one cold entree choice at lunch
and dinner and one entree at breakfast. As in the case of the Presbyterian
Hospital of Piano, many of the menu items can be served on a variety of
restricted diets. The new system has fulfilled the hospital's goals of cost
reduction and improvement ofpatient satisfaction (King, 1995).
The Columbia Health Care Association of Fort Lauderdale, Florida
wished to develop a paperless system and did so by offering a non-select
menu. The entree, starch, and vegetable are offered to patients as a package.
Patients are able to choose from a selection of beverages, condiments, and
cold items. As an alternative, there is an unpublished list of food items for
patients who cannot or will not eat the preselected meals. The hospital's
primarygoals in the development ofthe non-select system were reduced costs
offood and labor. Asthe patients expected tochoose foods from the hospital's
former traditional cycle menu were generally not admitted to the facility for a
long enough period to actually receive menus and make selections, the
non-select system actually deleted perceived ratherthan actual choice (King, 1995).
When The New York Hospital-Cornell Medical Center in New York City
opened a new inpatient facilityin 1997, thegoals were toreplace the kitchen
system while continuing towork with limited space, design a production system
geared to a new, upscale menu system. The hospital decided to utilize
technology in the area of production, using blast chilling and central tray
rethermalization. The hospital's menu goals were met by implementing a
restaurant-style menu in order to increase the daily variety of food choices
offeredto patients. Themenufeatures six entrees at lunch and eight at dinner.
Additionally, there are daily soup, sandwiches, bread, beverage, condiment,
and dessertchoices. The menu highlights the total caloric and fatcontent in all
foodsoffered. Low fat and low cholesterol choices are identified with symbols.
Approximately 3,000 inpatient meals are served per day.
Implementing Foodservice Technology
Computerization has attempted to address the problems of hospital
menu delivery and other foodservice data storage and retrieval with the
availably of a variety of new software (Jamison et al., 1996). A vast array of
software is currently being advertised through the internet. For example, the
Buckeye Technology software collection includes services for menu
taking/tallying, adjusting patient choices tosuitdiet requirements, and supplying
meals to patients unable to select from a menu (www.peg.apc.org).
Computrition offers systems for cost control, inventory and orders, recipe and
menu planning, and administrative duties (www.computrition.com). Geri Menu
offersa full range offood service management and nutritional analysis software
for healthcare institutions and other software such as that offered by ESHA
research is available for recipe, food analysis, and labeling (www.sfu.ca).
Other information regarding new foodservice software can be found in Byting In,
a newsletter about software forfoodservice and nutrition applications.
Byers refers to several steps in the consideration and implementation of
technology, specifically management information systems (MIS), in the
healthcare arena. These steps are contained in the System Development
Model described byGordon, Necco and Tsai and are described below:
Step 1; Investigatethe Current System
Whatproblems might MIS solve? Whatnew opportunities might MIS
provide? Whatnew software/hardware will be required? Will
computer's presence increase or reduce thedepartment's personnel
requirements? What data bases and operational procedures will need
tobe developed? Whatcosts are involved? Wherewill financial
resources come from? Ifused byclinical nutrition staff,who will absorb
the costs ofnutritional services?
Step 2: Analyze theSystem
What istheexisting system'sabilitytosatisfythe information needs of
managers?
Step 3: Design theSystem
Software: Source (towhatextent is management involved? )
Scope: range of application thatcan be performed bythesoftware
Function: specificjob thatcan be accomplished bysoftware
Selection: determine whattopurchase
Hardware: components, desireable characteristics, data bases,
telecommunications (will therebe a network linkage between the
healthcare operation?)
Personnel: Whowill manage and run the program?
Procedures
Step 4: Implementthe System
Preparation, installation, testing, and start-up
Step 5: Maintain the System
Step 6: Review the System
Review software, hardware, telecommunications, data-base, personnel,
Automated Systems in Progress
Jamison et.al. (1996) conducted a research project with the goal to reduce dietary department costs through labor reduction while continuing to
offer menu selections to patients by using two items common to nearly every hospital room: the patient telephone and television. Software was developed
utilizing Windows (version 3.11, 1993, Microsoft Corporation, Redmond, Wash) and built around an automated voice interface subsystem that answers the telephone, collects information, and prompts the user to follow instructions for the selection of menu items. Thesystem also involves diet office functions such
as the recording of patient admission, transfer, and discharge, the ordering of guest trays, and diet order changes. The system's interactive communication
multimedia network allows patients to select menu items while viewing a full-color display of the hospital menu on using the in-house video channel. Patientspress numbers onthe touch tone keypad ofthe bedside telephone that
correspond to food items displayed. A personal computer located in the diet
office records selections and provides a printed tray ticket of patient menu selections along with a daily tally for production purposes. The system was piloted at a Texas hospital with the expected benefits being reduction in labor
time, faster and more accurate meal service to patients, improved publice relations for the hospital, and improved patient satisfaction through personal
menu choices. Results of the patient survey which followed the trial of this
system indicated thatpatients had a significant preference for the computerized
system over theprinted menu system based on interest, convenience,
availability, satisfaction, and motivation. Patients did not, however, consider the
system substantially easiertouse than theprinted menu system (Jamison et al.,
1996).
Irving Healthcare in Irving, TX, struggled with the problems associated
with paper menus. Patients who did notfill outtheir menus received a standard
non-select menu, resulting in some patients receiving foods that they did not
enjoy. The hospital now utilizes computer software and has installed a terminal
atevery bedside for the entry of meal choices. This 234-bed hospital uses the
Nutrition Care Management (NCM) software system from Computrition, Inc. for
nutrition service personnel and other health professionals to receive patient
selections and input them into the computer, where they are automatically
corrected and tallied bythesoftware. The patient menus are pre-edited before
they appear on the computer screen, offering only those items allowed based
on the patient diet order. The hospital has found that patients have more
opportunityto select food choices, which has resulted in increased satisfaction
with meals. Additionally, the software offers more flexibility to change menus
instantly. Diet technicians no longer spend the previous 2.5 hours each
distributing and collecting paper menus, and now have more time for clinical
duties. The foodservice department was able to save 1/2 of a full time
equivalent (FTE) staff person with the addition of automation ("Irving
Healthcare", 1996).
The initial goals at Ingalls Memorial Hospital in Harvey, Illinois were to
standing menu system involved a traditional, paper menu which was collected
one day in advance of meal service. Although patient satisfaction surveys
revealed acceptable responses from patients, the foodservice department
strived for outstanding service. In 1995, a spoken menu system was
implemented throughout the entire 450-bed hospital. A non-selective menu is
verbally described to patients by hospital associates at 9:00 am for lunch, 2:00
pm for dinner, and in the evening for breakfast the next day. The items are
recited, and the patient either accepts the entire menu or is offered alternatives
for foodstheywill not accept. Hospital records reveal thatapproximately 80% of
patients accept all menu items. The hospital was able to restructure its staffing,
reducing overall FTE's(Jackson, 1995).
Chapter III.
METHODOLOGY
Application
Hospital foodservice directors composed the sample for this study. In
attempting to reduce confounding variables, the hospitals that were chosen
were classified in the AHA Guide to the Health Care Field (American Hospital
Association, 1996) as general rather than Veterans Administration and were
listed as having 300 or more inpatient beds.
Questionnaire Development
The questionnaire was composed of 20 questions and is shown in
Appendix I. Questions were predominantly closed-ended with both ordered
and unordered answer choices and also included some partially closed
questions as well as open ended questions. Questions were developed to be
easily understood and non-bias utilizing guidelines citedby Hayes (1992).
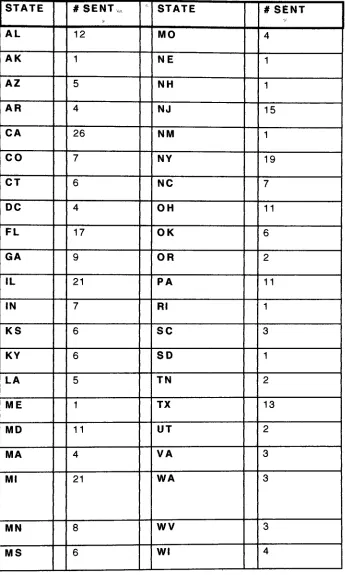
Data Collection
Cover letters and questionnaires (Appendices I and II)were sent to300
hospitals from 41 states and Washington, DC. The hospitals that were chosen
metthecharacteristics asdefined above and were chosen otherwise at random
with thegoal being toobtain data from as many states as possible. The 9 states
hospitals which met the criteria for the study defined above. Foodservice
directors were encouraged to complete the questionnaires within two weeks
and instructed to seal the completed questionnaires in the self-addressed
stamped envelopes provided. The disbursement of questionnaires by state is
illustrated in Table 1 on thefollowing page.
TABLE 1. DISTRIBUTION OF QUESTIONNAIRES BY STATE
STATE # SENT STATE #SENT
AL 12 MO 4
AK 1 NE 1
AZ 5 NH 1
AR 4 NJ 15
CA 26 NM 1
CO 7 NY 19
CT 6 NC 7
DC 4 OH 11
FL 17 OK 6
GA 9 OR 2
IL 21 PA 11
IN 7 Rl 1
KS 6 SC 3
KY 6 SD 1
LA 5 TN 2
ME 1 TX 13
MD 11 UT 2
MA 4 VA 3
Ml 21 WA 3
MN 8 WV 3
[image:42.526.81.426.38.613.2]Data Analysis Method
Programs and routines inthe Statistical Packagefor the Social Sciences
(SPSS-X, version 2.1, 1986, SPSS, Chicago, III) were used for all data
analyses. Frequencies were calculated forall variables. Means were
computed forall ratings. Factor scores were calculated by computing the mean
ofthe statementsthatcomposed thefactor. Reliabilityof all resultantfactor
scores was estimated using a coefficient variable.
CHAPTER IV
RESULTS AND DISCUSSION
One hundred and forty (47%) of the questionnaires distributed were
returned. Five questionnaires were not used in the data analysis: four
because they were returned incomplete and one because it arrived too late to
be included.
General Characteristics of Respondents
Foodservice directors were asked to provide general information
regarding their respective facilities to determine an average hospital
foodservice profile.
Inpatient Beds
Table 2 on thefollowing page illustratesto number of patient beds in the
facilities surveyed. 96% offacilities surveyed had lessthan 300 beds, while 4%
had over 300 beds. Two respondents added comments differentiating between
available beds and average number of utilized beds. The question did not
specify whether or not "average number of operating beds" was being
requested, though, based on respondent comments, was open to interpretation
TABLE 2: NUMBER OF PATIENT BEDS
# of Beds # of Respondents
less than 200 7 2
200-299 58
300-399 4
400-499 0
500-599 1
TOTAL 135
Meal Service
96.3% of respondents indicated that their facilities offered full service
breakfast, lunch, and dinner. The remaining 3.7% offered continental/buffet
style meals at one or moretime throughout theday.
Foodservice System
Table 3 on the following page illustrates the type of foodservice systems
in place at responding facilities. 80% of foodservice directors were affiliated
with a conventional foodservice system wherein food is plated hot and served
immediately. 17.7% of respondents were currently utilizing some type of quick
chill system wherein food is cooked ahead of time and plated later. Less than
1% predominantly use a microwave system, and 1.5% indicated that food is
prepared off-site.
TABLE 3: TYPE OF FOODSERVICE SYSTEM IN USE
Type of System Number of Respondents
Conventional (foodplatedhotand served 10 7
immediately)
Conventional Quick Chill (food cooked
andquicklychilledinbulk, reheated, plated,
andservedimmediately)
Computer Driven Central
Rethermalization(food quicklychilled and
reheated ontrays incentrallocation)
Computer Driven Decentralized
Rethermalization (food quicklychilled and
reheated ontraysinvariouslocations throughoutthefacility)
Microwave (foodplated cold andheatedvia
microwaveoven)
Food Predominantly Prepared by Another Party Off-Site
7
1 0
Other
TOTAL 135
Menu Styles
Table 4 on the following page illustrates the type of menu used at
responding facilities. The majority of respondents (73%) offer a select menu to
selections, and 5% offera restaurant style menu wherein the same choices are
available topatients each day.
TABLE 4: TYPE OF MENU UTILIZED
Type of Menu
Complete Non-Select
Modified Non-Select
Select
Restaurant Style
Other
TOTAL
# of Responses
17
10
99
7
2
135
Characteristics of Menu Display Systems
Table 5 on the following page outlines the methods which hospitals are
currently utilizing tocommunicate topatients.
TABLE 5. MENU DISPLAY SYSTEMS CURRENTLY IN USE
Menu Display
Method
Preferred
n
Alternate
n
Not Used
n
New in Last 5 Years
n=31
Paper Menu 104 9 22 1 j
Verbal, InPerson 32 47 56 21
Closed
Captioned TV 1 2 132 1
Verbal,
Telephone
3 29 103 4
[image:48.526.33.467.61.412.2]Directors were asked to rate each method as "preferred", "alternate", or
"not used"
as well as which systems the facility within the last five years. As
shown, paper menus are still widely utilized as the most common method for
communicating menu choices topatients.
Method of Obtaining Patient Menu Selections
Table 6 illustrates the individual responsible for obtaining menu
selections from thepatient. Asshown, 35% of patients self-select, while 47% of
facilities delegate the responsibility to dietary staff, 7% to unit staff, and 1% to
nursing staff. 10% of facilities offer a non-select menu system, and this
question was therefore non-applicable.
TABLE 6: METHOD OF OBTAINING PATIENT MENU
SELECTIONS
Individuals. Delegated to Number of Respondents
Obtain Menu Selections
Patient Self-Selects 4 7
Diet Staff 6 3
Unit Staff 1 0
Nursing Staff 2
Non-Select Menu System 1 3
TOTAL 135
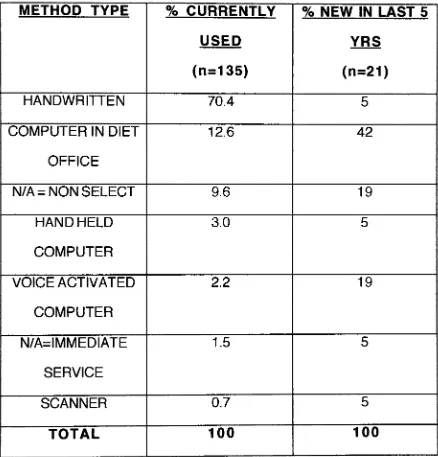
Table 7 outlines the methods for recording menu selections currently
being utilized as well as the type of selection systems which respondents
indicated were newto theirfacilities in the last fiveyears.
As shown, most selection recording systems have been in place longer
than 5 years (85%), and handwritten recording systems account for the vast
majority of systemscurrently in place. Ofthe automated systems, the diet office
TABLE 7. METHOD FOR RECORDING MENU CHOICES
METHOD TYPE % CURRENTLY % NEW IN LAST 5
USED YRS
(n=135)
(n=21)
HANDWRITTEN 70.4 5
COMPUTER IN DIET 12.6 42
OFFICE
N/A= NONSELECT 9.6 19
HANDHELD 3.0 5
COMPUTER
VOICE ACTIVATED 2.2 19
COMPUTER
N/A=IMMEDIATE 1.5 5
SERVICE
SCANNER 0.7 5
TOTAL 100 100
[image:51.526.30.468.122.579.2]Respondents were not asked to specify what brand or type ofdiet office
computer software was being used.
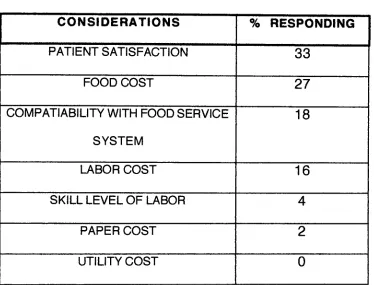
Respondents were provided with a list of factors and asked to identify
which were considered when making the decision to change the menu
selection system in place at their respective facilities. Table 8 on the following
TABLE 8. GOALS CONSIDERED IN CHANGING MENU
RECORDING SYSTEMS
CONSIDERATIONS % RESPONDING
PATIENT SATISFACTION 33
FOODCOST 27
COMPARABILITYWITH FOOD SERVICE
SYSTEM
18
LABOR COST 16
SKILL LEVELOF LABOR 4
PAPER COST ! 2
UTILITYCOST 0
[image:53.526.30.404.133.418.2]When asked if the goals listed in Table 8 were met with change, 86% of
respondents indicated the affirmative, and 14% stated that the goals were not
met. The respondents were then asked whether data was available to support
this response. Fifty-nine percent indicated that they had available data in
supportofthese contentions, while 41% statedthatthedatawas not available.
Satisfaction with Menu Selection System
Table 9 on the following page illustrates directors' degree of satisfaction
with menu selection recording systems currently in use. Directors were asked
to rate their satisfaction level as either "extremely satisfied", "somewhat
satisfied", "neither satisfied nor dissatisfied", "somewhat dissatisfied", or
"extremely dissatisfied". Asshown, the majority of respondents were somewhat
satisfied with their current menu system regardless of the type of system in
N 00CD <. co . -CM -ID CM CM -a- i-1- II c
o o o o O o CM
t-"" < Q Z UJ s_: UJ </) St= CO m CO Q co CM CM co n c o co ^i 0DCO r: n c
o O o COCM
ii o co V\ o OO n O o CM
<" 5 uj Ul u. <0 Oi= co < CO cn co co II c co ^1 co CD t-1^- II c
CD ,!i LD !. o P O II i-c cn LD
i*
\
<_ x t-Ul< CO in un ii c o ^ro coY\ c
oo c
'if o
The mean score was 2.644, indicating that the average foodservice
supervisor feels somewhere between somewhat satisfied and ambivalent with
his or her current menu selection entry systems. The median and mode of 2
demonstrate that"somewhat satisfied"
was the most commonly chosen answer.
As illustrated, most foodservice directors were somewhat satisfied with their
current systems regardless of what type of system was in place, computerized
or otherwise.
Respondents were asked whether or not they would consider an
automated menu system in the future, and Table 10 on the following page
illustrates responses based on respondent satisfaction with current menu
choice recording system. Asshown, mostfoodservice directors would consider
automation in thefuture, even though thevastmajority had manual systemsand
were currently atleast somewhat satisfied withthese systems.
Automation does not follow with a positive level of satisfaction in all
cases. Of note, 1 of the 3 facilities utilizing voice activated computers
responded to satisfaction level as "somewhat dissatisfied". 18% of those with
computerized diet offices were somewhat dissatisfied as well, while just 6%
TABLE 10. DECISION TO CONSIDER FUTURE
AUTOMATION IN MENU CHOICE ENTRY SYSTEMS BASED
ON SATISFACTION WITH CURRENT SYSTEM
SATISFACTION W/ WOULD
CONSIDER
WOULD NOT
CONSIDER CURRENT
SYSTEM FUTURE FUTURE
AUTOMATION AUTOMATION
EXTREMELY 7 2
SATISFIED
SOMEWHAT 56 3
SATISFIED
NEITHER SATISFIED 10 1
NOR DISSATISFIED
SOMEWHAT 32 0
DISSATISFIED
EXTREMELY 11 1
DISSATISFIED
n= 116 7
[image:57.526.29.470.211.667.2]The questionnaire concluded by asking respondents whether or not they
would consider automated menu systemsand asked forcomments as to why or
why not. Table 1 1 on the following page displays the grouped responses to
TABLE 11. FACTORS CONSIDERED IN DECIDING WHETHER OR NOT TO
IMPLEMENT AN AUTOMATED MENU CHOICE ENTRY SYSTEM
FACTORS CONSIDERED (%) n =
YES,ALREADY PLANNING IT 24 21
YES,FOR PATIENT SATISFACTION 21 18
YES,FOR INCREASED EFFICIENCY 15 13
YES,FOR MORE "JUST INTIME"
ALTERNATIVE !
1 1
YES, FOR INCREASED
FORECASTINGOPTIONS
2 2
YES, FOR COSTSAVINGS 9 8
YES, FOR LABORREDUCTION 7 6
YES, FOREASE IN MENU CHANGES 1 1
YES, FORIMPROVED ACCURACY 2 2
YES,FOR WASTEREDUCTION 1 1
NO, HAPPY WFTH CURRENT SYSTEM 5 4
NO,TRIED PREVIOUSLY AND FAILED 1 1
NO,COSTTOO HIGH 1 1
NO, WILLNOTAUTOMATE FURTHER 1 1
NO,QUESTIONPATIENTS'FAMILIARITY
WITH AUTOMATION
4 3
MIGHT,SHOWME 5 4
As shown, the majority of foodservice directors would consider
automation and are in fact already in the planning stages. Patient satisfaction
prevailed asthe mostcommonlycited reason for choosing an automated menu
system. Cost savings and labor reduction were cited as the second and third
CHAPTER V.
SUMMARY, CONCLUSIONS, AND RECOMMENDATIONS
SUMMARY
While both cost savings and patient satisfaction are important
considerations in the decision to invest in computerization in the hospital
foodservice setting, customer service appears to be the prevailing focus of
today's foodservice director.
Computerization is evolving extremely rapidly in today's society. The
focus of this study was to determine at what rate hospital foodservice
departments are embracing food and menu management technologies, the
project sought to answer this question by investigating automation trends in
hospital kitchens nationwide. The researcher surveyed large hospitals utitizHTg
a written questionnaire.
CONCLUSIONS
The researcher hypothesized that the study would reveal that, although
automated menu system technologies are becoming increasingly available,
they are not currently widely utilized. A review of the statistical data clearly
reveals this hypothesis to be true. Specifically, 77% of surveyed foodservice
directors are still displaying menu choices via paper menus and 50% of
facilities are utilizing handwritten means to record patient menu selections.
Most (74%) of current menu management systems have been in place for
greater than 5years. Automation is not always an indication ofsatisfaction.
The majority of foodservice directors are at least somewhat satisfied with their
currentsystems, regardless of whether or notthese systems were automated.
RECOMMENDATIONS
Itis recommended that the study be repeated, with the results compared
BIBLIOGRAPHY
Albrecht, K. (1992). The Only ThingThat Matters: Bringing the Power
ofthe Customer intotheCenter of Your Business. New York, NY: Harper
Business.
American Hospital Association (1996). AHA Guide to the Health Care Field. Chicago. IL: American Hospital Association.
Belanger, M. O, Dube, L. (1996). Theemotional experience of
hospitalization: its moderators and its role in patient satisfaction with
foodservices. Journal of the American DieteticAssociation. 96. (4), 354-360.
Better selection retrieval in the palm of your hand. (1997). Food
Management. 32. (11V 25.
Boyle, A., Morris, H. (1994). Community Nutrition in Action: An
Entrepreneurial Approach. Minneapolis, MN: West Publishing.
Byers, B. A., Shanklin, C. W., Hoover, L C. (1994). Food Service Manual for Health Care Institutions. Chicago, IL. American Hospital Publishing.
Davis, S. L, Adams-Greenly, M. (1994). Integrating patient satisfaction with a quality improvement program. Journal of Nursing Administration. 24. (12), 28-31.
Eisenberg, B. (1997). Customerservice in health care: a new era.
Hospital and Health Services Administration: QuarterlyJournal of the American
College of Health Administrators. 42. (1.. 17-31.
Fitzsimmons, J. A., Fitzsimmons, M. J. (1994). Service Management for
Competitive Advantage. New York, NY: McGraw-Hill.
Heskett, J. L, Sasser,W. E., Hart, C. W. C. (1990). Service
Breakthroughs: Changing the Rules of the Game. New York, NY: Macmillan.
Hayes, R. E. (1992). Measuring Customer Satisfaction: Development
and Use of Questionnaires.
Irving healthcare puts aterminal at everybedside. (1996). Healthcare Foodservice. (6). (3.. 7
Jackson, R. (1995). Thespoken menu
-should youtryit? Hospital Food
and Nutrition Focus. 12. (2), 1-6.