RESEARCH
Differential urinary glycoproteome
analysis of type 2 diabetic nephropathy using
2D-LC–MS/MS and iTRAQ quantification
Zhengguang Guo
1†, Xuejiao Liu
2†, Menglin Li
3, Chen Shao
4, Jianling Tao
2, Wei Sun
1*and Mingxi Li
2*Abstract
Background: Diabetic nephropathy (DN) is the leading cause of chronic kidney failure and end-stage kidney disease. More accurate and non-invasive test for the diagnosis and monitoring the progression of DN is urgently needed for the better care of such patients.
Methods: In this study we utilized urinary glycoproteome to discover the differential proteins during the course of type 2 DN. The urinary glycoproteins from normal controls, normalbuminuira, microalbuminura, and macroalbuminu-ria patients were enriched by concanavalin A (ConA) and analyzed by 2DLC/MS/MS and isobaric tags for relative and absolute quantitation quantification.
Results: A total of 478 proteins were identified and 408 were annotated as N-linked glycoproteins. A total of 72, 107 and 123 differential proteins were identified in normalbuminuria, microalbuminuria and macroalbuminuria, respec-tively. By bioinformatics analysis, in normalbuminruia state, cell proliferation and cell movement were activated, which might reflect the compensatory phase during the disease development. In micro- and macro-albuminuria, cell death and apoptosis was activated, which might reflect the de-compensatory phase. Pathway analysis showed acute phase proteins, the member of high density lipoprotein and low density lipoprotein proteins were changed, indicating the role of the inflammatory response and lipid metabolism abnormality in the pathogenesis of DN. Six selected differen-tial proteins were validated by Western Blot. Alpha-1-antitrypsin (SERPINA1) and Ceruloplasmin are the two markers with excellent area under curve values (0.929 and 1.000 respectively) to distinguish the microalbuminuria and normal-buminuria. For the first time, we found pro-epidermal growth factor and prolactin-inducible protein were decreased in macroalbuminuria stage, which might reflect the inhibition of cell viability and the activation of cell death in kidney. Conclusions: Above data indicated that urinary glycoproteome could be useful to distinguish the differences in protein profiles in different stages in DN, which will help better individualized care of patients in DN.
Keywords: Diabetic nephropathy, Glycoproteomics, Biomarker
© 2015 Guo et al. This article is distributed under the terms of the Creative Commons Attribution 4.0 International License (http://creativecommons.org/licenses/by/4.0/), which permits unrestricted use, distribution, and reproduction in any medium, provided you give appropriate credit to the original author(s) and the source, provide a link to the Creative Commons license, and indicate if changes were made. The Creative Commons Public Domain Dedication waiver (http://creativecommons.org/ publicdomain/zero/1.0/) applies to the data made available in this article, unless otherwise stated.
Background
As a major microangiopathy complication of diabetes mellitus (DM), diabetic nephropathy (DN) is the leading
cause of chronic kidney failure and end-stage kidney dis-ease (ESRD). 36.9 % of all ESRD patients in United States are due to diabetic nephropathy. According to the clas-sification of American Diabetes Association [1], DN is divided into three stages, incipient nephropathy (micro-albuminuria), clinical diabetic nephropathy (macroalbu-minuria) and ESRD. To diagnose those DN patients in its early stage can effectively prevent or delay the pro-gression to ESRD [2]. Renal biopsy is a useful way to definitive diagnosis. However, renal biopsy is an inva-sive method which has clinical risks, including masinva-sive
Open Access
*Correspondence: [email protected]; [email protected]
†Zhengguang Guo and Xuejiao Liu have contributed equally to this work 1 Core Facility of Instrument, Institute of Basic Medical Sciences, Chinese
Academy of Medical Sciences, School of Basic Medicine, Peking Union Medical College, 5 Dong Dan San Tiao, Beijing 100005, China
2 Department of Nephrology, Peking Union Medical College Hospital,
Peking Union Medical College, Chinese Academy of Medical Sciences, No. 1 Shuaifuyan, Wangfujing Street, Beijing, China
bleeding, pain, infection and arteriovenous fistula [3]. Also, some patients have such bleeding disorder and some other comorbidity as contraindications for renal biopsy [4]. A simple, accurate and non-invasive test was urgently needed for early diagnosis of DN and/or moni-toring its progression [5]. Currently, the presence of microalbuminuria is widely accepted as the sign of onset of DN [6]. However, patients with cardiovascular disease [7, 8], hypertension, and inflammation [2] can also pre-sent microalbuminuria. Meanwhile, many patients who already have advanced renal histopathological changes are normoalbuminura [9–11]. As many as 55–70 % microalbuminuria patients do not progress to proteinuria within 10 years, while ~40 % of those who are ultimately at risk of progression to proteinuria are constantly nor-moalbuminura [6]. This calls for more accurate biomark-ers in clinical research and its application.
The urinary proteome can reflect the changes of uri-nary system, thus urine is a suitable source for biomarker discovery for kidney diseases. As early as 2005, Kumar et al. [12] used two-dimension differential in-gel elec-trophoresis (2D-DIGE) method to discover biomarkers of DN in urine, identified and validated alpha-1-antit-rypsinin DN patients. Until now, many publications have reported the differential proteins in the urine of DN using various proteomic methods [5, 13–31] and a total of more than 200 differential proteins have been found, and some differential proteins had been validated using immunological methods or target proteomic method [14, 16, 18, 19, 28–31]. Above results indicated that uri-nary proteome might be used to discover DN biomark-ers. However, due to the high abundance suppression by albumin in DN urinary proteome, it was difficult to iden-tify the low abundance proteins.
Glycoproteins are involved in many important bio-logical functions, such as cell attachment, regulation of development, immune response, signal transduction, protein folding and hemostasis [32]. More than half of all proteins are thought to be glycoproteins, and the quality and quantity of glycoproteins will change along with the physiological and pathological processes [33]. Because urinary glycoproteome might reflect the functions of kidney and urinary tracts [33], it had been successfully used to discover the biomarkers for bladder cancer [34], chronic kidney disease (CKD) [35]. It was also used to distinguish Adriamycin nephropathy from Thy1.1 glo-merulonephritis [36]. Therefore, urinary glycoproteome should become another useful approach for biomarker discovery of DN.
In this study, urinary glycoproteome was used to discover the biomarkers in early stage and its progres-sion monitor of DN. The urinary proteins from nor-mal controls, nornor-malbuminuria, microalbuminura, and
macroalbuminuria were collected respectively. The uri-nary N-linked glycoproteins were enriched by conca-navalin A (ConA), then labeled by 4-plex isobaric tags for relative and absolute quantitation (iTRAQ) regents, and analyzed by 2D-LC MS/MS. The differential pro-teins were functionally annotated by Ingenuity Path-way Analysis (IPA). Furthermore, selected differential proteins were validated in individual samples by West-ern blot (Fig. 1) and the sensitivity and specificity were evaluated.
Methods
Reagents and instruments
ConA agarose, HPLC grade acetonitrile (ACN) and formic acid, trifluoroacetic acid, ammonium bicarbo-nate, iodoacetamide (IAA), and dithiothreitol (DTT) were purchased from Sigma (St. Louis, MO, USA). Sequencing grade trypsin was purchased from Promega (Madison, WI, USA). The 4-plex iTRAQ regents were purchased from ABsciex (Framingham, MA, USA). A TripleTOF 5600 mass spectrometer from ABsciex and an HPLC system from Waters (Milford, MA, USA) were used.
For western blot, the primary antibodies for Alpha-1-antitrypsin (SERRINA1) (SERRINA1, ab9400), Ceru-loplasmin (CP, ab51083), Transthyretin (TTR, ab9015), Apolipoprotein A-IV (APOA4, ab81616), Pro-epidermal growth factor (EGF, ab9695) and Prolactin-inducible pro-tein (GCDFP15, ab62363) were purchased from Abcam (Cambridge, UK).
Patients
Urinary protein extraction
All the morning urinary samples from four groups were centrifuged at 5000g for 30 min, and the precipitates were removed. The supernatants were precipitated by 3 times volume ethanol for overnight at −4 °C. After 10,000g centrifugation for 30 min, the pellets were re-suspended in lysis buffer (7 M urea, 2 M thiourea, 0.1 M DTE, 50 mM Tris). The protein concentration of each sample was measured by Bradford method, and equal amount of total protein from each patients within each group were pooled together.
N‑linked glycoprotein enrichment
Each pooled sample was concentrated to above 6 mg/mL by vacuum centrifugal concentrator. After 1:1 dilution with buffer A (150 mM NaCl, 1 mM CaCl2, 1 mM MgCl2 and20 mM Tris, pH 7.4), each solution was incubated with ConA agarose overnight at 4 °C with rotation. After incubation, ConA beads were washed twice with buffer A and ConA-enriched urinary proteins were eluted by incu-bating the beads with 500 mM α-Me-d-Man in buffer A.
Protein digestion and iTRAQ labeling
Each sample was digested using filter-aided sample prep-aration (FASP) method described in Wisniewsk et al.
Fig. 1 Work flow of differential urinary glycoproteome analysis
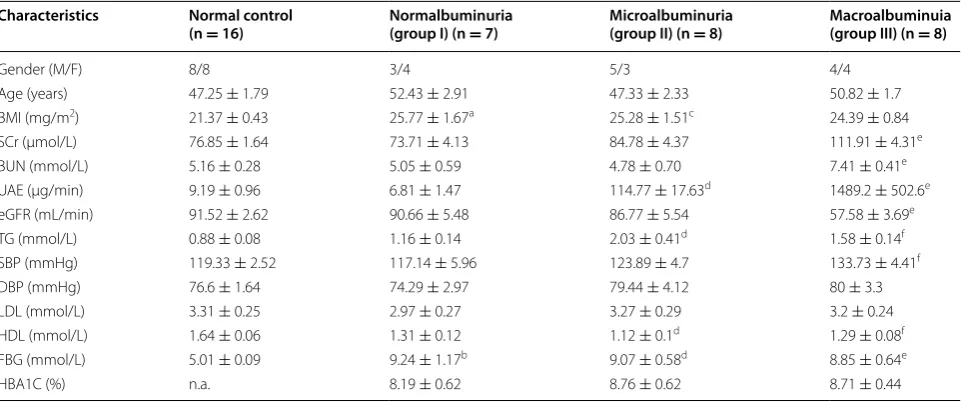
Table 1 Clinical characteristic of normal control, normalbuminuria, microalbuminuria and macroalbuminuria patients
SCr serum creatinine, BUN blood urea nitrogen, UAE urine albumin, eGFR estimated glomerular filtration rate, TG triglyceride, SBP systolic blood pressure, DBP diastolic blood pressure, LDL low-density lipoprotein, HDL high-density lipoprotein, FBG fasting blood glucose, HBA1C glycatedhaemoglobin
aP < 0.05 between for normalbuminuria versus normal control
bP < 0.001 for normalbuminuria versus normal control
c P < 0.05 for microalbuminuria versus normal control
dP < 0.001 for microalbuminuria versus normal control
eP < 0.001 for macroalbuminuria versus normal control
fP < 0.05 for macroalbuminuria versus normal control
Characteristics Normal control
(n = 16) Normalbuminuria (group I) (n = 7) Microalbuminuria (group II) (n = 8) Macroalbuminuia (group III) (n = 8)
Gender (M/F) 8/8 3/4 5/3 4/4
Age (years) 47.25 ± 1.79 52.43 ± 2.91 47.33 ± 2.33 50.82 ± 1.7 BMI (mg/m2) 21.37 ± 0.43 25.77 ± 1.67a 25.28 ± 1.51c 24.39 ± 0.84
SCr (μmol/L) 76.85 ± 1.64 73.71 ± 4.13 84.78 ± 4.37 111.91 ± 4.31e
BUN (mmol/L) 5.16 ± 0.28 5.05 ± 0.59 4.78 ± 0.70 7.41 ± 0.41e
UAE (μg/min) 9.19 ± 0.96 6.81 ± 1.47 114.77 ± 17.63d 1489.2 ± 502.6e
eGFR (mL/min) 91.52 ± 2.62 90.66 ± 5.48 86.77 ± 5.54 57.58 ± 3.69e
TG (mmol/L) 0.88 ± 0.08 1.16 ± 0.14 2.03 ± 0.41d 1.58 ± 0.14f
SBP (mmHg) 119.33 ± 2.52 117.14 ± 5.96 123.89 ± 4.7 133.73 ± 4.41f
DBP (mmHg) 76.6 ± 1.64 74.29 ± 2.97 79.44 ± 4.12 80 ± 3.3
LDL (mmol/L) 3.31 ± 0.25 2.97 ± 0.27 3.27 ± 0.29 3.2 ± 0.24 HDL (mmol/L) 1.64 ± 0.06 1.31 ± 0.12 1.12 ± 0.1d 1.29 ± 0.08f
FBG (mmol/L) 5.01 ± 0.09 9.24 ± 1.17b 9.07 ± 0.58d 8.85 ± 0.64e
[image:3.595.55.292.88.373.2] [image:3.595.58.539.428.629.2][37]. The proteins were reduced by 20 mM DTT at 37 °C for 1 h and were carboxyamidomethylated by 50 mM IAA at room temperature in dark for 45 min. Then, the samples were loaded onto 10 kDa ultrafilter tube (Pall, Port Washington, NY, USA), and were washed twice by 8 M urea. Next, the protein samples were further washed twice by 25 mM NH4HCO3. Lastly, trypsin resolved in 25 mM NH4HCO3 were added in protein samples, and digested the protein samples at 37 °C overnight. The digested peptides were collected as a filtrate. The nor-mal and DN samples were individually labeled with 114, 115, 116 and 117 4-plexiTRAQ regents. Labeling was performed according to the manufacturer’s protocol (ABsciex). Finally the pooled samples were analyzed by 2DLC/MS/MS.
Offline HPLC separation
The pooled mixture of iTRAQ labeled samples was frac-tionated using a high-pH RPLC column from Waters (4.6 mm × 250 mm, Xbridge C18, 3 μm). The sam-ples were loaded onto the column in buffer A1 (H2O, pH = 10). The elution gradient was 5–25 % buffer B1 (90 % ACN, pH = 10; flow rate = 1 mL/min) for 60 min. The eluted peptides were collected at one fraction per minute. The dried 60 fractions were re-suspended by 0.1 % formic acid and pooled into 20 samples by combin-ing fractions 1, 21, 41; 2, 22, 42; and so on. A total of 20 fractions from urinary peptide mixtures were analyzed by LC–MS/MS.
Online LC/MS/MS analysis
Each fraction was analyzed with a reverse-phase-C18 self-packed capillary LC column (75 μm × 100 mm). The eluted gradient was 5–30 % buffer B2 (0.1 % formic acid, 99.9 % ACN; flow rate = 0.3 μL/min) for 40 min. A TripleTOF 5600 mass spectrometer was used to analyze eluted peptides from LC. The MS data were acquired using high-sensitivity mode with following parameters: 30 data-dependent MS/MS scans per full scan, full scans acquired at a resolution of 40,000 and MS/MS scans at a resolution of 20,000, rolling collision energy, charge state screening (including precursors with +2 to +4 charge state), dynamic exclusion (exclusion duration 15 s), MS/MS scan range of 100–1800 m/z, and scan time of 100 ms.
Data processing
For database searching, All MS/MS samples were ana-lyzed using Mascot (Matrix Science, London, UK; version 2.3.02). Mascot was set up to search the SwissProt human database (20,227 entries) assuming the digestion enzyme Trypsin. The parent and fragment ion mass tolerance was 0.050 Da. Carbamidomethyl of cysteine was specified as a
fixed modification, and 2 mis-cleavage sites were allowed. Scaffold (version Scaffold_4.3.3, Proteome Software Inc., Portland, OR) was used to validate MS/MS based peptide and protein identifications. Protein identification was accepted at false discovery rate (FDR) less than 1.0 % on protein level and with at least 2 unique peptides. Proteins that contained similar peptides and could not be differ-entiated based on MS/MS analysis alone were grouped to satisfy the principles of parsimony. Scaffold Q+ was used to quantitate Label Based Quantification (iTRAQ, TMT, SILAC, etc.) peptide and protein identifications. Acquired intensities in the experiment were globally malized across all runs. The reference channels were nor-malized to produce a 1:1 fold change. All normalization calculations were performed using medians to multipli-catively normalize data.
GO and IPA analysis
All differential proteins identified were assigned a gene symbol using the Panther database ( http://www.pant-herdb.org/) comparing to the whole human urine pro-teome [38]. Protein classification was performed based on functional annotations using Gene Ontology (GO) for biological processes, molecular function and cellular component categories.
For IPA analysis, the SwissProt accession numbers were uploaded to IPA software (Ingenuity Systems, Moun-tain View, CA). This software categorizes gene products based on the location of the protein within cellular com-partments and suggests possible biochemical, biological and molecular functions. The proteins were mapped to disease and function categories and canonical pathways available in the Ingenuity and other databases and ranked by z-score and P value respectively.
Western blotting analysis
Results
Qualitative and quantitative analysis of urinary glycoproteome
Three group diabetic patients were included in this study, normoalbuminuria group, microalbuminuria group and macroalbuminuria group. The UAER increased gradu-ally in microalbuminuria group and macroalbuminuria group; Scr and BUN increased while eGFR decreased significantly only in the macroalbuminuria group. These indicated that the renal damage aggravated increasingly in the three groups. There was no statically difference in other indexes among four groups.
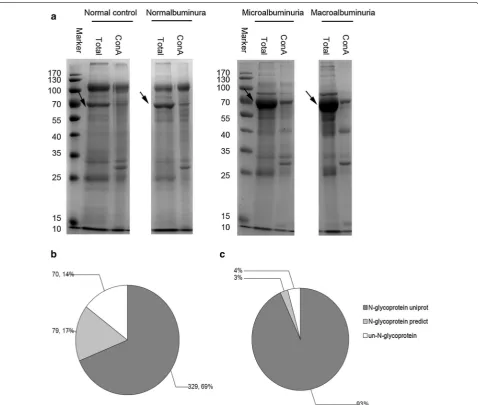
N-linked glycoproteins from normal control, normal-buminura group, microalbuminuria group and macroal-buminura group were enriched by ConA lectin. Total urinary proteins and ConA enriched urinary glycopro-teins were shown in Fig. 2a. Normal control and normal-buminuria had similar patterns, but the abundance of albumin increased in both microalbuminuira and mac-roalbuminuria group. After ConA enrichment, albumin band was dramatically decreased and some bands in other molecular weights (especially in 30KD) appeared in all the four groups.
By 2D-LC MS/MS analysis of ConA enriched samples, total 15,930 spectra and 2600 peptides from 478 pro-teins were identified (Additional file 2). By bioinformatic analysis, 329 proteins were annotated as N-linked glyco-proteins in Swissprot database, and by NetNGlyc predic-tion [39] other 79 proteins were annotated as potential N-linked glycoproteins. Therefore, a total of 408 (83.6 %) ConA enriched proteins were N-linked glycoproteins (Fig. 2b). Intensity-based absolute quantification (iBAQ) could estimate the protein abundance in sample [40]. By iBAQ analysis, N-linked glycoproteins contributed 96 % abundance of total abundance (Fig. 2c, Additional file 2). The qualitative and quantitative analyses indicated the high efficiency of N-linked glycoprotein enrichment by ConA.
A total of 472 proteins could be quantified in all four groups (Additional file 3). By a ratio-fold change >2, (Table 2), 72, 107 and 123 differential proteins were found in normalbuminuria, microalbuminuria and mac-roalbuminuria (Additional file 4).
Hierarchical clustering of differential proteins
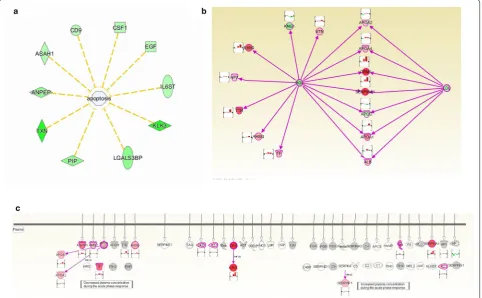
To get more information of differentially proteins dur-ing the course of DN, Hierarchical Clusterdur-ing was per-formed by average linkage method. All the differential proteins were hierarchically clustered into nine clusters (Fig. 3a, detailed data in Additional file 4). In Cluster 2, proteins were overrepresented in both microalbuminuria and macroalbuminuria (Fig. 3b). These proteins might be leaked from the serum by glomerulus or secreted from
the damaged kidney, and reflect the damage of the kidney during the course of DN. In Cluster 4, proteins were over-represented in all the three stages, which might reflect the pathological change of diabetes. In Cluster 7, pro-teins were underrepresented in both microalbuminuria and macroalbuminuria. These proteins might come from the health kidney and were down-regulated during the pathological processes of the DN. In Cluster 8 (Fig. 3c), proteins were down-regulated in microalbuminuria but up-regulated in macroalbuminuria. These proteins might reflect the early kidney impairment in microalbuminuria, but be enhanced by leaking from the serum in macroal-buminuria. Because the microalbuminuria was critical for early diagnosis of DN, the proteins in Cluster 2 and 8 may potentially be useful as novel biomarkers for early detection of DN [16].
Functional analysis of differential proteins
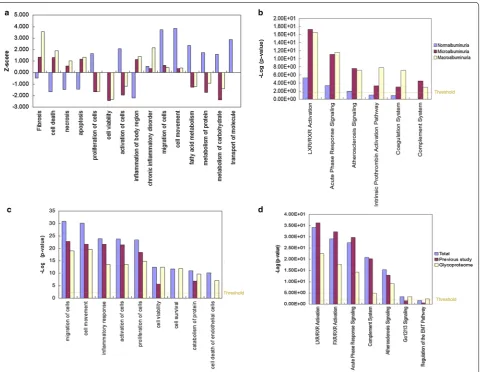
The differential proteins were first analyzed by GO. The PANTHER classification system [41] was used to search the enrichment GO terms [38]. Differential proteins were classified into molecular function, biological process, and protein class categories. In the molecular function cate-gory, receptor activity and enzyme regulator activity were overrepresented, whereas structure molecular activ-ity was underrepresented in DN (Fig. 4a). In biological process category, the terms of response to stimulus and immune system response were overrepresented, whereas the cellular component organization was underrepre-sented in DN (Fig. 4b). In cellular component category, extracellular protein was overrepresented, whereas intra-cellular protein was underrepresented in all the three stages (Fig. 4c). These results suggested that inflamma-tion and immune system response were related to DN.
Activation of cell death and the inhibition of cell sur-vival in urinary proteome were related to the cell death of renal cells in DN. Especially, in macroalbuminuria, inflammatory function and fibrosis were also activated, which reflected the inflammatory reaction and the kidney
fibrosis process in the stage of macroalbuminuria. These reflect their reversible pathological change in this stage of DN (Fig. 6a).
To further detect the detail molecular mechanism of the metabolism abnormal and the inflammatory reaction in DN, pathway analysis was performed. LXR/RXR acti-vation pathway, Acute Phase Response Signaling (APRS) pathway, and complementary pathway was remarkably enriched during the course of DN (Fig. 6b). 6, 16 and 16 differential proteins in normalbuminuria, microalbumi-nuria and macroalbumimicroalbumi-nuria were involved in LXR/RXR activation pathway. Many of them were mainly members of LDL and HDL, such as APOA4, SERPINA1 and TTR, indicating the abnormal of lipid metabolism increased
Fig. 2 Qualitative and quantitative analysis of urinary glycoproteome. a SDS-PAGE analysis of glycoproteins enriched by ConA from different groups. Total total proteins, ConA ConA enriched N-linked glycoprotein. The arrows indicate albumin protein. Distribution of ConA enriched protein by quality (b) and quantity estimated by iBAQ (c)
Table 2 Number of up-regulated proteins and down-regu-lated proteins in different stage of DN analyzed by LC–MS/ MS
Stage Normalbumi‑
nuria Microalbumi‑nuria Macroalbumi‑nuria
Up-regulation 34 62 74
[image:6.595.59.538.88.493.2] [image:6.595.56.291.588.643.2]during the course DN (Fig. 5b). Acute-phase proteins are a class of proteins whose plasma concentrations increase (positive acute-phase proteins) or decrease (negative acute-phase proteins) in response to inflammation. 5, 13 and 14 differential proteins in normalbuminuria, microalbuminuria and macroalbuminuria were involved in APRS (Fig. 5c). In microalbuminuria and macroal-buminuria, the downstream proteins of the APRS were up-regulated in urine, such as SERPINA1, CP and TTR. Elevated acute-phase proteins may reflect the inflamma-tion and activainflamma-tion of innate immune system during the course of DN [43].
Western blot validation
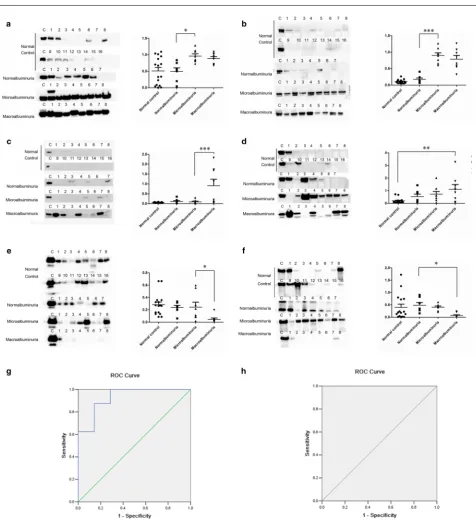
By biological function and pathway analysis, six differ-ential proteins, including SERPINA1, CP, TTR, APOA 4, EGF and GCDFP15 which involved in Acute Phase Response Signaling, cell death and apoptosis, or lipid metabolism were selected for Western Blot validation. As shown in Table 3, all six proteins had the similar trend to iTRAQ analysis by Western Blot. SERPINA1 (Fig. 7a) and CP (Fig. 7b) were significantly overrepresented in microalbuminuric and macroalbuminuric samples, com-paring to normal control and normalbuminuric sam-ples. TTR (Fig. 7c) was dramatically overrepresented in
[image:8.595.60.540.87.478.2]macroalbuminuric samples compared to the other three groups by more than tenfold. APOA4 (Fig. 7d) overrep-resented progressively during DN process, and the differ-ence between macroalbuminuric and normal control was significant. On the contrary, EGF (Fig. 7e) and GCDFP15 (Fig. 7f) were dramatically underrepresented in macroal-buminuric samples compared to other three groups.
Microalbuminuria stage is a very important stage for early diagnosis of DN. To evaluate the diagnosis effects of SERPINA1 and CP, which were significantly over-represented in microalbuminuria, the ROC curves were plotted. Figure 7g, h showed ROC curves with high sen-sitivity and specificity to distinguish microalbuminu-ria and normalbuminumicroalbuminu-ria. In ROC curve, Both CP and SERPINA1 had a good area under the curve value (AUC) (1.000 and 0.929, resp.). Because CP has an excellent AUC in our study, we further estimated the absolute con-centrations of cut-off values for application. Narita et al. [44] measured the Ceruloplasmin excretion rate (ng/ min) in normalbuminuirc patients and it ranged from 5.9 to 130 ng/min. Because in our study, all the CP levels of microalbuminuria patients higher than normalbuniuic, thus we suppose the cut-off values should be higher than
130 ng/min. But the accurate concentration range of CP in patients still need further work in large-scale clinical samples.
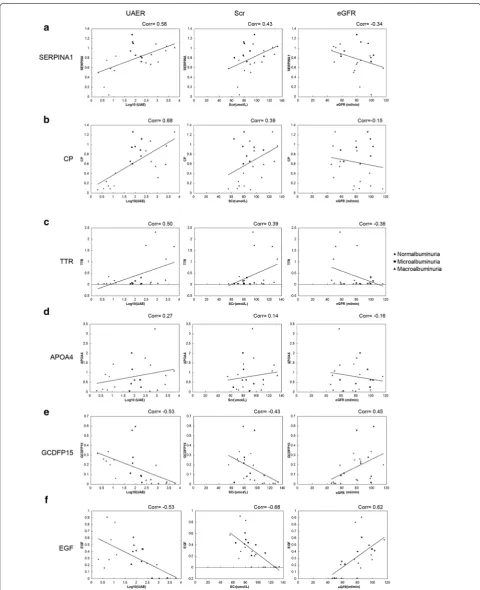
We evaluate the relationship of the six new biomarkers to individual UAER, eGFR and Scr. As shown in Fig. 8, in the diabetic patients, the levels of UAER was positive correlated with the levels of SERPINA1, CP and TTR, negative correlated with GCDFP15 and EGF; the level of SCr was weak positive correlated with the levels of SER-PINA1, CP and TTR, and negative correlated with the level of GCDFP15 and EGF. On the contrary, the eGFR was weak negative correlated with the levels of SER-PINA1 and TTR, and positive correlated with the level of GCDFP15 and EGF. These indicated the five candidate biomarkers, including SERPINA1, CP, TTR, GCDFP15 and EGF, might related to the degree of the kidney injury by individual.
Discussion
Previous urinary proteomics studies had discovered and validated several candidate biomarkers of DN, but the urinary glycoproteome change during the course of DN had not been studied. In our study, to better understand
[image:9.595.58.541.91.389.2]the disease status, we used ConA lectins to enrich uri-nary N-linked glycoproteome, and analyzed the samples with iTRAQ labeling and 2D-LC MS/MS. A total of 478 proteins were identified, including 408 glycoproteins, and 72, 107 and 123 differential proteins in normalbuminuria,
microalbuminuria and macroalbuminuria were identified respectively.
By function and pathway analysis, we found that cell necrosis were inhibited and cell movement and cell pro-liferation were activated in DM, while on the contrary,
Fig. 6 IPA analysis of differential proteins in DN. Function analysis (a) and top enriched pathways (b) in normalbuminuria, microalbuminuria and macroalbuminuria. Z-score >2: significantly activated; Z-score ≤2, significantly inhibited. −Log(P value) >1.5: significantly enriched. Function analy-sis (c) and top enriched pathways (d) in DN glyoproteomic study, previous study and the summarized of glycoproteomic study and previous study
Table 3 Selected six differential urinary proteins quantitative results in iTRAQ and Western blot analyses
Gene name Accession number iTRAQ quantification Western blot
SERPINA1 isoform 1 of alpha-1-antitrypsin P01009 1:0.94:5.37:9.84 1:0.97:1.88:1.73
CP ceruloplasmin P00450 1:1.36:3.60:1.89 1:1.60:8.46:7.42
TTR Transthyretin P02766 1:2.04:1.37:7.95 1:1.67:1.38:14.03
APOA4 apolipoprotein A-IV P06727 1:0.58:3.73:3.15 1:2.70:3.67:5.67
[image:10.595.59.540.88.460.2] [image:10.595.56.538.541.635.2]cell survival, cell viability were inhibited while the func-tions of cell death and apoptosis were activated in DN, which might reflect the compensatory phase of kidney in the early stage of DN, and the de-compensatory phase of kidney in the late stage of DN. It has been reported that
the high glucose induced the mesangial cell proliferation in DM, which was consistent with our finding in DN [45]. It has been reported that unbalanced apoptotic cell death leads to renal cell loss and has been observed in podo-cytes, tubular cells, and endothelial cells in experimental
[image:11.595.60.537.85.608.2]and human diabetic nephropathy, which was consist-ent with our result in DN [46]. Kidney fibrosis was also reflected in the macroalbuminuria group, which indi-cated the late stage pathological change in DN. By path-way analysis, we found a change in the members of HDL/ LDL and acute phase proteins, which reflect the func-tion abnormality in lipid metabolism and the inflamma-tory response during the course of DN, respectively. Six candidate biomarkers related to the above function and pathways were validated by Western blot in this study. As a prospective study would be desirable, a prospective study of another group patient to validate the potential biomarkers was also our future work.
SERPINA1 and CP were acute-phase proteins. SER-PINA1 is a serine protease inhibitor, which target selastase as well as other proteases [12]. Neutrophil elastase degrades a range of substrates including elastin and other extracellular matrix proteins such as collagen, fibronectin, proteoglycan, complement receptors, throm-bomodulin, lung surfactant, and several growth factors [47]. Therefore, in DN, the up-regulation of SERPINA1 would lead to inhibition of elastase and thus may con-tribute to accumulation of matrix molecules, and would maintain vascular elasticity and glomerular integrity. Previous study described that elastin was up-regulated in diabetic kidneys, which was consistent with the up-reg-ulation of SERPINA1 in DN [48]. A previous study also reported the SEPRINA1 level was elevated in the kidney of microalbuminuria, and can cause matrix molecules to accumulate, which further approved that SEPRINA1 played a role in the pathology of DN [48]. CP is a metal-loprotein that binds most of the copper in plasma and is involved in the peroxidation of Fe(II) transferrin to Fe(III) transferrin. The increase of CP in urine is caused by ele-vated intra-glomerular hydraulic pressure, which leads to the development of diabetic glomerulosclerosis [49–51]. The increase of SERPINA1 [12, 17, 52] and CP [52, 53] in the serum and urine of DN were identified in several pre-vious studies and were validated by WB [12, 52], which were consistent with our results.
TTR and APOA4 were carrier proteins, and were com-ponents of HDL and LDL. TTR transports thyroid hor-mones in the plasma and cerebrospinal fluid, and also transports retinol (vitamin A) in the plasma. About 40 % of plasma TTR circulates in a tight complex with plasma retinol-binding protein (RBP) [17]. The transthyretin-RBP complex stabilizes the binding of retinol to transthyretin-RBP and decreases the glomerular filtration and renal catabolism of the relatively small RBP molecule. TTR was reported as a better and suitable marker for nutrition assessment in patients with chronic renal failure [54]. APOA4, like other apolipoprotein family, is a potent activator of lec-ithin-cholesterol acyltransferase in vitro. The mutations of Apolipoprotein A1/C3/A4/A5 gene cluster [55] and the ApoAI-CIII-AIV gene cluster [56] were associated with the lipid levels in type 2 diabetes mellitus and risk of coronary heart disease. Also, in the vitreous of diabetic macular edema, APOA-4 and other pigment epithelium-derived factor, like APOA-4, APOA-1, trip-11, and RBP were elevated [57]. Therefore, APOA4 and other apoli-poprotein might participate in the pathogenesis of diabe-tes and diabetic complication. Previous studies have also shown that the TTR [13, 52] and APOA4 [17] increased in the urine of DN, which were consistent with our study, but no study had validated their changes. Our study firstly validated the up-regulation of TTR and APOA4 by WB.
Two underrepresented proteins, EGF and GCDFP15, reflected the inhibition of cell viability and the activa-tion of cell death in kidney. EGF is an important growth factor which acts a potent mitogenic factor. It plays an important role in the growth, proliferation and differ-entiation of numerous cell types [58]. An experimental animal study [59] showed that the injection of EGF pro-tein decreased the dilation of renal tubule, the apoptosis of renal tubular epithelial cells, and the atrophy of renal tubule and increases the proliferation of renal tubular epithelial cells. These results showed that the loss of EGF might play a role in the apoptosis of renal tubular epithe-lial cell in DN. GCDFP15 was a marker in breast cancer, and is required for the progression through G1 phase, mitosis, and cytokinesis in breast cancer cells [60]. How-ever, no previous study identified or validated the change of EGF and GCDFP15 level in urine in DN patients. In our study, using proteomics method, we first identified the EGF and GCDFP15 decreased in the urine of mac-roalbuminuria DN, and validated the result by Western Blot. We speculated the down-regulated of GCDFP15 promoted the apoptosis of renal tubular or glomerulus cells in DN, but it needs to be further evaluated by exper-imental evidence.
To better understand the patho-physiological change of DN, we summarized the differential proteins in diabetes
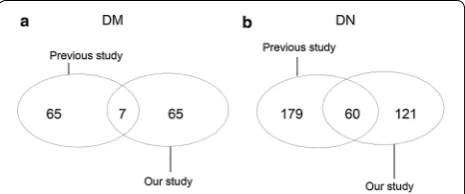
[image:13.595.58.291.90.187.2]and DN (microalbuminuria and macroalbuminuria) in previous study [14, 16, 18, 19, 28–31]. A total of 137 pro-teins (including 72 found in this study) and 361 propro-teins (including 181 found in this study) were changed in DM (Fig. 9a) and DN (Fig. 9b) respectively (detailed data in Additional file 6). Among the co-identified differential proteins, 6 of 7 and 46 of 60 were consistent with previ-ous study in DM and DN.
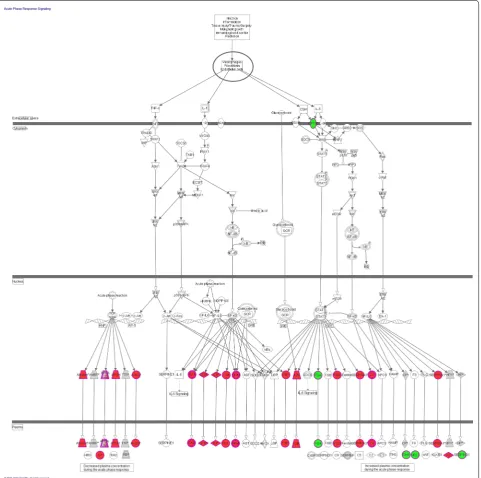
[image:14.595.59.541.90.568.2]IPA analysis was performed for all differential proteins in our study and previously studies. Functional annota-tion analysis of the differential urinary proteins showed that in DN, inflammation response, cell movement, cell migration, cell proliferation and cell death were enriched (Fig. 6c). By pathway analysis, LXR/RXR, FXR/RXR acti-vation pathway, APRS, complement system was remark-ably enriched in DN (Fig. 6d). In detail, 24 differential
proteins in the urine of DM and DN were involved in LXR/RXR activation pathway. Many of them were mainly members of LDL and HDL. 25 differential proteins hit more than one third of the downstream proteins of Acute Phase Response Signaling (Fig. 10). The functional analy-sis of all differential proteins reflect the inflammation response, the abnormality of lipid metabolism, and the activation of the cell death in kidney cells in DN. Espe-cially, the cell viability, cell survival, and cell death related proteins, and the regulation of EMT pathway were enriched only in glycoproteome study but not in previ-ous convention proteomic studies (Fig. 6c, d). Therefore, urinary glycoproteome study could provide more cellu-lar pathological and physiological information along the onset and progression of DN compared with the conven-tional proteomic studies.
Conclusions
In this study, we analyzed the differential urinary glyco-proteome during the course of DN. By function analysis, in normalbuminruia, cell proliferation and cell move-ment were activated, which reflect the compensatory phase. In micro- and macroalbuminuria, cell death and apoptosis was activated, which reflect the de-compensa-tory phase. By pathway analysis, urinary glycoproteome reflect the lipid metabolism abnormality and the inflam-matory response in DN. The acute phase proteins and the member of HDL and LDL proteins were changed in DN; six candidate biomarkers were validated by WB, in which SERPINA1 and CP showed a high performance for early diagnosis of DN.
Our urinary glycoproteomic study identified some new differential proteins which could reflect cellular patho-logical functions, suggesting that urinary glycoproteome could provide more useful information of DN and could be applicable in the biomarker discovery of DN.
Additional files
Additional file 1. Detailed clinical characteristics of normal control, normalbuminuric, microalbuminuric and macroalbuminuric patients. Additional file 2. The iBAQ value and N-linked glycoprotein annotation of all identifications.
Additional file 3. iTRAQ Quantitative protein and peptide list of urinary glycoproteome during the progression of DN.
Additional file 4. Differential proteins in normalbuminuria, microalbumi-nuria, macroalbuminuria. The Cluster classification of each proteins were shown.
Additional file 5. Detail protein list classified by biological functions by IPA in normalbuminuria, microalbuminuria and macroalbuminuria. Additional file 6. The differential protein lists in DM and DN from previ-ous studies.
Abbreviations
DN: diabetic nephropathy; ConA: concanavalin A; iTRAQ: isobaric tags for rela-tive and absolute quantitation; HDL: high density lipoprotein; LDL: low density lipoprotein; AUC: area under curve; DM: diabetes mellitus; ESRD: end-stage kidney disease; 2D-DIGE: two-dimension differential in-gel electrophoresis; CKD: chronic kidney disease.
Authors’ contributions
ZG participated in the design of the study, performed the data analysis and drafted the manuscript. XL carried out the clinical sample collection and immunoassays. ML participated in MS analysis. CS performed the statistical analysis. JT helped to draft the manuscript. WS participated in design of the study and drafted the manuscript. ML participated in design of the study and clinical sample collection. All authors read and approved the final manuscript.
Author details
1 Core Facility of Instrument, Institute of Basic Medical Sciences, Chinese
Academy of Medical Sciences, School of Basic Medicine, Peking Union Medical College, 5 Dong Dan San Tiao, Beijing 100005, China. 2 Department
of Nephrology, Peking Union Medical College Hospital, Peking Union Medical College, Chinese Academy of Medical Sciences, No. 1 Shuaifuyan, Wangfujing Street, Beijing, China. 3 National Key Laboratory of Medical Molecular Biology,
Department of Physiology and Pathophysiology, Institute of Basic Medical Sciences, Chinese Academy of Medical Sciences, School of Basic Medicine, Peking Union Medical College, 5 Dong Dan San Tiao, Beijing 100005, China.
4 The Center for Biomedical Information, Institute of Basic Medical Sciences,
Chinese Academy of Medical Sciences, School of Basic Medicine, Peking Union Medical College, 5 Dong Dan San Tiao, Beijing 100005, China.
Acknowledgements
This work was supported by grants from National Basic Research Program of China (Nos. 2013CB530805, 2014CBA02005), Key Basic Research Program of the Ministry of Science and Technology of China (No. 2013FY114100), National Key Technology Research and Development Program of the Ministry of Science and Technology of China (Nos. 2011BA110B00, 2011BA110B05), the National Natural Science Foundation of China (31400669, 81170665).
Competing interests
The authors declare no competing interests.
Received: 4 August 2015 Accepted: 23 October 2015
References
1. Molitch ME, DeFronzo RA, Franz MJ, Keane WF, Mogensen CE, et al. Nephropathy in diabetes. Diabetes Care. 2004;27(Suppl 1):S79–83. 2. Jain S, Rajput A, Kumar Y, Uppuluri N, Arvind AS, et al. Proteomic analysis
of urinary protein markers for accurate prediction of diabetic kidney disorder. J Assoc Physicians India. 2005;53:513–20.
3. Whittier WL, Korbet SM. Renal biopsy: update. Curr Opin Nephrol Hyper-tens. 2004;13:661–5.
4. Stiles KP, Yuan CM, Chung EM, Lyon RD, Lane JD, et al. Renal biopsy in high-risk patients with medical diseases of the kidney. Am J Kidney Dis. 2000;36:419–33.
5. Varghese SA, Powell TB, Budisavljevic MN, Oates JC, Raymond JR, et al. Urine biomarkers predict the cause of glomerular disease. J Am Soc Nephrol. 2007;18:913–22.
6. Caramori ML, Fioretto P, Mauer M. The need for early predictors of diabetic nephropathy risk: is albumin excretion rate sufficient? Diabetes. 2000;49:1399–408.
7. Hillege HL, Fidler V, Diercks GF, van Gilst WH, de Zeeuw D, et al. Urinary albumin excretion predicts cardiovascular and noncardiovascular mortal-ity in general population. Circulation. 2002;106:1777–82.
9. Chavers BM, Bilous RW, Ellis EN, Steffes MW, Mauer SM. Glomerular lesions and urinary albumin excretion in type I diabetes without overt proteinu-ria. N Engl J Med. 1989;320:966–70.
10. Patel A, MacMahon S, Chalmers J, Neal B, Billot L, et al. Intensive blood glucose control and vascular outcomes in patients with type 2 diabetes. N Engl J Med. 2008;358:2560–72.
11. Fioretto P, Steffes MW, Mauer M. Glomerular structure in nonpro-teinuric IDDM patients with various levels of albuminuria. Diabetes. 1994;43:1358–64.
12. Sharma K, Lee S, Han S, Lee S, Francos B, et al. Two-dimensional fluores-cence difference gel electrophoresis analysis of the urine proteome in human diabetic nephropathy. Proteomics. 2005;5:2648–55.
13. Bellei E, Rossi E, Lucchi L, Uggeri S, Albertazzi A, et al. Proteomic analysis of early urinary biomarkers of renal changes in type 2 diabetic patients. Proteomics Clin Appl. 2008;2:478–91.
14. Jiang H, Guan G, Zhang R, Liu G, Liu H, et al. Increased urinary excretion of orosomucoid is a risk predictor of diabetic nephropathy. Nephrology (Carlton). 2009;14:332–7.
15. Soggiu A, Piras C, Bonizzi L, Hussein HA, Pisanu S, et al. A discovery-phase urine proteomics investigation in type 1 diabetes. Acta Diabetol. 2012;49:453–64.
16. Sharma K, Lee S, Han S, Francos B, McCue P, et al. Two-dimensional fluo-rescence difference gel electrophoresis analysis of the urine proteome in human diabetic nephropathy. Proteomics. 2005;5:2648–55.
17. Rao PV, Lu X, Standley M, Pattee P, Neelima G, et al. Proteomic identifi-cation of urinary biomarkers of diabetic nephropathy. Diabetes Care. 2007;30:629–37.
18. Jiang H, Guan G, Zhang R, Liu G, Cheng J, et al. Identification of urinary soluble E-cadherin as a novel biomarker for diabetic nephropathy. Diabe-tes Metab Res Rev. 2009;25:232–41.
19. Lim SC, Liying DQ, Toy WC, Wong M, Yeoh LY, et al. Adipocytokine zinc alpha2 glycoprotein (ZAG) as a novel urinary biomarker for normo-albu-minuric diabetic nephropathy. Diabetic Med. 2012;29:945–9.
20. Dihazi H, Muller GA, Lindner S, Meyer M, Asif AR, et al. Characterization of diabetic nephropathy by urinary proteomic analysis: identification of a processed ubiquitin form as a differentially excreted protein in diabetic nephropathy patients. Clin Chem. 2007;53:1636–45.
21. Otu HH, Can H, Spentzos D, Nelson RG, Hanson RL, et al. Prediction of diabetic nephropathy using urine proteomic profiling 10 years prior to development of nephropathy. Diabetes Care. 2007;30:638–43. 22. Papale M, Di Paolo S, Magistroni R, Lamacchia O, Di Palma AM, et al.
Urine proteome analysis may allow noninvasive differential diagnosis of diabetic nephropathy. Diabetes Care. 2010;33:2409–15.
23. Rossing K, Mischak H, Parving HH, Christensen PK, Walden M, et al. Impact of diabetic nephropathy and angiotensin II receptor blockade on urinary polypeptide patterns. Kidney Int. 2005;68:193–205.
24. Rossing K, Mischak H, Dakna M, Zurbig P, Novak J, et al. Urinary proteom-ics in diabetes and CKD. J Am Soc Nephrol. 2008;19:1283–90.
25. Snell-Bergeon JK, Maahs DM, Ogden LG, Kinney GL, Hokanson JE, et al. Evaluation of urinary biomarkers for coronary artery disease, diabetes, and diabetic kidney disease. Diabetes Technol Ther. 2009;11:1–9. 26. Alkhalaf A, Zurbig P, Bakker SJ, Bilo HJ, Cerna M, et al. Multicentric
valida-tion of proteomic biomarkers in urine specific for diabetic nephropathy. PLoS ONE. 2010;5:e13421.
27. Andersen S, Mischak H, Zurbig P, Parving HH, Rossing P. Urinary proteome analysis enables assessment of renoprotective treatment in type 2 dia-betic patients with microalbuminuria. BMC Nephrol. 2010;11:29. 28. Merchant ML, Perkins BA, Boratyn GM, Ficociello LH, Wilkey DW, et al.
Urinary peptidome may predict renal function decline in type 1 diabetes and microalbuminuria. J Am Soc Nephrol. 2009;20:2065–74.
29. Schlatzer DM, Dazard JE, Dharsee M, Ewing RM, Ilchenko S, et al. Urinary protein profiles in a rat model for diabetic complications. Mol Cell Prot-eomics. 2009;8:2145–58.
30. Jin J, Ku YH, Kim Y, Kim K, Lee JY, et al. Differential proteome profiling using iTRAQ in microalbuminuric and normoalbuminuric type 2 diabetic patients. Exp Diabetes Res. 2012;2012:168602.
31. Gong D, Chen X, Middleditch M, Huang L, Vazhoor Amarsingh G, et al. Quantitative proteomic profiling identifies new renal targets of copper(II)-selective chelation in the reversal of diabetic nephropathy in rats. Proteomics. 2009;9:4309–20.
32. Haltiwanger RS, Lowe JB. Role of glycosylation in development. Annu Rev Biochem. 2004;73:491–537.
33. Wang L, Li F, Sun W, Wu S, Wang X, et al. Concanavalin A-captured glyco-proteins in healthy human urine. Mol Cell Proteomics. 2006;5:560–2. 34. Yang N, Feng S, Shedden K, Xie X, Liu Y, et al. Urinary glycoprotein
biomarker discovery for bladder cancer detection using LC/MS-MS and label-free quantification. Clin Cancer Res. 2011;17:3349–59.
35. Vivekanandan-Giri A, Slocum JL, Buller CL, Basrur V, Ju W, et al. Urine glycoprotein profile reveals novel markers for chronic kidney disease. Int J Proteomics. 2011;2011:214715.
36. Wang Y, Chen Y, Zhang Y, Wu S, Ma S, et al. Differential ConA-enriched uri-nary proteome in rat experimental glomerular diseases. Biochem Biophys Res Commun. 2008;371:385–90.
37. Wisniewski JR, Zougman A, Nagaraj N, Mann M. Universal sample prepa-ration method for proteome analysis. Nat Methods. 2009;6:359–62. 38. Marimuthu A, O’Meally RN, Chaerkady R, Subbannayya Y, Nanjappa V,
et al. A comprehensive map of the human urinary proteome. J Proteome Res. 2011;10:2734–43.
39. Li YF, Sunkar R. Global identification of small RNA targets in plants by sequencing sliced ends of messenger RNAs. Methods Mol Biol. 2013;956:119–29.
40. Ahrne E, Molzahn L, Glatter T, Schmidt A. Critical assessment of proteome-wide label-free absolute abundance estimation strategies. Proteomics. 2013;13:2567–78.
41. Mi H, Lazareva-Ulitsky B, Loo R, Kejariwal A, Vandergriff J, et al. The PAN-THER database of protein families, subfamilies, functions and pathways. Nucleic Acids Res. 2005;33:D284–8.
42. Nair KS, Garrow JS, Ford C, Mahler RF, Halliday D. Effect of poor diabetic control and obesity on whole body protein metabolism in man. Diabeto-logia. 1983;25:400–3.
43. Fornoni A, Ijaz A, Tejada T, Lenz O. Role of inflammation in diabetic nephropathy. Curr Diabetes Rev. 2008;4:10–7.
44. Narita T, Sasaki H, Hosoba M, Miura T, Yoshioka N, et al. Parallel increase in urinary excretion rates of immunoglobulin G, ceruloplasmin, transferrin, and orosomucoid in normoalbuminuric type 2 diabetic patients. Diabe-tes Care. 2004;27:1176–81.
45. Yano N, Suzuki D, Endoh M, Cao TN, Dahdah JR, et al. High ambient glucose induces angiotensin-independent AT-1 receptor activation, lead-ing to increases in proliferation and extracellular matrix accumulation in MES-13 mesangial cells. Biochem J. 2009;423:129–43.
46. Sanchez-Nino MD, Benito-Martin A, Ortiz A. New paradigms in cell death in human diabetic nephropathy. Kidney Int. 2010;78:737–44.
47. Sun Z, Yang P. Role of imbalance between neutrophil elastase and alpha 1-antitrypsin in cancer development and progression. Lancet Oncol. 2004;5:182–90.
48. Thongboonkerd V, Barati MT, McLeish KR, Benarafa C, Remold-O’Donnell E, et al. Alterations in the renal elastin-elastase system in type 1 diabetic nephropathy identified by proteomic analysis. J Am Soc Nephrol. 2004;15:650–62.
49. Narita T, Hosoba M, Kakei M, Ito S. Increased urinary excretions of immunoglobulin g, ceruloplasmin, and transferrin predict development of microalbuminuria in patients with type 2 diabetes. Diabetes Care. 2006;29:142–4.
50. Anderson S, Brenner BM. Pathogenesis of diabetic glomerulopathy: hemodynamic considerations. Diabetes Metab Rev. 1988;4:163–77. 51. Zatz R, Meyer TW, Rennke HG, Brenner BM. Predominance of
hemody-namic rather than metabolic factors in the pathogenesis of diabetic glomerulopathy. Proc Natl Acad Sci USA. 1985;82:5963–7. 52. Jin J, Ku YH, Kim Y, Kim Y, Kim K, et al. Differential proteome profiling
using iTRAQ in microalbuminuric and normoalbuminuric type 2 diabetic patients. Exp Diabetes Res. 2012;2012:168602.
53. Tachado SD, Samrakandi MM, Cirillo JD. Non-opsonic phagocytosis of Legionella pneumophila by macrophages is mediated by phosphatidylin-ositol 3-kinase. PLoS One. 2008;3:e3324.
54. Saito K, Shimizu A, Inoue S, Hamada C, Fukui M, et al. Effective usage of nutrition assessment proteins in patients with diabetic nephropathy. Nihon Jinzo Gakkai Shi. 2004;46:73–8.
56. Singh P, Singh M, Gaur S, Kaur T. The ApoAI-CIII-AIV gene cluster and its relation to lipid levels in type 2 diabetes mellitus and coronary heart disease: determination of a novel susceptible haplotype. Diab Vasc Dis Res. 2007;4:124–9.
57. Ouchi M, West K, Crabb JW, Kinoshita S, Kamei M. Proteomic analysis of vitreous from diabetic macular edema. Exp Eye Res. 2005;81:176–82. 58. Flamant M, Bollee G, Henique C, Tharaux PL. Epidermal growth factor: a
new therapeutic target in glomerular disease. Nephrol Dial Transplant. 2012;27:1297–304.
59. Chevalier RL, Goyal S, Wolstenholme JT, Thornhill BA. Obstructive nephropathy in the neonatal rat is attenuated by epidermal growth fac-tor. Kidney Int. 1998;54:38–47.
60. Naderi A, Vanneste M. Prolactin-induced protein is required for cell cycle progression in breast cancer. Neoplasia. 2014;16:329–42 (e321-314).
Submit your next manuscript to BioMed Central and take full advantage of:
• Convenient online submission
• Thorough peer review
• No space constraints or color figure charges
• Immediate publication on acceptance
• Inclusion in PubMed, CAS, Scopus and Google Scholar
• Research which is freely available for redistribution