Rochester Institute of Technology
RIT Scholar Works
Theses
Thesis/Dissertation Collections
1997
High-resolution microscopy: Application to
detector characterization and a new
super-resolution technique
Daniel Kavaldjiev
Follow this and additional works at:
http://scholarworks.rit.edu/theses
This Dissertation is brought to you for free and open access by the Thesis/Dissertation Collections at RIT Scholar Works. It has been accepted for
inclusion in Theses by an authorized administrator of RIT Scholar Works. For more information, please contact
.
Recommended Citation
High-resolution Microscopy: Application to Detector Characterization and a New
Super-resolution Technique.
by
Daniel Kavaldjiev
M.S., Applied Physics, Sofia University, Bulgaria, 1992
A dissertation submitted in partial fulfillment of the
requirements for the degree of Doctor of Philosophy
in the Center for Imaging Science
Rochester Institute of Technology
1997
Signature of the Author
_
Accepted
by
Harry
E.
Rhody
CENTER FOR IMAGING SCIENCE
ROCHESTER INSTITUTE OF TECHNOLOGY
ROCHESTER, NEW YORK
CERTIFICATE OF APPROVAL
Ph.D. DEGREE DISSERTATION
The Ph.D. Degree Dissertation of Daniel Kavaldjiev
has been examined and approved by the
dissertation committee as satisfactory for the
dissertation required for the
Ph.D. degree in Imaging Science
Dr. Zoran Ninkov, Dissertation Advisor
Dr. Robert Boyd
Dr. Michael Kotlarchyk
Dr. NavaIgund Rao
DISSERTATION RELEASE PERMISSION
ROCHESTER INSTITUTE OF TECHNOLOGY
CENTER FOR IMAGING SCIENCE
Title of Dissertation:
High-resolution Microscopy:
Application to Detector Characterization and a
New Super-resolution Technique.
I, Daniel Kavaldjiev, hereby grant permission to Wallace Memorial Library of R.I.T. to
reproduce my thesis in whole or in part. Any reproduction will not be for commercial use
or profit.
A1/~/~'r
Signature
_
High-resolution Microscopy: Application
to
Detector Characterization
and aNew
Super-resolution
Technique.
by
Daniel
Kavaldjiev
Submitted
to the
Center
for
Imaging
Science
in
partialfulfillment
ofthe
requiremnetsfor
the
Doctor
ofPhilosophy
Degree
atthe
Rochester Institute
ofTechnology
Abstract
The
research, presentedin
thisdissertation,
consistsoftwoparts.In
thefirst
half
oftheworka novel
microscopy
method,Frequency-domain
Field- confinedScanning
Optical
Microscopy
(FFSOM),
capable of a resolutionbelow
the classicaldiffraction
limit,
is introduced.
An
experimental verification
in
thecase offluorescence
microscopy is
also presented,suggesting
the
biological
microscopy research as animportant
applicationfield.
The
secondhalf
of the thesisis devoted
to an experimental measurement ofthesub-pixel spatial variations
in
solid-statelight
detectors,
namely in
aCharge-Coupled Devices
(CCD). A
specializedhigh-resolution scanning
opticalmicroscope, is described.
With
thehelp
ofthis microscope, thedetector's
pixelresponsefunction is
measuredwitharguably
thehighest
resolutionthatcanbe
achievedin
this typeofmeasurements.The importance
ofthepixel response
function knowledge is demonstrated in
thecaseofphotometric measurementsAcknowledgements
I
wouldlike
to thankmy
advisorsZoran Ninkov
andMehdi Vaez-Iravani for
theirinvaluable
help,
unlimited support andunabating
encouragement.I
also thank allmy
colleguesin the
Center
for
themany helpful disscussions. I
wouldThis
thesisis dedicated
tomy
wifeNelly,
whoseinfinite love
and patience made thiswork possible.
Contents
List
ofFigures
x1
Introduction
1
I
Frequency-Domain Field-Confined
Scanning
Optical
Microscopy
5
2
Super-resolution microscopy
6
2.1
Resolving
power . .6
2.1.1
Classical
resolution criteria7
2.1.2
Information
theory
view of resolution10
2.1.3
Resolution based
on measurement precision ...10
2.2
Confocal
Scanning
Optical
Microscopy
(CSOM)
. .11
2.2.1
Basic
principle .11
2.2.2
Bright-field image formation
14
2.2.3
Fluorescence
CSOM
...19
2.2.4
CSOM
arrangements21
2.3
Super-resolution
far-field
microscopy22
2.3.1
4Pi
confocal microscope23
2.3.2
Standing-wave
excitation ....25
2.3.3
Stimulated-emission-depletion
(STED)
fluorescence
microscopy
. .26
2.3.4
Two-photon
offsetbeam
excitationmicroscopy
28
2.3.5
Ground
statedepletion
fluorescence
microscopy
.28
2.3.6
Point-spread
autocorrelationfunction
(PSAF)
microscopy
29
2.3.7
Frequency-domain
field-confined scanning
opticalmicroscopy
(FFSOM)
30
2.4
Near-field scanning
opticalmicroscopy
31
2.5
Image processing
methods34
3
Frequency-Domain Field-Confined
Scanning
Optical
Microscopy
(FFSOM)
37
3.1
Theory
ofFFSOM
38
3.1.1
Basic
principle38
3.1.2
Signal
generation .40
3.2
Experimental
setup
50
3.3
Experimental
results .54
3.3.1
Chrome
tracks
imaging
results54
3.3.2
DCA
fluorescence
images
56
3.4
Further FFSOM
resolutionimprovement
60
3.4.1
The
role ofimaging
optics60
3.4.2
Image
enhancement64
3.5
Conclusion
65
II
Subpixel
Sensitivity
Variations
of Charge-Coupled Devices
66
4
Spatial
variationsin
pixelsensitivity
ofaCCD array
67
4.1
Functional
Linear Systems
Description
68
4.2
Basics
ofCCD
design
and operation72
4.3
Light detection
withCCD
-system approach
77
4.3.1
Transmission
nonuniformities .78
4.3.2
Photocarriers
Lateral Diffusion
.... ....80
4.3.3
Aperture
averaging
. ....83
4.3.4
Transfer
inefficiency
84
4.3.5
Combined
effect84
4.3.6
Experimental
measurement ofMTF
of a solid-statedetector
...85
4.4
Limits
ofvalidityoftheMTF
approach87
4.4.1
Linearity
.88
4.4.2
Shift-invariance
.89
4.5
Pixel
Response
Function
of a solid-stateimager
.95
4.5.1
Definition
95
4.5.2
Experimental
measurement . .99
4.6
PSF
vs.MTF
101
5
Experimental
measurement ofthe pixel responsefunction
ofaCCD
105
5.1
Choosing
anexperimental configuration105
5.2
Experimental setup
112
5.3
Results
121
5.4
Discussion
127
5.5
Conclusions
133
6
Application
ofthe experimentally
measured pixel responsefunction
134
6.1
Aperture
photometry
134
6.2
Shift
error computation146
6.2.1
Input
functions
146
6.2.2
Signal
calculation148
6.2.3
Results for Gaussian
andAiry
inputs
....149
6.2.5
Results
for
mecosinput
156
6.3
Shift
errorand shiftuncertainty
.159
7
Conclusions
1647.1
FFSOM
164
7.2
Pixel
Response
Function
of solid-statelight detector
165
A
Sensitivity
data files format
167A.l
Text data
files
167
A. 2
IDL data
files
167
List
of
Figures
2.1
Illustration
oftheRay
leigh's
resolution criterion ....8
2.2
Optical
arrangementfor
different
types ofmicroscopes12
2.3
Depth discrimination
in
CSOM
13
2.4
A
generalized microscopegeometry
15
2.5
Focal
intensity
distributions
20
2.6
4Pi
fluorescence
confocal microscope configuration ....23
2.7
Standing-wave excitationmicroscope
24
2.8
STED fluorescence
microscope26
2.9
Two-photon
offsetbeam
excitationmicroscopy
27
2.10 Illumination
modeNSOM
31
2.11 NSOM
aperture32
3.1
Illustration
ofthebasic
principle ofFFSOM
.... .38
3.2
Overlap
2D
PSF for different beam
offsets . . .433.3
Confocalizaton
ofAC
PSF
....45
3.4
Cross-section
of non-confocalizedAC
PSF
... ...46
3.5
Cross-section
ofAC
PSF in
x-direction .47
3.6
Cross-section
ofAC
PSF in
y-direction .48
3.7
Experimental
configurationutilizing
aZeeman-split laser
50
3.8
FFSOM
experimentalsetup
51
3.9
FFSOM images
ofchrome tracks54
3.10
Experimental
FFSOM LSF
55
3.11
Fluorescence FFSOM DCA
sample56
3.12
Fluorescence FFSOM DCA
images,
DC
andAC
.58
3.13 Fluorescence FFSOM
DCA,
DC
andAC
II
59
3.14
Fluorescence FFSOM DCA
images,
small range . .59
3.15 FWHM
and sidelobes,
equivalent objectives ... .61
3.16 FWHM
and sidelobes
asfunction
ofthe offset .... ... . .62
3.17
Confocalized
FFSOM
PSF,
x-direction,NAeic=0.95,XAC0,d=1.4
...63
3.18
Two-point
imaging
in
FFSOM,
x-direction63
4.1
Basic
MOS
capacitor structure andits
band
diagrams
73
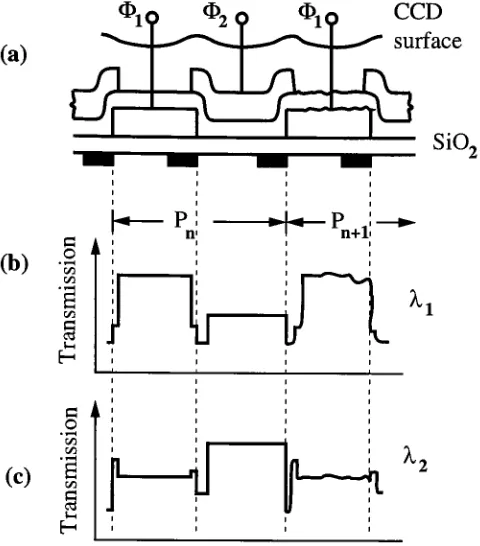
4.3
Charge
transferanddetection
in
a two-phaseCCD
sensor .... ...76
4.4
Transmission
nonuniformities80
4.5
Loss
of resolutiondue
tolateral diffusion
81
4.6
Averaging
effectsdue
to pixelresponsefunction
83
4.7
Illustration
ofthesampling
process89
4.8
First
replicas ofOTF
after thesampling
91
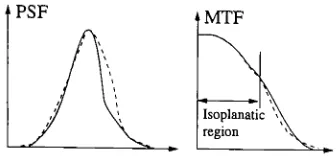
4.9
Isoplanatism
regiondefinition
93
4.10 Pixel
responsefunction
ofaCCD
....95
4.11
Signal
detected
by
theCCD
with pixelfunctions
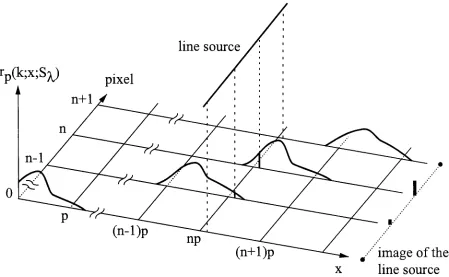
rp(n;x;S\).
...96
4.12
Total
pixel responsefunction
.... ....97
4.13 Experimental
measurement ofPRF
99
5.1
Generalized
experimentalsetup
for
measurement ofPixel Response Function
(PRF)
ofaCCD
106
5.2
Cross-section
oftheillumination
intensity
distribution
108
5.3
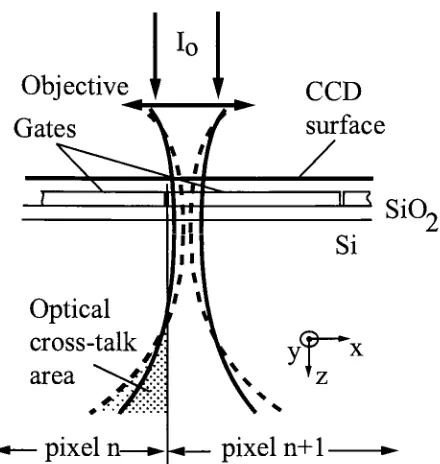
Optical
crosstalkorigins109
5.4
Cross-section
oftheillumination
intensity
for different HA
110
5.5
Experimental setup for
measurement ofthepixel responsefunction
of aCCD
detector.
.113
5.6
Nine
CCD
frames,
120
5.7
Experimental
PRF
at488
nm 1225.8
Experimental
PRF
at633
nm123
5.9
Reflectance line
scansin
x-directionthroughthe pixel-of-interest,for
anillu
minationat
488
nm(solid
line)
and633
nm(dashed
line). Note
thereversal of the ratio ofthe relative reflectancesbetween
the the two wavelengths atx=2 um and x=6 /.m . . 124
5.10
Sensitivity
line
scansin
x-directionthrough thepixel-of-interest(averaged
in
y-direction over severalscans),
for
anillumination
at488
nm(solid
line)
and633
nm(dashed
line). The
solidverticallines
at x=0 amandx=9 am markthepixel extent
125
5.11
PRF for
two pixels127
5.12 Total PRF
128
5.13 Experimental
boundary
maps130
5.14
Loss
ofasymmetry illustration
131
5.15 Integrated detector
sensitivity132
6.1
Illustration
ofthe aperturephotometry measurement137
6.2
Accumulated
signalformation
....139
6.3
Accumulated functions
for
Gaussian input
141
6.4
Accumulated functions for
Airy
input
.142
6.5
Position dependence
ofthe photometric signal . .145
6.6
Mecos function
148
6.7
Shift
errordependence
on theinput
size150
6.9
Shift
error, compared to the conventionalSNR
153
6.10 Defocused
Airy
pattern155
6.11
Shift
errorfor
defocused image
156
6.12
Shift
errorfor
mecosinput
157
6.13
Photometric
signalprobability distribution
159
6.14
Photometric
signalhistograms
160
Chapter
1
Introduction
The
research, presentedin
thisdissertation,
is
divided in
two parts.Although
the tworesearch areas seem quite
different,
they
have
a commondenominator
a questfor
higher-resolutionoptical microscopy methods and experiments.
The
first
half
ofthe workis
concerned with opticalmicroscopy
methods, capable of aresolution
below
theclassicaldiffraction limit.
According
to the classicalformulation
oftheimaging
theory,
theresolving
power oftheimaging
systemdepends
ontheform
and size ofthesystem's point-spread
function
(PSF).
This function is
theimage,
formed
by
theopticalsystem, of a point object.
In
the most generalterms,
PSF
represents the smallestvolume,from
whichinformation
about the object canbe
extracted.The resolving
powerincreases
witha
decrease
ofthespatialextent ofthesystem'sPSF. Diffraction
theory
postulatesthat the size ofthePSF
cannotbe
reduced adinfinitum,
being
dependent
on parameters suchas the system's numerical aperture andthewavelength ofthe
light.
Hence,
thereis
alower
boundary
to the achievable resolution, and thislimit
is usually
referred to as a classicalresolution
limit.
Intensive
researchin
thelast decades has
resultedin
thedevelopment
ofseveral classesof super-resolution methods,
i.e.
methods capable ofimaging
with resolutionbeyond
thea point
illuminator
andapointdetector
for
image
formation.
The lateral
resolutionin
suchanarrangement exhibits moderate
improvement
overthediffraction limit. More
important,
however,
is
the significantincrease
in
theaxialresolution, which permits three-dimensionalimaging.
The
optical microscope with thehighest
current resolutionis
the near-fieldscanning
optical microscope.
In it
an apertureis
scannedin
extreme proximity1ofthe object.
The
illuminated
sample volumeis
thendefined
by
the physicaldimensions
of the aperture,rather than
by
diffraction.
Using
sub-wavelength sized apertures,defined
by
thetip
of a taperedopticalfibers,
a resolutionin
the order oftwentieth oftheillumination
wavelengthcan
be
achieved.In
order to maintain the aperture-object separation within thenear-field
region, an atomicforce
microscopeis incorporated into
the arrangement.Thus
thearrangement
is
a contact method, and whilehaving
enormousadvantages,
such ashigh
resolutionand
obtaining
topography
information,
it
also suffersfrom
significantdrawbacks,
such as
scanning
speedlimitations,
stability
issues,
samplehandling
limitations,
andsetup
complexity.
A
non-contact(i.e.
afar-field)
super-resolution method wouldbe
free
ofsome ofthesenear-field microscopeproblems,and would
be
aninvaluable
toolfor
applicationswherehigh
resolution
has
tobe
accompaniedby
high image
capture rate andinstrument
reliability.Several
methodshave been
recently proposed, all of which utilize more than onebeam
to
illuminate
the sample, and then extractinformation only from
afraction
of a the sizeof a
diffraction-limited focal
spot.One
such method,Frequency-domain
Field-confined
Scanning
Optical
Microscopy
(FFSOM),
is introduced in
thefirst
part of the work.A
theoretical
investigation,
as well as an experimental verificationin
the case offluorescence
microscopy
is
presented.The
results showthat,
indeed,
the proposed schemeis
capable ofbeyond-diffraction-limit
lateral
resolution.It is
thefirst
and sofar
theonly
(at
the time ofthis writing) ofthe mentioned class of
far-field
methods, todemonstrate,
notonly
predict,lateral
super-resolution.The
secondhalf
ofthe thesisis
devoted
to an experimental measurement ofthesub-pixelspatial variations
in
solid-statelight
detectors,
namely in
aCharge-Coupled
Devices
(CCD).
The
theoreticalimplications
of such variationsfor
animaging
applicationis
alsoinvestigated.
The
CCD
is
a two-dimensionalarray
oflight-sensitive
sites,
referred to as pixels.The
spatial
sensitivity
of such anarray
depends
in
thefirst
place on the pixel size and on thepixel-to-pixel spacing.
These
parametersdefine
thedetector's
sampling
spatialfrequency,
which(through
thesampling
theorem)
is
a measure ofthefirst-order
spatialdegradation
of the
detected image.
The currently
adopted measure of thisdegradation is based
on applicationof thelinear
systemstheory
to theimage
detection
process, andis
givenby
afunction in
thespatialfrequency
domain
themodulationtransferfunction
ofthedetector.
The
problem with this treatmentis
that,
strictly
speaking, thesampling
performedby
thedetector
destroys
the shiftinvariance
of theimaging
system.The
system thendoes
notposes a unique modulation transfer
function,
rendering
theuniversality
of thisdetector
performance measurequestionable.
The sampling
problemis
most severewhenthefeatures
ofinterest in
theimage
are restricted overonly
small number ofpixels(referred
to as anundersampling
case)
, asituationencounteredincreasingly
oftenin high
resolutionelectronicimaging
systems.In
thesecases themodulationtransferfunction
is nearly
useless,andothermeasures
for
thedetector
performance are needed.An
alternative performance measureis
throughadescription
oftheimaging
propertiesofthe
individual
pixels.The
response ofasingle pixeltoanilluminating
pointsource,
willbe
referredto as apixel response
function
(PRF).
If
allthepixels ofthearray
areequivalent2,
the pixel response
function
completely characterizes theimage detection
process.This
function
canbe
used to predict thedetector
responsefor
allinput
images,
in
contrast tothe restricted
applicability
ofthe modulationtransferfunction.
2
When considering image
detection
by
aCCD,
the pixel responsefunction is
usuallyassumed constant withinthepixel area
(uniform
pixelsensitivity)
andzero outsidethepixelarea.
This is
areasonable approximationin many situations, but in
high-accuracy
applications,
especially
where theimages
areundersampled,
the actualform
ofthe pixel responsefunction
becomes
ofprimary importance. The
increasing
demands
on thedetector
performance requires a
detailed knowledge
ofits
PRF,
that canbe
obtainedonly
throughhigh
spatial resolution
(on
the order of the wavelength oftheillumination
light)
experiments.Due
to theinherent difficulties in
thePRF
experimental measurement,only
a small number,
low-resolution
(several
times thelight wavelength)
resultshave been
reportedin
theliterature
todate.
An
increase in
theresolutioncannotbe
achieved as atrivialimprovement
of previous experimental
setups, but
requires adedicated
arrangement tobe designed.
In
the secondhalf
of this work such a specializedhigh-resolution scanning
opticalmicroscope, that uses a solid-state
light detector
asits
"sample",
is described.
With
thehelp
ofthis microscope, pixel responsefunctions
are measured witharguably
thehighest
resolution that can
be
achievedin
this type of measurements.The PRF
resultsfor
acharge-couple
device
are presented, and are shown todiffer significantly
from
the assumedideal
PRF form.
The importance
ofthePRF
knowledge is demonstrated in
the case ofPart I
Frequency-Domain
Field-
Confined
Chapter
2
Super-resolution
microscopy
Ever
since thefirst
imaging
system wasbuild,
one ofthefundamental
questions addressedwastheir
ability
todiscriminate between different imaged
objects.A
measure ofthisability
is
the resolution, orresolving
power, andis
one of the mostimportant
measures of theimaging
system performance.In
this chapter the concept of resolution, as appliedin
thefield
of microscopy,is discussed.
The
traditionaldefinition
ofresolving
power, and theclassical
limit
to the resolutionof an optical system,is
the subject of section2.1.
In
subsequent sections are presented methods, generally referred toas "super-resolution" methods,
for overcoming
thislimit. In
section2.2
is
presented the mostwidely
used super-resolutionopticalconfiguration, namely theconfocal microscope.
In
section2.3
otherfar-field
arrangements, subjects of
intensive
researchin
thelast
several years, are presented.The
opticalmicroscope with the
highest resolving
power at the presenttime,
theNear-Field Optical
Microscope
(NSOM),
is described in
section2.4.
Image processing
methodsfor achieving
super-resolutionare presented
in
section2.5.
2.1
Resolving
powerBefore
discussing
resolution,it
is
advantageousfirst
todiscuss
whatactually
constitutes antypes of
images
ethereal,
calculated anddetected.
The
etherealimage
represents theactual physical phenomenon
behind
theimaging
process,This
image is only
ahypothesis,
that
is
tested,
asis
customary
toscience,
by
an attempt to modelit.
The
result of themodel
is
a mathematicaldescription
of the physical process, the calculatedimage.
The
experimental
test,
onthe
otherhand,
ofthe etherealimage
hypothesis
resultsin
adetected
image.
The
classicaltreatment of resolutionis based
on calculatedimages. The
various resolution
criteria,
(e.g.
Rayleigh criterion)
formulated
from
thispoint ofview,depend solely
onthe
imaging
system's point-spreadfunction. The latter is determined
by
withthewavelengthofthe
illumination
and the system's numerical aperture.By
their nature, the calculatedimages
are noise-free.Such
images,
ofcourse,do
not occurin
practice.Therefore,
Ronchi
argues, a resolution metric
based
on thedetected
images,
is
much moreimportant.
The
detected
images,
being
a result of experimentalobservations, areinherently
noisy.A
resolution
determined from
themdepends
on additionalfactors,
such astheenergy
ofthe sourceand the
sensitivity
properties of thedetector.
Since
Ronchi's
paper,further
research ondetected images
resolutionhas
shownthat,
in
the end, resolutionis
limited
by
systematicandrandomerrors
inherent in
themeasurement process.Nevertheless,
the classical resolutionmetric
is
stilluseful,being
simple to estimate and compare, andbeing
independent
ofparameters externalto the optical system.
2.1.1
Classical
resolution criteriaThe resolving
power of animaging
systemtraditionally
is
givenin
theform
of two-pointresolution,
defined
as theability
ofthe system to separate theimages
oftwoneighboring
point sources.
The
performance ofthe systemis ultimately limited only
by diffraction,
if
the effects of possible abberations are
ignored.
Because
ofthefinite
size ofthe
system'saperture, the
image
ofthepointsourceis
adiffraction
pattern, orthepoint-spreadfunction
Figure
2.1: Illustration
oftheRayleigh's
resolution criterionOf
allthe resolutioncriteria proposed onthebasis
of assumptionsabove,
the classicalRayleigh
criterion[2, 3]
is
by
far
the most widely used.It
states that twoincoherent
point sources are
just
resolvedif
the central maximum oftheintensity
diffraction
patternproduced
by
one ofthe point sources coincides withthefirst
zero ofthediffraction
pattern ofthe secondsource,
as shownin
figure 2.1. The diffraction limited
resolutionis
defined
as the minimumdistance between
theresolved sources, andis
therefore equal to thefirst-zero
radius ofthesystem's point-spread
function. For
monochromaticillumination
at wavelengthA
and acircularly
symmetric system with numerical apertureXA,
thePSF is
described
by
the
Airy
function,
whose radiusis
givenby
thefamous
expression:,
0.61A
, ,The Rayleigh
criterion canbe
generalized toinclude
PSFs
thatdo
not go to zeroin
thevicinity of the
function's
central maximum.The
resolutionlimit in
this caseis
givenby
thedistance for
which thedip
in
the center ofthe totalintensity
distribution is
81%
ofthemaxima on
its
either side3.Rayleigh's
choice of resolutionlimit,
whichseem ratherarbitrary,
is based
on presumedresolving
capabilities ofthehuman
visual system.In
his
own words"This
ruleis
convenient on account ofits simplicity
andit is sufficiently
accuratein
viewofthe necessary uncertainty as to what
exactly is
meantby
resolution"
(from
ref.[4]).
The only
additionalone worthmentioning here is the Sparrow
criterion,in
whichthesecondderivative
at the center oftheintensity
sumfrom
two point objectsis
zero.The
resolutionlimit
is the
largest distance between
thetwo
PSFs,
for
whichthe totaldistribution
has
nodip
in its
center.It
gives asimilar expressionas equation2.1,
with numericalfactor
of0.47
instead
of0.61.
The
coherenceoftheincident
radiationaffects theresolutionoftheoptical system.The
criteria
described
above assumedincoherent
illumination,
and theimaging
processis linear
in intensity.
The
intensity
distribution
thenin
thefinal image
the sum oftheintensities
ofthe two point sources.
In
the other extreme case of complete coherence oftheincident
radiation, the system
is
linear in
amplitude,resulting in
more complicatedform
of thedetected
intensity
distribution.
In
the general case the sources arepartially
coherent.In
thiscase the concept ofresolution asappliedto
imaging
in
partiallycoherentlight has
been
the subject of considerable research[5-8].
The formulation
of a resolution metricin
thegeneral case
is
nottrivial,
since the measured separation ofthe sourcesdepends
ondegree
of coherence.
It
wasfound
[9]
that the correct separationofthe two point sources may notbe
measurable even when the classical criteriapredict good resolution.As
a reference pointto the classical resolutionlimit in
microscopy, consideradry
objec tive system, whereNA
cannot exceed one.Assuming
incoherent illumination
atA=500
nm, thenaccording
toequation2.1
theresolutionlimit is approximately 300
nm.For
oilimmer
sion systems
NA
couldbe
ashigh
as1.5,
withcorresponding
resolution of200
nm.As
is
obvious
from
the abovediscussion,
thesenumbersarenot exact,but
rathershouldbe looked
at as order-of-magnitude calculations.
The formulation
ofthe classical resolutionlimit
log
ically
leads
to thedescription
as"super-resolving"
all methods and optical arrangements
2.1.2
Information
theory
view of resolutionClose
correspondence canbe drawn between
theresolving
power problem andinformation
theory
concepts[10-13].
Di
Francia
[10]
showed thatfrom
theinformation
theory
pointof view, the object
has
aninfinite
bandwidth,
and thereforeinfinite
number ofdegrees
offreedom.
The
imaging
systemhas
afinite
bandwidth.
Consequently,
theimage
will alsohave finite bandwidth
andfinite
numberdegrees
offreedom.
The resolving
poweris
ameasure of this number.
An
image
withfinite
degrees
offreedom may
correspond to awhole set of
different
objects.It is
evident thatany knowledge
which the observerhas
apriori about the object will
help
him
to select the real objectfrom
the set ofall possible ones.For
example, theimage
oftwo points,however
close to one another,is
different from
that of one point.
If
the observerknows
a priori the number andform
of pointimages,
he
can
infer
from
theimage
theexact object,i.e.
he
canselect thereal object.Lukosz
[13, 14]
proposed aninvariance
theoremto explainthe conceptsunderlying
allsuper-resolution techniques.
The
theorem states thatfor
an optical systemit is
not thespatial
bandwidth,
but
the number ofdegrees
offreedom
ofthe system thatis fixed. This
number
is
afunction
ofthe spatial and temporal systembandwidth
andits
spacefield-of-view.
It
canbe
arguedthen thatany
parameter ofthesystem,
e.g. spatialbandwidth,
canbe increased
at theexpense of some ofthe other parameters, such as temporalbandwidth
or
field-of-view
(as
in
confocal microscope).The increase
also canbe
the result of some apriori
knowledge
ofthe object,"freeing"
degrees
offreedom for
useby
theparameter tobe
increased.
2.1.3
Resolution
based
on measurement precisionSince
theresolutionis limited
ultimatelyby
themeasurementprecision,many
attemptshave
been
made to expressit
accordingly.For
example,Falconi
[15]
assumed a photon-limited
imaging
system withknown PSF.
He
defined
the measurementlimit
asthe
minimum angular change
in
the positions ofthe two point sources, that gives an overall signal-to-noiseratio
(SNR)
for
someimage
parameter4ofone, and
is
thereforelikely
tobe detected. Quan
titative results
following
a similarreasoning
by
Fried
[16]
showthat thereis
nofundamental
impediment
to
measuring
the propertiesofthepair-even whenthe separation
is
less
thanthe
Rayleigh
limit
-other than a certain
SNR.
Another
approachis
based
onSNR
analysisin
thefrequency
domain
[17],
where thedetected
image is
considered a stochasticPoisson impulse
process[18].
The
known
statisticalpropertiesofthe
laser
specklepatternallow thecomputation ofthe various statisticalmoments of the
image Fourier distribution. The
SNR
is
defined
as the ratio ofthe meanand the standard
deviation
ofthisdistribution.
Establishing
a minimumdetectable
SNR
results
in
a resolutiondefinition
as the maximum spatialfrequency
for
which the systemachieves this
SNR.
2.2
Confocal
Scanning
Optical
Microscopy
(CSOM)
2.2.1
Basic
principleIn
essence, the conventional microscopeis
a parallelprocessing
system whichimages
theentire object simultaneously.
This
imposes
rather severe requirements on the optical elements
in
the system.These
requirements canbe
relaxedif only
one point ofthe objectis
imaged
at a time.Now
the systemhas
toform
adiffraction
limited image only
of a singlepoint.
The
price tobe
paidis
that scanninghas
tobe
performedin
order to acquire theentire
field. Whether
thisis
suitable or not,depends
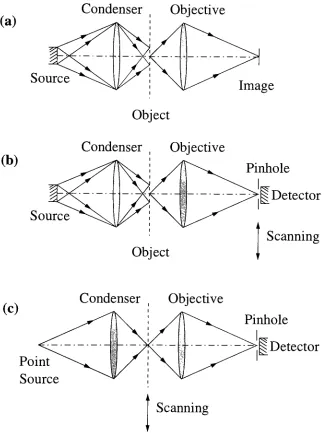
onthe specific application.Figure
2.2(a)
shows thebasic
configuration ofa conventional microscope[19].
In
it,
the object
is illuminated
by
an extended source via condenserlens,
an objectiveforms
animage in
theimage
plane.The
resolutionis
principallydetermined
by
the objectivelens.
The
aberrations of the condenser are unimportant andit
primarily serves todetermine
the coherence of the
imaging
[6].
A
scanning
microscope couldbe build using
such a(a)
Condenser
,
Objective
Source
(b)
Object
Condenser
t
Objective
Source
Image
Pinhole
Detector
Scanning
(c)
Condenser
,Objective
Point
Source
Pinhole
Detector
[image:25.543.112.436.137.572.2]Scanning
Point
source
Object
Figure 2.3: Depth
discrimination
in
CSOM
configuration
by
scanning
apointdetector in
theimage
plane,recording
the signal at eachpoint and
subsequently
forming
theimage
pointby
point, as shownin
figure
2.2(b).
This
configuration
is
analogous to onein
which a point sourceis
imaged
on the objectby
anobjective, and a collector
lens
forms
theimage in
the plane oflarge
areadetector.
The
resolution of thisscanning
scheme canbe
shown tobe
equivalent to the resolution of a conventional microscope[20,21].
The
aberrations of the secondlens,
the collector,in
thiscase are unimportant
in
determining
the resolution.In
orderto makeboth lenses
play equal rolein
forming
theimage,
a confocal arrangement
has
tobe
used, as shownin
figure
2.2(c).
In
thiscase a point sourceis imaged
ontheobject
by
thefirst
lens,
illuminating
only
a small area, and a pointdetector insures
thatonly the
light
from
the same small area ofthe objectis detected. Figure
2.2(c)
representsthe
Confocal
Scanning
Optical
Microscope
(CSOM).
It
canbe
saidthat,
theimprovement
in
the resolution comesfrom
the employment ofthe
both
lenses
simultaneously toimage
theobject.This
canbe
explainedin
morephysicalterms
by
theLukosz
principle[13],
cited above, which states that the resolution canbe
increased
at the expense ofthefield-of-view. The latter
canthenbe
recoveredby
scanning.An immediate
applicationofthis principleleads
to near-fieldmicroscopy
(see
section2.4).
The
confocal microscope wasfirst
described
by Minsky
[22].
The primary
motivationwould allow an
image
of a section of a thick object tobe
obtained, without the presence ofthe out-of-focus signalfrom
theother sections.Images from
several sections, or"slices",
then can
be
used toform
athree-dimensional
image
of the objectby building
it
"slice"
by
"slice"
[19]. This
opticalsectioning
property
canbe easily
understood with thehelp
offigure
2.3.
The
solidfines
show thefight
pathin
the case of afocused
system, when thesource
is
focused
onthe surfaceofthe object, andthereflectedlight is focused
on thepointdetector. The dashed
lines
correspond to thedefocused
case, with the object nolonger in
the
focal
plane of the objective.In
this case the reflectedlight
will arrive as adefocused
blur
at thedetector,
and thedetected
signal willbe considerably
weaker.The ability
oftheCSOM
toform
athree-dimensionalimage is
perhapsits
mostimpor
tant property.
In biological microscopy
this allows theinvestigation
ofa structureinside
a cell.
In
material science or semiconductordevice
technology
it
allows the measurements of the topography.It
shouldbe strongly
emphasizedhere
that3D
imaging
capability is
of a
different
naturefrom
the restricteddepth-of-field in
the conventionalmicroscopy
[23].
In
thelatter
the out-of-focusinformation is
blurred,
but
still presentin
theimage.
The
totalintensity
ofthelight in
theimage
planeis
constant as the object moves through thefocus.
In
the confocal case on the otherhand,
thedetected
intensity
of the out-of-focusinformation
is
smaller,giving
rise toimproved
resolutionand contrast.2.2.2
Bright-field
image formation
In presenting
theimage formation
theory
of the confocal microscope,it is instructive
topresent
first
thegeneralcase ofscanning
microscopy, andsubsequently
todiscuss
thevariouslimiting
cases.The
onedimensional
case willbe
presenteddue
tonotationalsimplicity,
the twodimensional
casefollowing
a straightforward extension.A
generalized transmissionmicroscope
is
shownin
figure
2.4,
thereflection casebeing
essentially identical. The
lenses
are assumed stationary, and the position x0 of the sample
is
scanned.Without
significantIllumination
objective
Collection
objective
PjGj)
Sample
P^)
t(x -xJ
u3(^2)
Md
U4(x)
Figure 2.4:
A
generalized microscopegeometry
of
2d,
in
order tosimplify
the expressions.Let
theillumination
objectiveL\,
shownin
figure
2.4,
have
the point-spreadfunction
h\{x0)
givenby
[21]:
+oo
a,
(2.2)
h1(x0)=
y
Pi(6)e-^flXodei
where
Pi()
is
theobjective pupilfunction.
Assuming
aplane waveasanincident
wavefront, the amplitudedistribution
of theilluminating
radiationin
the sample plane{x0,y0)
is
by
definition
the objectivePSF,
h\{x0).
If
the samplehas
transmittancedistribution
t(x0),
the amplitude
/_(-E0;
xs)
after the sampleis:
/_(-c0;
xs)
=hi(x0)t(xs
-x0).
(2.3)
The
amplitudeUzfa',
xs)
at the collectionlens
L2
planeis
givenby
propagating
[/_
frm
the sample
by
distance
d,
as shownin figure 2.4:
+00
it,
This
amplitudeis
multipliedby
thecollection objectivepupilfunction
P2(2)
andpropagatedby
adistance
Md,
to
give amplitude atthe
detector
plane as:+CO
U4{x;xs)
=jJ
hx(x0)t(x8
- x0)P2(&)e-^xeiT-d^dx0d&.
(2.5)
oo
If
thedetector
has
a spatialsensitivity
function
D(x),
theimaging
signalI(xs)
at thescanning
position xsis
givenby
theintegrated
intensity,
weightedby
the sensitivity:+00
I(xs)
=j j
D{x) \Ui(x;
xs)\2dx
=00
+00
=
//
D(x)h1(xo)hl(x,0)t^s
~Xo)t*(xs
-00
e^2Xe-Md^xdx0dx'0dcl2d^2dx.
(2.6)
Several
cases canbe
considered,depending
on theform
ofdetector sensitivity
D(x)
andpupil
function P2(2):
Conventional scanning microscopy
:L>(_c)=l
In
conventionalscanning
microscopy aninfinite
and uniformdetector is
assumed, andtherefore,
from
physical point of view, the result cannotdepend
on thedetector
spatialcoordinate x.
Mathematically,
the two termsin
equation2.6,
containing
x, canbe
directly
integrated:
+00 +00
j
eMd&xe-ird&dx=j
e-^2"?2)dx
=5{&
-Q.
(2.7)
-00
Next
theintegration
over2,
2
canbe
performed,resulting in introduction
of a newspreadfunction g2{x)
[24],
associated withtheFourier
transformofthe modulus of pupilfunction
With
thesesimplifications,
the signalin
the conventional caseis
givenby
theintegral:
+00
I(xs)=
hi(x0)hl{x'0)t(xs-x0)t*{xs-x'0)g2(x0-x'0)dx0dx'0
(2.9)
00
Two
limiting
cases are of particularinterest. When
thecollection objectiveL2
is
ofinfinite
extent
i.e.
P2(2)=l,
theimaging
becomes
incoherent.
The
spreadfunction is
g2[x0x'0)
=5(x0
x'0), as aFourier
transform of constant.The
twointegrals in
equation2.9
aretransformed
into
a singleintegral,
andthedetected
signalis:
+00lincoh(xs)
=/
\hi{x0)\2\t(xs
dx0
=\hi\2 \t\2
.
(2.10)
CO
The incoherent
system thereforeis linear in intensity.
The
square of theillumination
objective
point-spreadfunction
h\{x)
plays the role of theinstrument PSF. The
image is
described
as a strict convolutionbetween
thesquaredtransmissionfunction
andthesystemPSF. This
fact is
of extremeimportance in
thefield
ofimage
processing, since manywell-behaved
algorithmshave been developed
to restoreimages
convolved with aknown
systemPSF
(see
section2.5).
Coherent
imaging
takes place, when the collection objectiveis
infinitely
small.The
pupil
function is
P2(2)
=(2))
sofrom
equation2.8
g2[x0x'0)
=1.
The
twointegrals in
equation
2.9
are then conjugates, andthedetected
signalbecomes:
+00 i
ICoh{xs)
=/
hi{x0)t{xs-x0)dx0
=\hxt\2.
(2.11)
The
systemin
this caseis linear in
amplitude.The
use of various restoration algorithmsis
more problematicbecause
a nonlinear operation(i.e.
hermitian conjugation) is
appliedafter the convolution.
Confocal scanning
microscopy :D(x)
=6(x)
In
CSOM,
the collectionlens images
the sample onto a pointdetector,
located for
carried
directly
in
equation2.6.
The
integrals,
dependent
on x and(2,(2
canbe
groupedto give:
+00
jjj
&{x)P2^2)P2*{Qe-^^'^e^'^-^
d^d^
=h2(x0)h*2(x0),
(2.12)
00
where
h2(x)
is the
point-spreadfunction
ofthe collectionlens,
defined in
the same manneras the
illumination
objectivePSF from
equation2.2:
+00
h2(x0)=
J
P2(2)e-^2Xod^
(2.13)
00
With
thissimplification the signalaccording
to equation2.6
is
givenby:
+00
Iconf(xs)
=//
h1(x0)h*1(x'0)t(xs
-x0)t*(xs
-x'o)h2(x0)h2(x0)
dx0
dx'0
=(2.14)
00
=
\hi(x0)t(xs
x0)h2(x0)
dx0\
=|/ii/i2
<8)|
.(2-15)
Thus in
bright-field
confocalmicroscopy
the equivalent system point-spreadfunction
is
aproduct ofthe
illumination
andcollectionobjectivesPSFs. If
the objectives areequivalent,the signal
becomes:
Iconics)
=\h\t\2
,
(2.16)
that
is,
theimaging
is
coherent, with a systemPSF
equal to theincoherent
point-spreadfunction
oftheillumination
objective, ascanbe
seenby
comparing
withequation2.10.
If
the optical system exhibits radialsymmetry,
theFourier integrals in
equations2.2
and
2.13,
describing
theobjectives'
PSFs,
aretransformedinto
Fourier-Bessel
integrals. It
is
customary tointroduce
normalized radial coordinatesufor
the axialdirection,
andvfor
the radial
direction,
as[24]:
u=
zsin2{a/2)
(2.17)
A
2tt
v= r sin(a).
where z and rare theaxialand radial
coordinates, respectively,
andthenumerical apertureNA
= sina.The
focal
image
of a point objectusing
a conventional and a confocal microscopeis
then given
by
equations2.10
and2.15
as[19,24,25]:
-(M-W
(2.19)
W0.)
=(^)4
(2-20)
These
functions
are plottedin
figure
2.5. It is
seen that althoughboth functions have
the same zeroes, the central
lobe
of the confocal responseis
narrowerby
afactor
of1.4
relative to the conventional one
(FWHM
metric).When
theRayleigh
criterionis
satisfied,in
thein-focus
confocalimage
the two points are separatedby
anormalizeddistance
of0.56
units.
This is
8%
closerthanin
a conventional microscope, not avery significantimprove
ment.
In
additionto the narrowing, the sidelobe intensities
aredramatically
reduced, andthus a marked reduction of artifacts
in
the confocalimages
canbe
expected, animportant
property, that will
be
usedfor
the proposed super-resolutiontechnique,
tobe described in
chapter
3.
As
an example of the role of the pupilfunction,
consider aninfinitely
thin annularpupilsuch that the
light is
transmittedonly
at a normalized radius =1.
In
this caselannular{0,v)
=Jq(v)
(2.21)
This is
also plottedin figure
2.5,
whereit
canbe
seen that the centrallobe becomes
narrower at the expense of the
higher
sidelobes.
A
similar effectis
observedin
thelater
described
Frequency
domain
Field
confinedScanning
Optical
Microscopy
(FFSOM),
andits
significance and methodsfor
correction willbe discussed in
the next chapter.2.2.3
Fluorescence CSOM
The image formation
properties offluorescence scanning
microscopesarecompletely
differ
genera-0.8
6 0.6
0.4
0.2
0.0
-\
-}
\
\\
\
\\
\
-.\
1
imlil j.iir
Figure 2.5: Focal
intensity
distributions
for
conventionalSOM
(solid
line),
confocal(dashed
line)
and annular(dotted
line).
tion mechanism.
The
fluorescence
destroys
the coherence oftheilluminating
radiation atthe object and produces an
incoherent
fluorescent field
proportionalto theintensity
oftheincident
radiation.The
resolution resultsfrom
theincident,
or excitation, radiation withwavelength
Ae,
rather thanfrom
thelonger-wavelength
(A/)
fluorescence
radiation.In
aconventional,
non-scanning
microscope, thisis
not the case.Here
thefluorescence
radiation,
andits
wavelength,defines
the resolution.This is
a veryimportant
advantage ofthescanning
systems, and one ofthereasonsfor
their widely accepted usage.To describe
thefluorescence CSOM detection
process,let
/
denote
the spatialdistri
bution
of thefluorescence
generation, andhi
is
the excitation(illumination)
PSF
atAe.
The
field
thenbehind
the objectis
givenby |/ii|2/,
andis subsequently imaged
at thefluorescence
wavelengthXf
by
the collectionlens
withPSF h2. The image
intensity
is
givenby
[19]:
Jf
=\heff\
/
heff
=hxfav^iu/B^/P),
(2.22)
where
6
\f/Ae
>1 is the
wavelengths ratio.The
effective system point-spreadfunction
is
givenby
the product ofthe
objectives'PSF
at their respective working wavelengths.It
alsofollows from
equation2.22,
that
thefluorescence
CSOM
imaging
is
incoherent,
in
sharp
contrast to thebright-field
caseCSOM,
in
which theimaging
is
always coherent(see
equation2.15).
Since
thefluorescence
image is
described
as a strict convolution withthe system
PSF,
it is
inherently
suitablefor
application ofthe variousimage
restorationalgorithms.
2.2.4
CSOM
arrangementsOne
ofthe majordrawbacks
of classicalscanning
microscopeis
that theimage is
not collected in
realtime.To
overcomethis restriction,whilekeeping
theadvantagesoftheconfocalmicroscopy, the tandem
scanning
microscope wasdesigned
[26,27]
anddeveloped
as a realtime
scanning
confocal microscope[28,29].
It
uses adisk
withpinholes onthem,
positionedalong
aspiralin
suchawayas toform illumination-detection
pairs.The
disk is
rotated anda confocal
image is
obtainedin
real time.A drawback is
that with a smaller pinhole sizethe amount of
tight
availableis
reduceddrastically. The ordinary
solutionfor
thisproblemin sranniTig
confocal arrangementis
toincrease
theintegration
time,
whichis
not possiblehere.
The
excellentdepth discrimination
ofthe confocal microscopeis particularly
attractivein
thefield
of metrology,especially for
surface profilometry.Different
configurations weredevised,
most ofthemrelying
on thedifferential
contrast scheme[30,31],
which couldbe
obtained
in
a variety of ways.In
the confocal microscope,for
example, the use ofa splitpupil suchthat aphase
difference
of tt existsin
thetransmissivity
between
the twohalves
ofthe
lens
resultin differential
contrastimaging
[19]. Confocal interference
schemes werealso obtained, were two
detectors
are used, whose outputs are proportional to the sumand the
difference
of animaging
and a referencebeam
[32,33].
From
thisdata
the purethat record the
through-the-focus
signal atevery
scan point,subsequently extracting
thephase
information,
have
alsobeen
proposed[34, 35]
2.3
Super-resolution
far-field
microscopy
As
briefly
mentionedabove,
"super-resolution"usually
refers toimaging
techniquesdeliv
ering
resolutionhigher
than thediffraction
resolutionlimit.
Since
thelatter is
proportionalto thesize ofthepoint-spread
function
oftheimaging
system,decreasing
PSF
size willlead
to an
increase
oftheimaging
resolution.In
orderto understandhow
the resolutionlimit
canbe
overcome,it is
advantageous toconsider the
PSF
as the smallest volume that canbe imaged
by
a system,i.e.
to considerthe single-point resolution, rather than the traditional two-point resolution.
Imaging,
in
most general
terms,
is
a process ofdetecting
physicalinteraction
between
theilluminating
radiationandthe sample.
The
spatial resolutionthereforedepends
onthe volume sizeoverwhich this
interaction
takes place.In
the classical sense thisvolumeis
givenby
theimage
ofa pointsource,
for
whichthe spatial extent cannotbe
made smallerthan a certain valuedepending
on the system aperture andilluminating
wavelength.Hence
the existence of alimit.
To
overcome thislimit it is necessary
to create aninteraction
volume smaller thanthe
diffraction-limited PSF
ofthe system.In
the methods tobe
presentedin
thissection,
this volume reduction
is
achievedthroughsimultaneousinteractions
withthe sample oftwoor more
diffraction-limited
point-spreadfunctions. All
of methods areprimarily
concernedwiththe
fluorescence
microscopy.The
reasonfor
thisis
two-fold.Firstly,
most ofthesuper-resolution research
in
thelast decade has been driven
by
theneeds ofthemedicalcommunity.In biological light
microscopy the mostimportant
contrast comesfrom
fluorescence,
sinceit
canbe
much more specific andsensitive than the reflectance and absorbance.Secondly,
the effective point-spread
function,
createdin
by
these methods, tends tobe
complex,
fluorescence
signal
incident
wavefront1
fluorescent
sample
incident
wavefront2
Figure 2.6:
Illustration
of4Pi
fluorescence
confocal microscope configuration.Two
objectives with common
focal
pointilluminate
with coherent wavefronts the sample, where aconstructive
interference
takes place.The illumination PSF
approaches a more sphericalshape and the axial resolution
is
enhanced.After Hell
andStelzer
[36].
imaging
with such aPSF
could resultin
variousimage
artifacts,due
tointerference
effectswithin the
illuminated
volume.The incoherent
nature offluorescence
imaging
makesit
a more robust method
in
this respect.A
notableimprovement in
sidelobes
reductionis
achieved
in Frequency-domain
Field-confined
Scanning
Optical
Microscope
(FFSOM)
(the
subject of chapter
3),
making FFSOM
attractive super-resolutioninstrument in
reflectionand transmissionregimes.
2.3.1
4Pi
confocal microscopeAs
shownin
section2.2,
oneofthemain advantages oftheconfocalarrangementis
toreducethe
depth-of-field
oftheimaging
system, thusallowing 3D
imaging
withthe use of opticalsectioning
methods.However
evenin
that configurationthePSF has
anellipsoidalform,
its
size
along
thedirection
ofthe optical axiszbeing
morethan twice thelateral
size[19,36].
The 4Pi
confocal configuration wasintroduced
by
Hell
et al.[36],
as amethodfor
improving
the microscope's axial resolution.
The basic
principlebehind
the4Pi
configurationis
shownin
figure
2.6.
In it
twoobjective
sample
[
interference
planes
mirror
Figure
2.7:
Principle
ofthe standing-wave excitation microscope.Fluorescence is
excitedin the
sampleby
interference
patternformed
from
anillumination
beam
andits
reflectionoffa mirror
below
the specimen.After
Bailey
et al.[41]
the sample
[36-40].
If
theilluminating
wavefronts arecoherent,
constructiveinterference
takes place at the
sample, resulting in
anillumination PSF
with reduced sizein
the axialdirection
andhaving
a more spherical shape[36,37].
The decrease in
the volume oftheillumination PSF decreases
theinteraction
volumefor fluorescence
in
thesample,
thereforeenhancing
the axial resolution ofthe systembeyond
theclassical resolutionlimit.
The drawback
of such an arrangementis
that theinterference,
whilesharpening
thePSF's
centrallobe,
at thesametime enhances thesidelobes.
Imaging
withsuch afunction
creates significant
artifacts, making image interpretation difficult.
The
sidelobes canbe
significantlyreduced
by
utilizing
atwo-photon excitation schemeinstead
ofthe traditionalsingle photon
fluorescence.
In
two-photonexcitation,
upperfluorescent
state canbe
reachedby
the moleculeonly
afterinteraction
with two photons[37,38].
This
being
a nonlinearprocess, thenew
illumination
PSF is
proportionalto thesquareofthefocused
intensity
thusleading
toanintrinsic
three-dimensionalimaging
capability The
use of a point-likedetector
further
sharpensthefocus
and suppressesthe sidelobes.With
such a configuration anaxial2.3.2
Standing-wave excitationAnother
method,
aimed atimproving
theaxialresolution, is
thestanding-wavefluorescence
microscope
(SWFM),
proposedby
Lanni
[42].
In it
two coherent plane-wavelaser beams
cross the sample volume, where
they
interfere.
This
is
shownin
figure
2.7
for
singlelens
illumination,
witha mirror usedto
create the secondbeam.
Arrangements
withtwolenses
placed ontheopposite sides ofthesample
have
alsobeen
demonstrated [41].
When
the twofields
arepolarized normalto theircommonplane ofincidence
(s-polarization),
theresulting
interference
patternintensity
has
asimple cosinedependence
withspacing
thatcanbe
madesmaller than the size of
diffraction limited PSF. Fluorescence is
excited proportionally tothis
intensity,
andit
also exhibit this periodiclocalization.
The
sample canbe axially
scanned
by
changing
the phase ofone ofthebeams.
In
the single-objective arrangement,this
is
done
by
shifting
themirrorin
the axialdirection
with apiezotranslator.This
axialscanning
allows a3D image
with resolutionbetter
than50
nmtobe formed
[41].
Multiple
beam
offset methodsThe microscopy
methods tobe discussed
next canbe described
aslateral
offset methods.
They
all share a commonillumination geometry in
order to achieve super-resolution.The
goalis
againis
todecrease
theinteraction in
the samplebelow
thediffraction-dictated
volume.
The lateral
offset methodsemploy
two or threeillumination
beams,
offsetfrom
each other
in
thefocal
plane at adistances
smallerthan their radii.The
region ofoverlap
formed between
thesebeams
canbe
anarbitrary
small volume.If only
the signal originating
in
this volumeis
detected,
the system resolution willbe
beyond
thediffraction
limit,
and willultimately
be limited
by
signal-to-noiseconsiderations, as
discussed
in
section2.1.
The
methodsdiffer in
the mannerin
which the signal generatedin
theoverlap
regionis
separated
from
theindividual illumination
beams'
=S1
pinholes
<