International Journal of Innovative Technology and Exploring Engineering (IJITEE) ISSN: 2278-3075, Volume-8 Issue-12, October 2019
Jeyalakshmi Suresh Kumar, Natesan Manoharan, Rajangam Udayakumar
Abstract: Water Quality Index (WQI) is a widely used technique in defining the quality of groundwater and finding whether it is advisable for human use. It is utmost necessary steps to understand the physical and chemical parameters defining the water quality for particular period and location using WQI calculation as it gives information in a single value. WQI has been calculated in twenty ground water samples collected from selected sampling stations at Madurai in the pre-monsoon, monsoon and post monsoon seasons. The water quality index values suggested that almost all the ground water samples were above 150, which indicated that they were unfit for drinking and one sample from Vilangudi had WQI less than 100 which indicated the water as poor category for drinking but could be used for irrigation purposes. The groundwater quality is also defined to be little better during post monsoon season in all the samples than during pre-monsoon and monsoon season.
Keywords: Groundwater, Indian Standards Institution (ISI), Indian Council of Medical Research (ICMR), World Health Organization (WHO), Physicochemical, Water quality index (WQI),
I. INTRODUCTION
Water is a necessary prerequisite for a varied scope of human activities like drinking, agricultural, industrial, electricity production, product development, and disposal of garbage. Ground water is of high value than surface water as it is normally free from pollutants [1]. But such ground water too is contaminated by various reasons. The contamination of water is mainly because of increasing inhabitants, leading to urbanization, industrial development, excess use of chemicals in the fields, and other human interventions [2] and also failure of monsoon and improper management of rain water. Regular incessant checking of the physical, chemical and biological quality of ground water is needed to reduce the effect of the change in quality on mankind and other lives.
Water quality index (WQI) is widely used for evaluating the contamination in the ground water and so it may be outlined as “a rating, reflecting the composite influence of various quality parameters on the overall quality of water.” [3]. The water quality index is generally categorized into two elements like physic-chemical and biological indices. The physic-chemical indices are built on the values of different physico-chemical parameters in every water sample [4].
Revised Manuscript Received on October 05, 2019.
Mrs. Jeyalakshmi, Suresh Kumar, Department of Biochemistry,
Government Arts College (Autonomous), Kumbakonam – 612 002, Tamilnadu, India. Email: jeyavws2011@gmail.com
Dr. Natesan Manoharan, Department of Marine Science,
Bharathidasan University, Tiruchirappalli – 620 024, Tamilnadu, India. Email: biomano21@gmail.com
Dr. Rajangam Udayakumar*, Department of Biochemistry,
Government Arts College (Autonomous), Kumbakonam – 612 002, Tamilnadu, India. Email: udayabiochem@yahoo.co.in
In this calculation where mathematical equation is used, various water quality parameters applied in the formula gives back a single value as water quality index. This value calculated provided easy way to understand the water quality and decide on the proper use of any water body. It is the understanding of water quality for the doable uses by combining complicated information and generating a score that describes easy water quality standards. [5].
The chemical constituents of the thrown out trash on the land without disposing properly could penetrate and pollute the underground water table. Effect of contamination being reported in various studies at different study area paved way for the present study in Madurai to understand the pollution level of ground water during the study period.
II. METHODS
In this study, attempts have been made to calculate the WQI of ground water samples collected from selected stations of Madurai, Tamil Nadu, India. (Table-I) World Health Organization (WHO) standards were adopted for calculation of WQI based on physico-chemical data by using the methods proposed by Horton [3] and modified by Tiwari and Mishra [6]. By utilizing ten water quality parameters pH, Total Dissolved Solids, Total Hardness, Total Alkalinity, Calcium, Magnesium, Chloride, Nitrate, Potassium and Sulphate, WQI values are calculated in this study to understand the exact status of the water in the study area for various uses.
WQI CALCULATION
WQI was calculated using Horton’s method [3]. Quality rating and unit weight of every water quality parameter was calculated using permissible limits as specified by Indian Standards Institution (ISI), Indian Council of Medical Research (ICMR) or World Health Organization (WHO). Formula to calculate WQI is done using the Equation (1) as referred by Horton, 1965.
WQI = ∑qnWn/ ∑Wn………. (1)
In the equation, qn specifies Quality rating of every nth water quality parameter.
Wn= Unit weight of every nth water quality parameter.
Table- I: GPS Coordinates of the Sample Locations in the Madurai (Study area).
Sample Sites
No. Sampling Sites
Latitude (N)
Longitude (E)
S1 Anna Nagar 9.91954 78.15568
S2 Palanganatham 9.9081538 78.097039
S3 Kosakulam 9.96696 78.11795
S4 Aanaiyur 9.96112 78.10811
S5 Koodal Nagar 9.96159 78.10163
S6 Theppakulam 9.913787 78.14545
S7 Oomatchikulam 9.99773 78.13966
S8 Thirunagar 9.88096 78.05691
S9 Thiruparankundram 9.8813 78.0671
S10 Nagamalai 9.93684 78.03268
S11 Ponnagaram 9.93046 78.1114
S12 KK Nagar 9.93358 78.1459
S13 Pudur 9.94715 78.14998
S14 Iyer Bungalow 9.96945 78.13855
S15 Vilangudi 9.95446 78.08766
S16 Avaniyapuram 9.87484 78.11008
S17 Jaihindpuram 9.90625 78.11145
S18 Thiruppalai 9.9754 78.13604
S19 Kochadai 9.94065 78.08366
S20 Thirumangalam 9.84474 78.01129
Quality rating (qn) calculation
Formula to calculate quality rating (qn) is done using the equation (2).
qn = [( Vn – Vid)/( Sn- Vid) ] x 100…………..(2) In the equation,
Vn specifies the exact value of every nth water quality parameter at a given sample location.
Vid specifies Ideal value for every nth parameter in pure water. Here in this study, Vid for pH = 7 and 0 for all other parameters.
Sn specifies standard permissible value of every nth water quality parameter.
Unit weight (Wn) calculation
Formula to calculate unit weight (Wn) is done using the equation (3).
Wn = k / Sn ……….…… (3) In the equation,
Sn = Standard permissible value of every nth water quality parameter.
k = Constant of proportionality and it is calculated using the equation (4).
k = [1 / ( ∑ 1/ Sn=1,2,..n) ]……….(4).
CLASS OF WATER USING WQI VALUES
The WQI values calculated from the samples from the study area is classified within the ranges specified in Table-II to empathize the recommended usages of the ground water.
Table-II: WQI, class of water and recommended usage of water [7].
S.No. WQI range Class of
water
Recommended usages
1 0-25 Excellent Drinking,
Irrigation and Industrial
2 25-50 Good Domestic,
Irrigation and Industrial
3 51-75 Fair Irrigation and
Industrial
4 76-100 Poor Irrigation
5 101-150 Very Poor Restricted use for Irrigation
6 Above 150 Unfit for
Drinking or irrigational purpose
Proper treatment required before use.
WQI OF THE SAMPLE LOCATIONS
The WQI values of the ground water samples collected from sampling locations for post monsoon, pre-monsoon and monsoon samples are calculated using ten physicochemical parameters given in Table-IV for the all the twenty samples.
III. RESULTS
The WQI values of the sample locations during pre-monsoon, post-monsoon and monsoon seasons are calculated and presented in Table-V.
International Journal of Innovative Technology and Exploring Engineering (IJITEE) ISSN: 2278-3075, Volume-8 Issue-12, October 2019
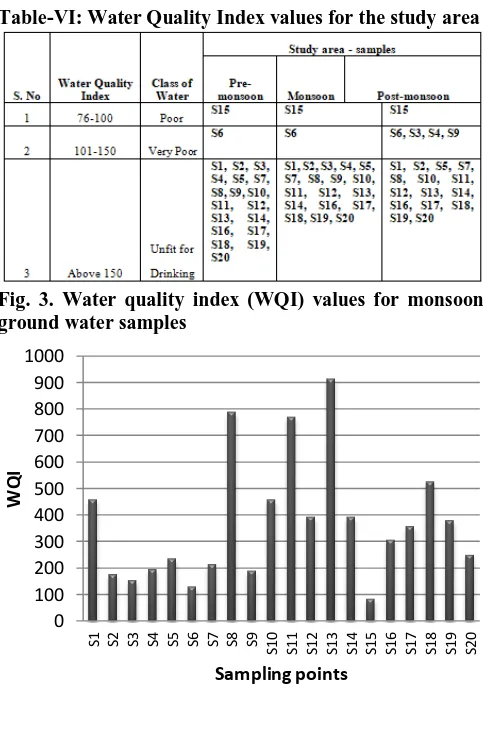
Based on WQI values, it is clear that none of the study samples are found to be in the range of 0 to 75. Only one sample S15 is found to be within 76-100 range in all the three seasons. Most of the samples from the study area showed very poor quality of ground water as it had highest WQI values and so proved to be unfit for drinking or irrigation purpose. The results are shown in Table-VI.
WQI of pre-monsoon groundwater samples
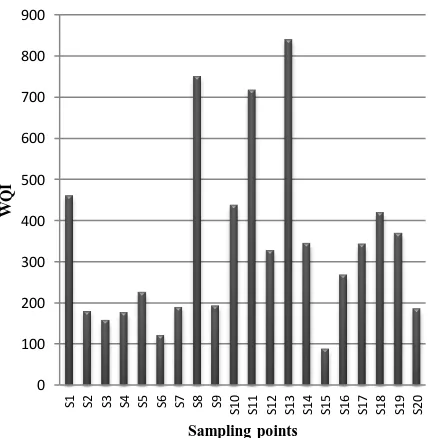
The index values calculated for pre monsoon samples are shown in Table-V. S6 (Theppakulam) sample is found to be within 101 to 150 range which accounts to be very poor water. Almost all the pre monsoon ground water samples are very poor and unfit for drinking when compared with Table-II & VI. Only one sample (S15) of the study area is in good quality during pre-monsoon season.
WQI of post monsoon groundwater samples
The index values calculated for post monsoon samples are shown in Table-V. S6, S3, S4 and S9 samples are found to be within 101 to 150 range which accounts to be very poor water. Almost all the post-monsoon ground water samples are very poor and unfit for drinking when compared with Table-II & VI. Only one sample (S15) of the study area is in good quality during post monsoon season. WQI values are little lower in post monsoon samples than pre-monsoon and monsoon samples.
WQI of monsoon groundwater samples
The index values calculated for monsoon samples are shown in Table-V. S6 (Theppakulam) sample is found to be within 101 to 150 range which accounts to be very poor water. Almost all the monsoon ground water samples are very poor and unfit for drinking when compared with Table-II & VI. Only one sample (S15) of the study area is in good quality during monsoon season.
Table-V: WQI values of Pre-Monsoon, Post-Monsoon and Monsoon samples
Sample Id WQI Pre-Monsoon Post-Monsoon Monsoon S1
460 434 458
S2
179 155 174
S3
158 139 152
S4
176 145 194
S5
225 193 233
S6
121 102 129
S7
189 168 212
S8
750 697 788
S9
193 150 187
S10
437 338 456
S11
717 646 769
S12
327 295 392
S13
840 805 913
S14
344 269 393
S15
88 63 83
S16
267 166 305
S17
342 289 357
S18
419 314 525
S19
369 260 377
S20
[image:3.595.310.564.46.382.2]185 156 249
[image:3.595.319.533.447.666.2]Fig. 1. Water quality index (WQI) values for Post-monsoon ground water samples
Fig. 2. Water quality index (WQI) values for Pre monsoon ground water samples
0 100 200 300 400 500 600 700 800 900
S1 S2 S3 S4 S5 S6 S7 S8 S9 S10 S11 S12 S13 S14 S15 S16 S17 S18 S19 S20
W Q I Sampling points 0 100 200 300 400 500 600 700 800 900
S1 S2 S3 S4 S5 S6 S7 S8 S9
[image:3.595.72.266.465.781.2]Table-VI: Water Quality Index values for the study area
Fig. 3. Water quality index (WQI) values for monsoon ground water samples
IV. DISCUSSION
WQI values of both pre-monsoon and monsoon samples share the same status, which shows 5% of the total ground water samples are poor and 5% are very poor and 90 % are totally unfit for drinking. S15 (Vilangudi) sample has poor status for drinking but it can be used for irrigation as it is only the recommended usage for this particular status. S6 (Theppakulam) sample has very poor quality which has restricted use for irrigation purpose also. 18 samples had WQI values above 150 which are totally unfit for drinking. This study is proved to be in agreement with the findings by Sirajudeen et al [8]. S15 (Vilangudi) water sample is far better than any other samples from the study area. The WQI value is less than 100. From the study it is clear that only in this sample pollution rate is comparatively less than any other samples in the study area.
And WQI of post monsoon samples states that 5% of the total groundwater samples are poor, 20% are very poor, 75% are unfit for drinking. S15 (Vilangudi) sample has poor status for drinking but it can be used for irrigation as it is only recommended usage for this particular status. S3 (Kosakulam), S4 (Aanaiyur), S9 (Thiruparankundram) samples has very poor quality and so these samples cannot be used as well for irrigation. According to WQI values, groundwater quality is proved to be little lower in samples collected in post-monsoon samples than in samples in pre-monsoon and pre-monsoon season.
Earlier study showed that pollution with potassium, calcium, magnesium, nitrate, and sulphate in the sampling sites [9] has recommended us to suggest people living in the study area especially in S8, S11, S13 to carefully monitor the
quality of ground water and follow further treatment where needed before any human use.
V. CONCLUSION
From the above investigations it is clear that all the ground water samples under study are either very poor or poor or totally unfit for drinking. WQI values are slightly lower in post-monsoon season than pre-monsoon and monsoon season. This increase in WQI might be due to increased potassium and total dissolved solids. Therefore it is mandatory to carefully monitor these ground water sources immediately. So from the present study it is suggested to take steps in reducing the pollution load as ground water is the base for every other water sources.
REFERENCES
1. Pramisha Sharma, Amit Dubey, Chatterjee, "Determination of heavy metals in surface and ground water in and around (Agrang Block) Raipur District, Chhattisgarh, India,” International Journal of Scientific & Engineering Research, Vol 4, no.9, sept 2013, pp. 722-724. 2. Rao, Mushini Venkata Subba, Vaddi Dhilleswara Rao and Bethapudi
Samuel Anand Andrews.“Assessment of Quality of Drinking Water at Srikurmam in Srikakulam District’, Andhra Pradesh, India,” International Research Journal of Environmental Science, vol.1, no.2, 2012, pp. 13-20.
3. Horton, R. K. “An index number system for rating water quality,” Journal-Water Pollution Control Federation, vol. 37, 1965, pp. 300-305.
4. Dhirendra Mohan Joshi, Alok Kumar, and Namita Agrawal, "Studies on physicochemical parameters to assess the water quality of river Ganga for drinking purpose in Haridwar district," Rasayan J. Chem., Vol.2, no.1, 2009, pp.195-203.
5. Devendra Dohare, Shriram Deshpande and Atul Kotiya. “Analysis of Ground Water Quality Parameters: A Review,” Research Journal of Engineering Sciences, Vol. 3,no. 5, 2014, pp. 26-31.
6. Tiwari, T.N. and M.A. Mishra,“A preliminary assignment of water quality index of major Indian rivers,” Indian J. Environmental Protection, Vol.5, 1985, pp.276-279
7. Brown RM, McClelland NI, Deininger RA, O’Connor MF, “ A water quality index—crashing the physiological barrier,” Indic Environ Qual, Vol. 1, 1972, pp.173–182.
8. J. Sirajudeen, Arul Manikandan and V. Manivel, Water Quality Index of Ground Water around Ampikapuram area near Uyyakondan channel, Tiruchirappalli, Tamilnadu, Archives of Applied Science Research, vol. 5, no. 3, 2013, pp. 21-26.
9. Jeyalakshmi Suresh Kumar, Rajangam Udayakumar and Natesan Manoharan, "Statistical Assessment of Ground Water Quality Using Physicochemical Parameters in Madurai, Tamil Nadu, India," Journal of Theoretical and Experimental Biology (ISSN: 0972-9720),vol. 12, no. 3 and 4, 2016, pp. 111-125.
AUTHORSPROFILE
M. Jeyalakshmi Suresh Kumar, Ph.D Scholar,
Department of Biochemistry, Government Arts College (Autonomous), Kumbakonam – 612 002, Tamilnadu, India. And earlier she worked 10 years in Aravind Eye Care system, Madurai, Tamilnadu, India as Science Writer in Aravind Communications Department and Senior Technician and Junior Research Fellow in Aravind Medical Research Foundation. She published 4 papers in National and International journals. She has received the BEST SCIENTIFIC PAPER AWARD for the best paper (oral) presentation in the ASIA-ARVO meeting on Research in Vision and Ophthalmology 2009 held in Hyderabad. She can be reached at jeyavws2011@gmail.com
Dr. Natesan Manoharan, is working as an Associate
Professor in the Department of Marine Science at Bharathidasan University, Tiruchirappalli - 620 024, Tamilnadu, India. He holds M.Sc., M.Phil and Ph.D degrees. He is handling classes for PG, M.Phil and Ph.D Levels. He is
having more than 25 years of teaching and 17 years of research 0
100 200 300 400 500 600 700 800 900 1000
S1 S2 S3 S4 S5 S6 S7 S8 S9 S10 S11 S12 S13 S14 S15 S16 S17 S18 S19 S20
WQ
I
[image:4.595.48.294.59.427.2]International Journal of Innovative Technology and Exploring Engineering (IJITEE) ISSN: 2278-3075, Volume-8 Issue-12, October 2019
experience. His research area is Drug development from Marine Cyanobacteria and Marine Pharmacology. He can be reached at
biomano21@gmail.com.
Dr. Rajangam Udayakumar, is working as an