International Journal of Innovative Technology and Exploring Engineering (IJITEE)
ISSN: 2278-3075, Volume-9 Issue-1S, November 2019
Abstract:The telecommunication industry plays a great role in human societies and thus much more attention is now being paid to telecommunication towers than it was in the past. Telecommunication towers are tall structures usually designed for supporting parabolic antennas installed at a specific height. As telecommunication towers are the only means of enhancing both the coverage area and network reliability, more and more telecommunications towers are installed nowadays. The stability of towers post-earthquake or a cyclone is of great concern. Hence in the present study, a detailed analysis has been made on the behaviour of the telecommunication tower subjected to wind and seismic loads with varying the bracing system of towers. Gust factor method is used for wind load analysis. Conducted analytical study on effect of wind on telecommunication towers, for wind speed of 50m/s for four combination of bracing systems; Also studied the effect of earthquake loading on telecommunication towers using Modal analysis and Response Spectrum method, for seismic zones III, IV and V for all the four combination of bracing systems. The results of displacement at the top of the towers and stresses in the bottom leg of the towers are compared and the optimum bracing system is found.
Keywords: bracings, earthquake loading, telecommunication towers.
I. INTRODUCTION
O
ver the past 30 years, the growing demand for wireless and broadcast communication has spurred a dramatic increase in communication tower construction and maintenance. Many industries and communications demand towers for variety of purposes. Some of the applications of steel towers are Microwave transmission for communication, Radio transmission, Television transmission, Satellite reception, Air traffic controls, Flood light stands Meteorological measurements, Oil drilling masts, Overhead water tanks, Power transmission lines etc. Fastest growing telecommunication market has increased the demand of steel towers. Failure of such structures is a major concern.Towers can be classified into three groups based on structural action. Free-standing towers – it is square in plan and is supported on ground or on tall buildings usually by
Revised Manuscript Received on November 27, 2019.
* Correspondence Author
Joyson Silva P, Assistant Professor, Department of Civil Engineering, R.M.K. Engineering College.
Dhilip Kumar R G, Assistant Professor, Department of Civil Engineering, R.M.K. Engineering College
Dr. Binu Sukumar, B.Tech in Civil Engineering, from Govt. College of Engineering, Trivandrum, Kerala University,
four legs. Guyed towers – it is supported by guy wires which transmit the wind load to the ground and it is mostly suitable for large open spaces. Monopoles – it is self-supporting or free standing polygonal sectioned pole structures and are commonly used in cellular and personal communication service applications.
In this study, a comparative analysis is being carried out for towers with different bracing patterns for Wind zone with wind speed 50m/s and Earthquake zones III to V of India. Gust factor method is used for wind load analysis as per IS 875 (Part 3) - 1987; modal analysis and response spectrum analysis as per IS 1893-2002 is used for earthquake
analysis
.
II. LITERATURE REVIEW
G. Ghodrati Amiri et al (2004) conducted a study on seismic behaviour of four legged self-supporting telecommunication tower. They investigated the overall seismic response of 10 existing four legged self-supporting telecommunication towers in Iran under the effects of the design spectrum from the Iranian seismic code of practice and the normalized spectra of Manjil, Tabas and Naghan earthquakes. Detailed 3D full scale numerical simulations are done using Finite Element Method. For analysis purpose SAP 2000 is used. It is concluded that though lowest 3 modes of vibration are sufficient for Dynamic analysis, considering five modes would enhance the analysis precision.
NitinBhosale et al (2012) studied influence of host structure characteristics on response of roof top telecommunication tower. They compared the response of a four legged telecommunication tower located at roof top and ground at the same height from the ground. It is concluded that, the response in torsional mode were unaffected by the location of the roof top tower. Analytical results obtained for the same configuration situated at the ground level cannot be used for roof top tower. So by increasing the stiffness of the host structure in both direction the axial forces in the roof top towers were increased by minimal amount.
A. Jesumi et al (2013) investigated optimal bracing system for steel tower. The study has focused on identifying the economical bracing system for a given range of tower height. It is concluded that, Y-bracing is most economical system up to a height of 50m with respect to the joint displacement and weights.
Effect of Wind and Earthquake Loading on
Telecommunication Tower
Vikaskumar Pandey et al (2013) studied influence of telecommunication tower on response of host structure. In this study, the seismic analysis of four legged angled section rooftop telecommunication tower has been studied under the effect of design spectrum from Indian seismic code of practice for Zone III along with wind analysis as per IS 875(part 3)1987.The analysis done in Etabs software. It concludes that, existing building is torsional irregular, the tower placed on the rigid side of host structure shows better performance compared to tower placed on the flexible side. The stresses in member of host structure increased 35%(max)by considering the effect of tower on roof of host structure.
Jithesh Rajasekharan et al (2014) studied
telecommunication towers subjected to seismic and wind loading. In this the displacement due to wind by Gust Factor Method and Seismic effect by modal analysis and response spectrum method at top of the tower for various bracing systems for 30m, 40m, and 50m towers were compared. It is concluded that the joint displacement stress increases as the height of the tower increases and suggested optimum design for various earthquake zones.
In the present study, a detailed analysis has been made on the behaviour of the telecommunication tower subjected to wind and seismic loads with varying the bracing system of towers. Gust factor method is used for wind load analysis. Conducted analytical study on effect of wind on telecommunication towers, for wind speed of 50m/s for four combination of bracing systems; Also studied the effect of earthquake loading on telecommunication towers using Modal analysis and Response Spectrum method, for seismic zones III, IV and V for all the four combination of bracing systems.
III. TOWER SPECIFICATIONS
The tower is a 4- legged square self-supporting lattice tower.The members are treated as truss members. (Only tension and compressive forces in it). The Steel Communication tower is designed for a height of 45 m. The towers are provided with 4-different types of bracings: K type, XBX-type, V-type, W-type, XX-type for lower portion and X-Bracing for upper portion of tower. STAAD Pro. V8i has been used for modelling, analysis of the towers. Details of towers, modelled are given in Table-I.
Table- I: Details of the tower
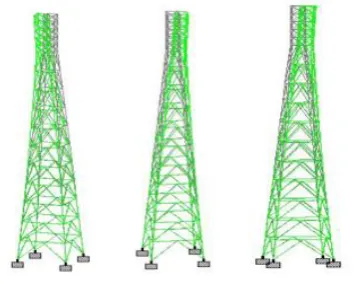
Angle section of size 110 x 110 x 15 mm is used upto 38 m and of size 70 x 70 x 10 mm is used above 38 m for all four bracing systems. Fig. 1 shows the elevation of the four different towers with different types of bracings.
Fig.1. Elevation of towers with K-X, XB-X, W-X, V-X Bracings
IV. ANALYTICAL VERIFICATION
The various loads acting on the tower are self-weight of the lattice tower, load due to antenna, ladder load and platform loads are considered as shown in Table II The wind load is calculated by gust factor method (GFM) as per IS 875 (part 3)-1897. Seismic analysis is carried out by dynamic response spectrum method as per IS 1893- 2002.
Table- II: Antenna Loading for the Tower
Item Quantity
Weight /
antenna
(kg)
Location from
Base (45m)
CDMA 6 20 38
Microwave 1 45 34
Microwave 2 25 34
The additional loading effects due to wind turbulence and dynamic amplification in flexible structure is calculated using gust factor. The gust factor 'G' accounts for the dynamic effects of gust on tower. The values of these gust factors changes with wind speed, decreases with height and increases with increased terrain roughness.
The following design parameters are used for calculating the wind loads as per IS: 875 (Part 3) - 1987:
Basic Wind Speed: 50 m/s, Risk coefficient k1=1.08, Terrain Category: 2, Class: B Topography factor k3=1.0
The basic wind speed given in the code is applicable to 10m height above mean ground level. It is based on peak Gust velocity averaged over a short interval of time about 3 seconds and corresponding to mean height above ground level in an open terrain. Solidity ratio for different panels are calculated in order to account for the open space in the tower lattice Solidity ratio = (Projected area of all the individual elements)/ (Area enclosed by the boundary of the frame normal to the wind direction).
Wind load on a structure on a strip area Aeat any height is given by
Fz= CtAePz G Where,
Details of the tower Dimension in m
Height of Tower 45 m
Height of Slant portion 38 m
Height of Straight portion at the top of a
tower 7 m
Base width 6.5 m
International Journal of Innovative Technology and Exploring Engineering (IJITEE)
ISSN: 2278-3075, Volume-9 Issue-1S, November 2019
Fz= along wind load on the structure at any height z corresponding to strip area
Ae = effective frontal area considered for the structure at height z
Ct = force coefficient for the building,
Ae = effective frontal area considered for the structure at height z
Pz= design pressure at height z due to hourly mean wind obtained as 0.6 Vz2 (N/m2),
G = Gust factor (peak load / mean load)
The load calculation is done for all four bracing systems and Table III gives the load calculation for K-X bracing.
Table- III: Wind load calculation
Panel no.
Height from
Top
Pz cf.Ae Gust
factor G Fz
2 2.8 1199.49 8.67 2.621 27.28
4 5.6 1176.43 8.67 2.644 26.99
6 10.45 1142.25 4.97 2.837 16.11
8 17.35 1080.89 6.18 3.02 20.17
10 24.25 1007.91 7.07 3.27 23.32
12 31.15 909.51 7.86 3.48 24.89
14 38.05 785.39 8.62 3.92 26.54
16 45 785.39 9.39 4.12 30.39
V. NUMERICAL INVESTIGATION
Seismic analysis is a subset of structural analysis and is the calculation of the response of the building structure to earthquake. Seismic analysis is done in two methods: Equivalent static analysis method - simplest method of
analyzing response of a building to earthquake ground motion other than unbalanced building and Dynamic analysis method - shall be performed to obtain the design seismic forces, and its distribution to different levels along the height of the building and to the various lateral loads resisting elements.
Analysis is done using Response Spectrum method (dynamic analysis) as per codal provision IS 1893 (part 1):2002. Response spectrum is a simply a plot of the peak or steady state response (displacement, acceleration or velocity)of a series of oscillators of varying natural frequency that are forced into motion by the same base vibration or shock.
A mode shape is a specific pattern of vibration executed by a mechanical system at a specific frequency. Different mode shapes will be associated with different frequencies. In this present study, we have analyzed the stability of the 45m lattice tower in Zone III, Zone IV, Zone V. Load is defined using Response Spectrum method in STAAD Pro. The inputs fed into the software are tabulated in Table IV.
Table- IV: STAAD inputs for Seismic Analysis
Parameters Zone III Zone IV Zone V
Zone Factor 0.16 0.24 0.36
Importance factor 1.5 1.5 1.5
Response
Reduction Factor 4 1 1
X`x`Soil Type Medium Medium Medium
Damping Ratio 0.02 0.02 0.02
The structure is considered as a space truss and the wind load cases and seismic loading are considered separately. The design has been done using the limit state method. In case of seismic analysis, the behaviour of the structure is studied in seismic zone III, zone IV and zone V. In total four numbers of towers are analysed for each zone and the results are tabulated in Table V. The Frequency and time period for various bracings under study for all the seismic zones are tabulated in Table VI
Table- V: Seismic effect on Tower
Parameter Zone Bracing
K-X XB-X W V
Displacement (mm)
III 22.386 21.009 32.425 25.28
IV 19.731 31.553 48.443 37.68
V 29.378 46.854 71.983 63.41
Base Shear (kN)
III 9.65 11 17.4 15.18
IV 14.47 16.5 26.1 22.77
V 21.54 24.56 38.86 38.45
Compressive Force (kN)
III 119.98 117.517 191.648 170.8
IV 70.946 134.967 231.84 209.9
V 70.946 163.577 290.76 267.0
Tensile Force (kN)
III 4.23 6.349 36.048 5.997
IV 1.556 7.724 42.321 9.456
V 1.556 23.241 75.236 56.85
Compressive Stress(N/mm2)
III 44.915 46.899 97.995 73.59
IV 28.445 57.904 119.447 86.87
V 28.445 69.56 120.34 114.0
Tensile Stress(N/mm2)
III 17.246 16.564 50.775 17.04
IV 16.509 17.017 52.108 21.59
V 16.509 17.709 56.0 41.67
Table- VI: Modes shapes of the tower Types of
Zones
Types of bracings
Mode shapes
Modes Frequency (HZ) Period (secs)
III, IV,V K-X
1 2.121 0.471
2 2.122 0.471
3 6.857 0.146
4 7.400 0.135
5 7.405 0.135
6 8.045 0.124
III,IV,V XB-X
1 1.968 0.501
2 1.998 0.501
3 7.383 0.135
4 7.383 0.135
5 8.212 0.122
III,IV,V W-X
1 1.794 0.557
2 1.794 0.557
3 7.091 0.141
4 7.095 0.141
5 9.518 0.105
6 9.640 0.104
III,IV,V V-X
1 1.869 0.535
2 1.869 0.535
3 6.481 0.154
4 6.481 0.154
5 6.791 0.147
6 8.415 0.119
[image:4.595.47.290.48.176.2]In case of wind analysis, the stability of the various towers subjected to 50 m/s basic wind speed is analysed and the results are tabulated in Table VII.
Table- VII: Wind load effect on Tower
Bracings K-X XB-X W-X V-X
Displacement (mm) 776.06 1083.7 783.76 751.987
Tensile stress(N/mm2) 494 869 590 646
Compressive
Stress(N/mm2) 495 866 589 645
Tensile Force(kN) 1463 2133 1606 1506.65
Compressive
Force(kN) 1463.17 2125 1604.89 1506.60
VI. RESULTS AND DISCUSSION
For Seismic analysis, displacement at top of towers, base shear, member forces and stress values obtained for various bracing are plotted in form of the graph for comparision.
A. Displacement at Top of the Tower - Seismic
Fig.2. shows the displaced shape of the tower with K-X bracing in zone III, zone IV and zone V.
Fig. 2. Displaced tower of K-X bracing in Zone III, Zone IV, Zone V
Fig.3. shows the comparative displacement values of all the bracings at various seismic zones are presented.
Fig. 3 Displacement vs bracing
It can be observed that, for seismic Zone III, the displacement for XB-X is found to be less, compared to all other bracings. The deflection at the top is 6.15%, 16.89% and 35.20% more for K-X bracings, V-X bracings and W-X bracing respectively compared to XB-X bracing. Whereas in zone IV and zone V the displacement for K-X bracing is less compared to rest of the bracings. There is an increase in displacement at top of tower by 37.47%, 50% and 59% for XB-X, V-X and W-X bracing with respect to K-X bracing.
B. Base shear - Seismic
[image:4.595.45.284.230.342.2]The base shear obtained from the Response Spectrum Analysis for various bracing system at different seismic zone is given in Fig.4.
Fig. 4 Base shear vs bracing
The graph shows the base shear pattern for 4 different bracings with respect to different zones of earthquake. It can be observed from the graph that K-X bracing have the minimum base shear values. The Base shear increases by 12.3%, 36%, and 44.5%. For XB-X,V-X,W-X Bracing respectively in all three seismic zones.
C. Member forces - Seismic
[image:4.595.321.534.269.399.2]The comparative maximum compressive force and maximum tensile force developed in the tower for various bracings and at different zones are presented in Fig.5. and Fig.6. respectively.
[image:4.595.85.264.454.596.2] [image:4.595.325.538.580.705.2] [image:4.595.65.271.669.796.2]International Journal of Innovative Technology and Exploring Engineering (IJITEE)
ISSN: 2278-3075, Volume-9 Issue-1S, November 2019
Fig. 6. Tensile force vs bracing
It can be observed that the member forces in leg members are maximum, in all the seismic zones. In all the Seismic zones K-X bracing is found to have less member force compared to other bracing system. The compressive force in leg member of the tower in zone III for XB-X, W-X, V-X, bracing increases by 2.056%, 38.68%, 31.23% respectively when compared with K-X bracing. Likewise, the compressive force in K-X bracing in zone IV decreases by 47.43%, 69.39%, 66.2% for XB-X, W-X, V-X bracings respectively and the compressive force in K-X bracing in zone V is less by 56.62%, 75.51%, 73.44% for XB-X, W-X, V-X bracings respectively. The tensile force in leg member of the tower in zone III for XB-X, W-X, V-X, bracing increases by 30.37%, 88.26%, 29.46% respectively when compared with K-X bracing. Likewise, the tensile force in K-X bracing in zone IV decreases by 79.85%, 96.32%, 83.54% for XB-X, W-X, V-X bracings respectively and the tensile force in K-X bracing in zone V isless by 93.3%, 97.93%, 97.26% for XB-X, W-X, V-X bracings respectively
D. Axial stresses - Seismic
[image:5.595.74.279.56.185.2]The comparative maximum compressive stress and maximum tensile stress developed in the tower for various bracings and at different zones are presented in Fig.7. and Fig.8. respectively.
Fig. 7. Compressive stress vs bracing
Fig. 8. Tensile stress vs bracing
The Compressive stress of X-B bracing of the tower located in zone III is less than that of XB-X, W-X, V-X bracings by 4.23%, 54.17%, 38.97% respectively. Similarly, the compressive stress of K-X bracing located in zone IV and zone V is decreased by considerable percentage in case of XB-X, W-X, V-X bracing. The tensile stress of X-B bracing of the tower located in zone III is less than that of B-X, W-X, V-X bracings by 4.11%, 66%, 66.44% respectively. Similarly, the tensile stress of K-X bracing located in zone IV and zone V is decreased by considerable percentage in case of XB-X, W-X, V-X bracing.
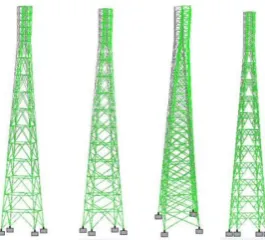
[image:5.595.358.491.279.399.2]For Wind load analysis, displacement at top of towers, stresses and member forcevalues obtained for various bracing are plotted in form of the graph.The displaced shape of the tower is shown in Fig.9.
Fig. 9. Displacement due to wind load in K-X, XB-X, W-X, V-X Bracings
E. Displacement at Top of Tower –Wind load
[image:5.595.319.533.489.620.2]The displacement obtained from the wind load analysis is shown in the Fig.10.
Fig.10. Displacement vs bracing
It can be observed that maximum displacement occurs at the top node of the tower at 45m from the ground level. The displacement in the K-X bracing is 39.64% and 1.2% lesser than that of XB-X bracing and W-X bracing respectively but it is 3.2% higher than V-X bracing.
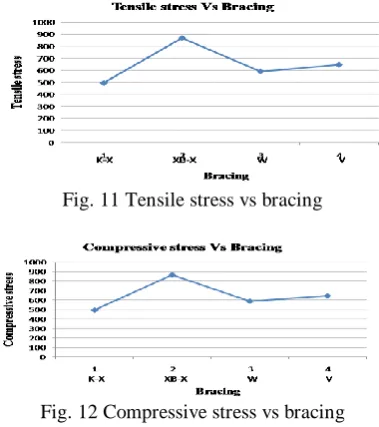
F. Axial stresses – Wind load
The variation of tensile and compressive stresses for the various bracing systems considered are presented in Fig.11. and Fig.12. respectively. The stress in K-X bracing is decreases by 51.56%, 16.27%,
[image:5.595.75.275.520.690.2]o
Fig. 11 Tensile stress vs bracing
Fig. 12 Compressive stress vs bracing
G. Member forces – Wind load
The magnitude of force in members both tensile and compressive in nature are same. From the Fig. 13.and Fig.14.We infer that the forces in the K-X bracing decreases by 41.36%, 8.9%, 2.89% than XB-X, W-X, V-X bracings respectively.
[image:6.595.63.275.364.640.2]Fig. 13 Tensile force vs bracing
Fig. 14. Compressive force vs bracing
VII. CONCLUSION
The effect of Wind and Earthquake on Telecommunication tower with four different types of bracings are studied. The following conclusions can be drawn based on the analysis of results.
1) From the wind analysis, it can be observed that the increase in joint displacement of K-X bracing and W-bracing are almost same and it is 3.2% and 23.38% less compared to V-X bracing and KB-X bracing
respectively.
2) The member force in K-X bracing is found to be minimum and the force increase by 41%, 8.9%, and 2.89% for KB-X, W-X, and V-X bracing respectively compared to K-X bracing.
3) The stress in towers with K-X bracing is found to be less by 51%, 16% and 23.5% for KB-X, W-X and V-X bracing respectively
.
4) In the response spectrum analysis, the joint displacement at tower located in seismic zone III is found to be less for tower with XB-X bracing. The displacements in K-X, W-X and V-X is 6.15%, 35.20% and 16.89% more than XB-X bracing system. Also taking member forces and stress into account, XB-X bracing proves to be optimum compared to other bracing system.
5) In seismic zone IV and zone V, the joint displacement of K-X bracing is 37%,59%and 47% less compared to XB-X,W-X and V-X respectively. Also stresses developed in towers with K-X bracing is less compared to towers with other bracing systems.
From the analysis it is clearly seen that the wind effects are critical for tower design and it is suggested to adopt K-X bracing system.
REFERENCES
1. JitheshRajasekharan,” Analysis of Telecommunication Tower Subjected To Seismic And Wind Loading” published on international journal of advancement in engineering technology, management and applied science,2 July 2014.
2. NitinBhosale et al, “Influence of Host Structure Characterstics On Response Of Rooftop Telecommunication Tower” published on international journal of civil and structural engineering, volume 2,no 3,2012.
3. Ghodrati Amiri et al,”Seismic Behaviour of 4-Legged Self Supporting Telecommunication Tower” published on 13th
world conference on earthquake engineering, August 2004.
4. A.Jesumi et al, “Optimal Bracing System For Steel Towers” published on international journal of engineering research and applications, March-April 2013.
5. IS 875-1987(Part 3):Code Of Practice For Design Loads For Buildings
And Structures wind loads
6. IS 1893-2002:Criteria For Earthquake Resistant Design Of Structures.
AUTHORS PROFILE
P.Joyson Silva is Assistant Professor, Department of Civil Engineering, R.M.K. Engineering College. He has obtained his B.E. Civil Engineering from PSNA College of Engineering & Technology, Dindigul, and M.Tech
Structural Engineering from
NIT Trichy and currently pursuing his Ph.D program at Anna University, Chennai. He has published papers in international and National Journals. He is a life time member of professional societies ISTE and ICI.
International Journal of Innovative Technology and Exploring Engineering (IJITEE)
ISSN: 2278-3075, Volume-9 Issue-1S, November 2019
Dr. Binu Sukumar has more than 28 years of teaching and industrial experience. She has obtained her B.Tech in Civil Engineering, from Govt. College of Engineering, Trivandrum, Kerala University, M.Tech in Structural Engineering from Indian Institute of Technology, Madras and PhD from the faculty of Civil Engineering, Anna University, Chennai. She has authored many textbooks and journals. She is acting as member of Editorial Board for International Journals, reviewer for many International Journals published by Elsevier and Springer publishers and reviewer for many text books. She is a Recognized Research Supervisor of Anna University. She is a fellow of Institution of Engineers (I) and life member of various professional societies like Indian Society for Technical Education (ISTE) and Indian Concrete Institute (ICI).