InTrans Project Reports Institute for Transportation
6-2005
An Investigation of User Costs and Benefits of
Winter Road Closures
Thomas H. Maze Iowa State University
Michael R. Crum
Iowa State University, mcrum@iastate.edu
Garrett Burchett Iowa State University
Follow this and additional works at:http://lib.dr.iastate.edu/intrans_reports
Part of theCivil Engineering Commons, and theOperations and Supply Chain Management Commons
This Report is brought to you for free and open access by the Institute for Transportation at Iowa State University Digital Repository. It has been accepted for inclusion in InTrans Project Reports by an authorized administrator of Iowa State University Digital Repository. For more information, please contactdigirep@iastate.edu.
Recommended Citation
Maze, Thomas H.; Crum, Michael R.; and Burchett, Garrett, "An Investigation of User Costs and Benefits of Winter Road Closures" (2005).InTrans Project Reports. 21.
An Investigation of User Costs and Benefits of Winter Road Closures
Abstract
This project explores the user costs and benefits of winter road closures. Severe winter weather makes travel unsafe and dramatically increases crash rates. When conditions become unsafe due to winter weather, road closures should allow users to avoid crash costs and eliminate costs associated with rescuing stranded motorists. Therefore, the benefits of road closures are the avoided safety costs. The costs of road closures are the delays that are imposed on motorists and motor carriers who would have made the trip had the road not been closed. This project investigated the costs and benefits of road closures and found that evaluating the benefits and costs is not as simple as it appears.
To better understand the costs and benefits of road closures, the project investigates the literature, conducts interviews with shippers and motor carriers, and conducts case studies of road closures to determine what actually occurred on roadways during closures. The project also estimates a statistical model that relates weather severity to crash rates. Although, the statistical model is intended to illustrate the possibility to quantitatively relate measurable and predictable weather conditions to the safety performance of a roadway. In the future, weather conditions such as snow fall intensity, visibility, etc., can be used to make objective
measures of the safety performance of a roadway rather than relying on subjective evaluations of field staff.
The review of the literature and the interviews clearly illustrate that not all delays (increased travel time) are valued the same. Expected delays (routine delays) are valued at the generalized costs (value of the driver’s time, fuel, insurance, wear and tear on the vehicle, etc.), but unexpected delays are valued much higher because they result in interruption of synchronous activities at the trip’s destination. To reduce the costs of delays resulting from road closures, public agencies should communicate as early as possible the likelihood of a road closure.
Keywords
Civil Construction and Environmental Engineering, Supply Chain and Information Management, MTC, user delay costs, winter road closures, winter road safety
Disciplines
Iowa State University ~ University of Missouri-Columbia ~ Lincoln University
University of Missouri-Kansas City ~ University of Missouri-St. Louis ~ University of Northern Iowa
An Investigation
of User Costs and
Benefits of Winter
Road Closures
Final Report—June 2005
Sponsored by
University Transportation Centers Program, U.S. Department of Transportation
(MTC Project 2003-01)
Disclaimer Notice
The contents of this report reflect the views of the authors, who are responsible for the facts and the accuracy of the information presented herein. This document is disseminated under the spon-sorship of the U.S. Department of Transportation in the interest of information exchange. The U.S. Government assumes no liability for the contents or use of the information contained in this document. This report does not constitute a standard, specification, or regulation.
The U.S. Government does not endorse products or manufacturers. Trademarks or manufactur-ers’ names appear in this report only because they are considered essential to the objective of the document.
About the MTC/CTRE
Technical Report Documentation Page 1. Report No.
MTC Project 2003-01
2. Government Accession No. 3. Recipient’s Catalog No. 4. Title and Subtitle
An Investigation of User Costs and Benefits of Winter Road Closures
5. Report Date
June 2005
6. Performing Organization Code 7. Author(s)
Thomas H. Maze, Michael R. Crum, and Garrett Burchett
8. Performing Organization Report No. 9. Performing Organization Name and Address
Midwest Transportation Consortium 2901 South Loop Drive, Suite 3100 Ames, IA 50010-8634
10. Work Unit No. (TRAIS) 11. Contract or Grant No. 12. Sponsoring Organization Name and Address
U.S. Department of Transportation
Research and Special Programs Administration 400 7th Street SW
Washington, DC 20590-0001
13. Type of Report and Period Covered
Final Report
14. Sponsoring Agency Code
15. Supplementary Notes
Visit www.ctre.iastate.edu for color PDF files of this and other research reports.
16. Abstract
This project explores the user costs and benefits of winter road closures. Severe winter weather makes travel unsafe and dramatically increases crash rates. When conditions become unsafe due to winter weather, road closures should allow users to avoid crash costs and eliminate costs associated with rescuing stranded motorists. Therefore, the benefits of road closures are the avoided safety costs. The costs of road closures are the delays that are imposed on motorists and motor carriers who would have made the trip had the road not been closed. This project investigated the costs and benefits of road closures and found that evaluating the benefits and costs is not as simple as it appears.
To better understand the costs and benefits of road closures, the project investigates the literature, conducts interviews with shippers and motor carriers, and conducts case studies of road closures to determine what actually occurred on roadways during closures. The project also estimates a statistical model that relates weather severity to crash rates. Although, the statistical model is intended to illustrate the possibility to quantitatively relate measurable and predictable weather conditions to the safety performance of a roadway. In the future, weather conditions such as snow fall intensity, visibility, etc., can be used to make objective measures of the safety performance of a roadway rather than relying on subjective evaluations of field staff.
The review of the literature and the interviews clearly illustrate that not all delays (increased travel time) are valued the same. Expected delays (routine delays) are valued at the generalized costs (value of the driver’s time, fuel, insurance, wear and tear on the vehicle, etc.), but unexpected delays are valued much higher because they result in interruption of synchronous activities at the trip’s destination. To reduce the costs of delays resulting from road closures, public agencies should communicate as early as possible the likelihood of a road closure.
17. Key Words
user delay costs—winter road closures—winter road safety
18. Distribution Statement
No restrictions.
19. Security Classification (of this report)
Unclassified.
20. Security Classification (of this page)
Unclassified.
21. No. of Pages
75
22. Price
NA
A
N
I
NVESTIGATION OF
U
SER
C
OSTS AND
B
ENEFITS OF
W
INTER
R
OAD
C
LOSURES
Final Report
June 2005
Principal Investigator Thomas H. Maze
Professor, Department of Civil, Construction and Environmental Engineering Iowa State University
Faculty Associate
Michael R. Crum
John and Ruth DeVries Chair in Business Professor of Transportation and Logistics
Iowa State University
Research Assistant
Garrett Burchett
Center for Transportation Research and Education, Iowa State University
Preparation of this report was financed in part
through funds provided by the U.S. Department of Transportation through the Midwest Transportation Consortium, Project 2003-01.
Project administered by
Midwest Transportation Consortium
2901 South Loop Drive, Suite 3100 Ames, IA 50010-8634
TABLE OF CONTENTS
ACKNOWLEDGMENTS ... IX
EXECUTIVE SUMMARY ... XI
1. INTRODUCTION ... 1
Background... 2
Safety Risks of Winter Weather ... 5
Report Organization... 7
2. LITERATURE REVIEW ... 9
Studies That Document the Cost of Winter Maintenance ... 9
Road User Costs Due to Road Closures ... 12
Cost of Traveler Delays ... 13
Cost to Freight Transportation Delays... 15
Literature Review Conclusions... 17
3. CARRIER AND SHIPPER/RECEIVER INTERVIEWS ... 19
Trucking Company Interviews ... 19
Company A ... 19
Company B ... 21
Company C ... 22
Company D ... 24
Company E... 25
Company F... 26
Summary and Conclusions ... 27
4. CLOSURE CASE STUDIES... 30
Iowa Closure Experience ... 31
Iowa Road Closure Dates... 34
Iowa 12/16/2000 ... 34
Iowa 2/9/2001 ... 36
Iowa 2/25/2001 ... 38
Iowa 3/9/2002 ... 40
Iowa Data Conclusions ... 42
Minnesota Closure Experience ... 43
Minnesota 12/16/2000 ... 45
Minnesota 2/24/2001 ... 46
Comparison of Iowa to Minnesota Closure Experience ... 48
Truck Traffic Analysis... 48
Conclusions... 50
5. MODELING SAFETY IMPACTS OF WINTER WEATHER... 51
Analysis ... 52
Implications of the Analysis and Conclusions... 54
6. CONCLUSIONS AND RECOMMENDATIONS ... 55
Conclusions... 55
Recommendations... 56
APPENDIX... 59
LIST OF FIGURES
Figure 1.1. Iowa entrance ramp gates ...2
Figure 1.2. Left Iowa ramp gate...2
Figure 1.3. Minnesota entrance ramp gate...3
Figure 1.4. Minnesota flip-down ramp closure sign ...3
Figure 1.5. Minnesota mainline gate closure ...3
Figure 1.6. State transportation agencies interviewed ...4
Figure 2.1. Relative cost of a delay...17
Figure 4.1. Gates on entrance ramp to I-35 ...31
Figure 4.2. Left-side swing gate on entrance to I-35 ...31
Figure 4.3. Location of ATRs in Iowa from Ames to the Minnesota border used in study (23)...33
Figure 4.4. I-90 gate locations (25)...43
Figure 4.5. Minnesota mainline gate...44
Figure 4.6. Minnesota ramp gate ...44
Figure 4.7. Minnesota sign warning motorists of fine ...44
Figure 4.8. Commercial truck traffic as a percentage of the total hourly volume ...50
LIST OF TABLES
Table 1.1. Comparison of winter weather-related crashes to all crashes, 1996–2000...6
Table 4.1. Percentage of traffic during road closure event on 12/16/2000...34
Table 4.2. Crash data during road closure event and control day...36
Table 4.3. Percentage of traffic during road closure event on 2/9/2001...37
Table 4.4. Crash data during road closure event and control day...38
Table 4.5. Percentage of traffic during road closure event on 2/25/2001...39
Table 4.6. Crash data during road closure event and control day...40
Table 4.7. Percentage of traffic during road closure event on 3/9/2002...41
Table 4.8. Crash data during road closure event and control day...42
Table 4.9. Percentage of traffic during road closure event on 12/16/2000...46
Table 4.10. Percentage of traffic during road closure event on 2/24/2001...47
Table 4.11. Crash data during road closure event on 2/24/2001 ...48
Table 4.12. Percentage of total hourly traffic volume consisting of commercial trucks ...49
ACKNOWLEDGMENTS
The authors would like to thank the Iowa and Minnesota Departments of Transportation for their assistance with data and advice. We would also like to thank the shipper and motor carrier representatives that were interviewed. We appreciate their assistance and candor. We also want to thank the members of our project advisory committee:
Dennis Burkheimer (Committee Chair) Winter Operations Administrator Iowa Department of Transportation
Mark Black
District 2 Maintenance Manager Iowa Department of Transportation
Chad Claude
Director of Distribution Jennie-O Turkey Store, Inc Wilmar, Minnesota
Steve (Rocky) Haider
Maintenance Business Planning Administrator Minnesota Department of Transportation
Mike Krohn
District 1 Maintenance Manager Iowa Department of Transportation
Robert M. Sturgeon, President Barr-Nunn Transportation, Inc. Granger, Iowa
Thomas O. Zimmerman, Superintendent District 7 West Operations
Minnesota Department of Transportation
EXECUTIVE SUMMARY
Although mountainous states have historically closed roads when severe winter weather makes roads unsafe, in the last twenty years, non-mountainous, Snow Belt states have developed road closure policies. Some of these Snow Belt states have also gated entrances to freeways when travel is believed to be unsafe. A survey of the majority of Snow Belt states revealed that some have no policy for closing roads due to winter weather, but those states with weather closure policies generally base decisions to close roads on the subjective evaluations of field personnel who feel that the roadway is no longer safe for travel. Although field personnel may have an excellent understanding of the safety performance of the roadway under current conditions, it places travelers in the position of not knowing whether the road will be closed until unsafe conditions are observed, resulting in unexpected delays.
Severe winter weather makes travel unsafe and dramatically increases crash rates. When conditions become unsafe due to winter weather, road closures should allow users to avoid crash costs and eliminate costs associated with rescuing stranded motorists. Therefore, the benefits of road closures are the avoided safety costs. The costs of road closures are the delays that are imposed on motorists and motor carriers who would have made the trip had the road not been closed. This project investigated the costs and benefits of road closures and found that evaluating the benefits and costs is not as simple as it appears.
To better understand the costs and benefits of road closures, this project investigates the literature, conducts interviews with shippers and motor carriers, and conducts case studies of road closures to determine what actually occurred on closed roadways before and during closures. The project also estimates a statistical model that relates weather severity to crash rates. Although the statistical model is intended to illustrate the
possibility of quantitatively relating measurable and predictable weather conditions to the safety performance of a roadway, use of this type of statistical model will allow weather conditions (such as snow fall intensity and visibility) to be used to make objective measures of the safety performance of a roadway in the future.
The literature review and interviews illustrate that not all delays (increased travel time) are valued equally. Expected delays (routine delays) are valued at the generalized costs (value of the driver’s time, fuel, insurance, wear and tear on the vehicle, etc.), but unexpected delays are valued much higher because they result in interruption of synchronous activities at the trip’s destination. To reduce the costs of delays resulting from road closures, public agencies should communicate as early as possible the
likelihood of a road closure. Much to the surprise of the research team, the motor carriers interviewed would appreciate having early notification of likely road closures and
This report makes several specific recommendations to State Transportation Agencies (STA) responsible for winter weather-related road closure decisions and specifically to the Iowa Department of Transportation:
1. STAs and State Police need to accurately communicate road conditions and the likelihood of future weather resulting in conditions that may lead to a closure. Information provided to the public regarding road conditions needs to be completely accurate to maintain credibility with the public.
2. The importance of travel time reliability is not very well understood and further research is needed. Understanding the value of reliable travel time can help to place a value on the benefits derived from winter maintenance. Therefore, it is recommended that the winter maintenance community should become engaged in and support research efforts to better understand the value of travel time
reliability.
3. Further work is needed to relate safety performance to measurable and predictable weather parameters. These relationships can help highway managers to make closure decisions based on objective information.
4. The Iowa Department of Transportation and the Iowa State Patrol should develop policies to more aggressively evacuate and close roadways once a closure
1. INTRODUCTION
This report investigates issues related to the costs and benefits of road closure due to winter storms. In Iowa and Minnesota and in other states in the region, state
transportation agencies (STAs) have started erecting gates to physically close sections of rural freeways during severe winter storms. The purpose of these closures is to keep vehicles off the interstate because the roadway is deemed unsafe and to keep motorists from being stranded if they do become stuck in a remote location. At least in Iowa and Minnesota, these gates are used very sparingly, and both states have closed and gated freeway segments a few times per year.
Road closures have been implemented without any analysis of the benefits and costs or examination of the unintended consequences of a road closure. For example, as a result of a freeway closure, some drivers will divert to lower functional class roadways (e.g., two-lane roads) to continue their trip. These roadways have lower design standards and poor safety performance. Thus, traffic diverted to other routes is at greater risk than if they had continued on the freeway, given that both are exposed to the same severe weather
conditions. The purpose of the research reported here is to examine the benefits and costs of winter weather road closure and develop a framework for their analysis.
Initially, our team of researchers believed that we could develop a methodology to evaluate the benefits and costs of road closures. However, we discovered that the
problem is more complex than it initially appeared. Although this report provides insights into the costs and benefits of road closure through case studies, it does not provide a methodology that can be used to determine under what conditions a road should be closed. The benefit side of the analysis focuses on the safety issues related to road closures and is covered in sufficient detail. However, the cost of a road closure is much more complex as it is concerned with the value of travel time and the value of travel time reliability.
Issues of travel times and travel time reliability due to severe weather will be addressed by projects identified in the Future Strategic Highway Research Program (F-SHRP) plan for research in transportation system reliability. A plan for F-SHRP was requested by the U.S. Congress in the last Federal Transportation Authorization bill and subsequently developed by the Transportation Research Board (TRB). Currently, the TRB is waiting for Congress to authorize the necessary funds in the next Federal Transportation Authorization bill. The F-SHRP plan developed by TRB identified four research
Background
Many of the mountainous states have always had policies that allow road closures and restrictions when winter weather conditions make roadways impassible. However, STAs in non-mountainous states have not had a heritage of road closures. All states have the authority to declare an emergency and close a roadway for public safety purposes, but it was not until the 1980s and 1990s that several Midwestern states began adopting policies and procedures for the systematic closure of roads due to snow and ice. For example, in the early 1980s, South Dakota adopted policies for roadway closures and began erecting gates to physically close roads (2). In the mid-1990s, Iowa and Minnesota adopted similar policies and erected gates on the entrances to specific freeway routes to prevent motorists from becoming stranded or operating vehicles on unsafe, slippery roads.
A typical ramp closure gate used by the Iowa Department of Transportation (Iowa DOT) is shown in Figures 1.1 and 1.2. This is a simple fence gate that must be manually closed by Iowa DOT maintenance personnel on I-35 north of Ames. This gate is located on the northbound entrance ramp of I-35 at an interchange with Hamilton County Road D20.
[image:15.612.90.309.330.493.2]Swinging Gate
Figure 1.1. Iowa entrance ramp gates Figure 1.2. Left Iowa ramp gate
[image:15.612.326.546.331.492.2]Gate
[image:16.612.88.527.82.244.2]Ramp Closed Sign
Figure 1.3. Minnesota entrance ramp Figure 1.4. Minnesota flip-down ramp
gate closure sign
Minnesota fines gate violators, while Iowa does not have any specific legal sanction for gate violators. Figure 1.5 shows a mainline gate that can be used to barricade the mainline. This picture was taken on westbound I-90 immediately after the exit ramp to southbound I-35, north east of Albert Lea, Minnesota.
I-90 Mainline Mainline Gate
[image:16.612.202.416.416.579.2]Ramp to SB I-35
Figure 1.5. Minnesota mainline gate closure
In Iowa, the decision to close a roadway due to winter weather is usually made by the officer-in-charge at the respective Iowa State Highway patrol district office in
states seek field data upon which to base their decisions, the decision is still subjective and based on their experience and judgment.
As part of the project, we conducted a survey of 28 Snow Belt states to determine what their policies were regarding road closures and to seek methods that are more objective. The state transportation agencies (STAs) we interviewed are shaded on the map shown in Figure 1.6.
[image:17.612.98.557.304.503.2]Six STAs—some of them in states that experience very heavy snowfalls during the winter—told us they never close roadways. Unless the governor declares a state of emergency, their policy is to keep roads open, and the public is free to drive at their own discretion. The remaining states have policies allowing road closures for safety purposes (including winter weather–related road conditions). Most of them have specific policies defining when to close roads and the process that should be taken during winter weather conditions.
Figure 1.6. State transportation agencies interviewed
Although our contacts were at STAs, six stated that in practice, the state police (highway patrol) determines when a roadway is no longer safe due to snow and ice and should be closed, and then the state police coordinates with the STA to implement the road closure and re-opening procedures. In seven states, the STA makes the decision to close a road and then coordinates the closure with the state police. In nine states, it is a joint decision between the STA and the state police. For example, Maryland has a joint statewide operations center that decides when to close roadways for weather-related situations.
would trigger a road closure: when winds reach 45 mile per hour, visibility is reduced to the point where closures are warranted.
Without measurable and objective criteria to determine when a roadway is unsafe, inconsistent decisions are made and the likelihood of a roadway reaching a condition warranting closure cannot be predicted. Road users can clearly determine when weather is severe, but they are given no or minimal advanced warning of a road closure.
Safety Risks of Winter Weather
One of the overwhelming findings of this research is that snowy and icy roadways create conditions that are far more hazardous than we had thought. Typically, in the upper Midwest, we tend to think of brutal winter weather and slippery driving conditions as part of life in the Snow Belt. The average Midwesterner has experienced severe winter
weather and recognizes the need to drive more cautiously during snowy and icy
conditions. Regardless of the winter driving skill of Midwestern drivers, historical Iowa crash records show that crash rates on interstate highways increase by 13 times during common snowstorms (storms where more than 0.2 inches of snow fall per hour), putting the average driver at roughly 13 times greater risk of being in a crash (4). In extreme winter events (low visibility and blowing snow), the risk of being in a crash can be 20–30 times greater than during clear conditions.
To put this in perspective, Compton et al. studied the relative risk of being in a crash at varying blood alcohol content (BAC) and found that the risk of having a crash was elevated by 2.69 times when the driver had a BAC of 0.08 (the legal limit in most states), by 4.79 times when the driver had a BAC of 0.10 (the legal limit in most states prior to 1998), and by 13 times when the driver had a BAC of 0.13 (5, p. 42). Admittedly, this comparison must be qualified. Compton et al. conducted their study in urban areas and, although the authors do not mention the location of their samples, the majority of BAC involved crashes were on city streets. Our information for elevated winter crash rates is for rural interstate highways—the lowest crash risk highways. However, if all things remain equal, driving in a snowstorm elevates your risk of a crash far more than driving legally impaired. Although the crash risk is the same, we tend to treat driving in wintry weather as an unavoidable consequence of living in the Snow Belt, while we treat driving alcohol impaired as a civil and sometimes a criminal offence. The tolerance of drivers in unsafe wintry conditions suggests that drivers and policy makers really don’t understand the risk of winter driving.
year, on the average, snow impacts traffic for about 450 hours per year, or around 5% of the year.
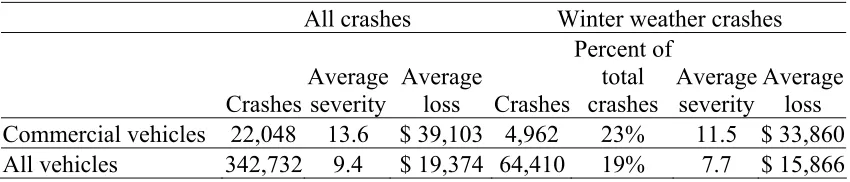
Table 1.1 shows a summary of 5 years of Iowa crash records for crashes on all Iowa public roads. The table compares the number of crashes, the severity of crashes, and economic losses due to crashes during the entire 5-year period to periods of the same years when winter weather condition existed. Winter weather-related crashes are considered to be those where the reporting officer noted the surface conditions as ice or snow covered or the weather conditions were snow or sleet. Over the 5-year period (1996–2000), 19% of all crashes occurred during winter weather. Therefore, 19% of the crashes took place during snowy and icy conditions that only existed 5% of the time. To further emphasize the relative hazards of winter weather, we also know that during winter storms, traffic volumes subside while prudent drivers postpone trips to other times or cancel trips. The percentage of commercial vehicle crashes that occur during winter weather (23%) is higher than the average, which is partly because trucks are less likely to differ their travel during winter weather, as we will see in the analysis portion of this report.
[image:19.612.94.519.539.630.2]The severity of crashes decreases during winter weather. Traffic is traveling at slower speeds and, as a result, crashes become less severe than they would be under clear conditions. To some extent, the reduction in severity counteracts the increase in crash frequency during winter storms to minimize the overall severity of winter weather related crashes. In Table 1.1, we have calculated the average severity of crashes and winter weather-related crashes using the Iowa DOT’s crash severity index (fatality = 200, major injury = 100, minor injury = 10, and possible injury and PDO = 1), and the average severity is reduced by only 18% during winter weather (from 9.4 to 7.7 average severity per crash). Similarly, we have calculated the average economic loss per crash using the Iowa DOT’s loss values (fatal = $1,000,000, major injury = $150,000, minor injury = $10,000, possible injury = $2,500, and PDO = reported value), and the average economic loss is also reduced by 18% ($19,374 to $15,866 average loss per crash). The modest reduction in crash severity is hardly a compensation for the increased crash frequency.
Table 1.1. Comparison of winter weather-related crashes to all crashes, 1996–2000
All crashes Winter weather crashes Percent of
Commercial vehicles
Crashes Average severity Average loss Crashes 22,048 13.6 $ 39,103 4,962
total crashes
23%
Average
severity Average loss 11.5 $ 33,860 All vehicles 342,732 9.4 $ 19,374 64,410 19% 7.7 $ 15,866
costs in an engineering economic evaluation of a highway improvement. The economic analysis of a highway improvement calculates the travel time savings associated with the improvement. Conversely, a road closure would simply make travel time longer. We could simply apply the same costs coefficient to determine the cost of making a trip longer. However, a road closure cannot be treated so simply, and the road closure problem has many more dimensions. They include the following:
Depending on the weather conditions (snow fall intensity, wind speed, visibility, temperature, etc.), some drivers decide to avoid winter weather driving risks and many trips will be postponed and/or cancelled. Given that trips would have been cancelled due to weather, independent of a road closure, the loss of these trips can hardly be defined as a cost due to the road closure.
There may be synchronous activities that are dependent on a freight delivery and, when a freight shipment is delayed, activities at the destination may be impacted. Delaying crews or assembly lines due to a failure to make a delivery on time may result in a cost penalty far greater than the shipment itself.
Regardless of whether the road is closed, some freight shipments and some travelers will continue using the route or parallel routes. For example, even though road closures on I-35 north of Ames are implemented with positioning a gate across entrance ramps, the Automatic Traffic Recorders (ATRs) on I-35 almost never recorded fewer than 20 vehicles per hour and typically there were volume of 50 to 150 vehicles per hour even though the roadway was closed.
Without doing extensive analysis of traveler tolerance of winter weather driving risks and the dependence of activities at the receiving location on freight shipments, it is difficult to estimate the costs associated with a road closure. However, it is clear that advanced warning of the potential of a road closure will significantly reduce the associated costs. With advanced warning, travelers can adjust their schedules to accommodate the road closure and shippers and receivers can adjust the schedule of synchronous activities.
Report Organization
This report is organized into six chapters:
Chapter 1: Establishment of the complexity inherent to understanding the benefits and costs of road closure and identifying the issues associated with road closures.
Chapter 2: Review of available literature. Although there is currently little literature that addresses road closures due to winter weather, there are analogous situations that can help illustrate the issues related to closures.
Chapter 4: Discussion of case studies of actual closures of I-35 in Iowa and I-90 in Minnesota.
Chapter 5: Discussion of development of a statistical model that relates weather conditions to crash rates on I-35 in northern Iowa. Although this model is just a
prototype, it provides a framework for the development of a model which could be used to correlate related or actual weather conditions to the expected safety (as measured by crashes) of a roadway, thereby providing an agency with objective and predictable measures for determining whether a roadway is unsafe and a closure is necessary.
2. LITERATURE REVIEW
The following chapter documents some of the relevant literature related to winter weather road closures. The only literature we found regarding winter road closure were
documents produced by State Transportation Agencies (STAs) that document their processes and procedures for closing roads, but not the benefits and costs of road closures.
This chapter is divided into five sections:
A discussion of studies that document the benefits and costs of winter maintenance
A discussion of road user costs due to road closures in an attempt to put the discussion of road user costs into the context of the road closure issue.
Costs of delay to travelers
Costs of delay to freight shipments
Conclusions
Studies That Document the Cost of Winter Maintenance
Measuring the benefits of snow and ice removal is much like the measurement of any other road user benefit. The direct benefits are those that are accrued by the user and indirect benefits are those that are accrued as a result of the direct benefits. A fairly common transportation example of direct benefits and indirect benefits is the relationship between new or improved transportation facilities and property values. When a new or improved roadway provides better access to land, travel costs for accessing the land decrease and property values increase. In this example, the primary benefits are the reduced road user costs and the secondary benefits are increased property values. The benefits of the road can either be measured through the primary benefits or secondary benefits, but not both. To count both would be inappropriate and is known as “double counting.”
Typically, the primary benefits of snow and ice removal include improved safety, reduced travel time, and improved travel time reliabilities. A few studies have tried to evaluate the benefits through secondary effects. For example, Igarashi attempted to measure the benefits of snow removal and the quality of snow removal based on the variations in property values in Japan (7, 8). In other words, the researchers believed that properties located on or near roadways with a higher level of winter maintenance would have higher market values. Unfortunately, the myriad of characteristics associated with land value makes it very difficult to isolate the impact of the quality of snow removal.
the transportation system of an entire state (9). The study assumes that a storm causes almost all transportation to cease operation for one day. The researchers assume that without snow and ice clearing services during a severe winter storm, all movement of workers from home to work and shoppers to stores would cease. The authors of the report assume that some essential services will continue (such as health care services), but at a reduced level. The authors forecast the income losses, tax revenue losses, retail trade losses, and the ripple effect of those losses from such a storm. The Salt Institute study provides estimates for Iowa and eleven other states and two Canadian provinces. In Iowa, for example, the authors estimate that the cost of statewide shutdown would cost about $60 million per day. The authors note that with a state the size of Iowa, such a statewide shut-down is extremely unlikely and that the purpose for the estimate is to provide an order of magnitude estimate of the cost of a major snow storm when “remedial actions” are not undertaken (clearing snow and ice).
These numbers provide a nice estimate of the worst case scenario, but are not indicative of a real-world situation, which the authors acknowledge. In reality, the costs imposed on a state by a severe storm would be some fraction of the Salt Institute estimate because it is unlikely that a storm would cover an entire state and cause a shutdown of all
government offices, schools and university, industries, and businesses.
Most other benefit studies do not assume that traffic ceases completely and instead assume that although traffic continues to move, quality of service declines. For example, Kuemmel and Hanbali studied the benefits of the application of salt to de-ice roadways. Their assumption is that without de-icing salt, travelers will be delayed and roadways will become more hazardous. Kuemmel and Hanbali found that during the first four hours following the application of salt during a winter storm, the direct road user benefits were $6.50 for every $1.00 spent on maintenance operations (10). In addition, crash costs were found to decline by 88% following the application of deicing salt.
Morisugi et.al. measured the benefits of snow removal as function of travel time (11). Their methodology assumes that the quality (and cost) of winter maintenance is a
function of the ability to keep the pavement as close to bare as possible. The authors also assume that the relative speed that a vehicle is able to travel is a function of the amount of snow and ice that covers the pavement, where bare is ideal and not plowing at all creates the worst condition. In other words, the researchers believe the benefit of snow removal is travel time savings (in comparison to the travel time without snow removal) and the cost is the cost of winter maintenance activity.
In developing such a computer program, the researchers’ intentions were to
comprehensively gather the user costs from winter storms. They concluded that winter weather has impacts on several traffic characteristics and they attempted to quantify the impacts of snowy weather on crash rates, user delay, traffic volumes, and vehicle speeds. The computer program was to be developed in five modules. The modules were to be used to estimate the maintenance cost, the traffic and safety costs, environmental costs, and the costs of structural deterioration (bridge corrosion) and vehicle corrosion when achieving a given level of service on the highway.
The researchers calculated the additional delay as the difference between the speeds at the assumed level of winter maintenance service and the normal speed multiplied by the distance traveled. Speed was estimated using data from the member states for varying levels of snow covering the roadway (winter maintenance level of service). This was then multiplied by a cost for comfort and convenience, operating costs to cars and trucks, and the wages lost through tardiness and absenteeism. The only operating costs included were the additional fuel consumed due to the greater wheel resistance from the snow.
Perceived personal discomfort by motorists was assumed to be equal to what they would pay to avoid a delay. The researcher uses a value of willingness to pay derived by another study. What motorists were willing to pay to avoid a delay was multiplied by the delay time to arrive at an estimate of the value of delay. The cost of tardiness (lost wages) was the delay time multiplied by an average wage rate.
The researchers attempted to link crash rates to level of service but the analysis failed because there were not sufficient data to perform the analysis. For this reason, crash costs were not included in the final economic analysis. Also not included in the economic analysis were environmental costs, structural deterioration, and corrosion, since these costs were hard to evaluate on a storm-by-storm basis as they are the result of long-term application of deicing chemicals.
All the models provide input to arrive at incremental benefits and incremental costs of increasing levels of winter maintenance. The incremental benefits of winter maintenance are reduced crashes and reduced delay. The benefits are the reduced road user costs. The incremental costs are the costs of increased levels of maintenance needed to provide better levels of service. The incremental costs are the added costs associated with maintaining the facility.
Although these studies are insightful, they are addressing a problem that is very different than the one we face in this project: the closure of the roadway to all traffic. In the case of a road closure, the issue is not necessarily a trade-off between additional maintenance costs and road user costs. It is a trade-off between two types of road user costs. If a roadway is closed when it is unsafe due to winter weather conditions, road user costs are reduced because there are fewer crashes. However, a road closure will delay road users that would have traveled during inclement weather and complete the trip to their
Road User Costs Due to Road Closures
There are essentially two types of road user costs that must be considered when closing a road: safety costs and travel delays. Crash rates have been found to increase dramatically as winter weather conditions become more severe. As the rate of crashes increases during inclement conditions, safety costs increase correspondingly.
Imposed travel delay costs consist of two parts: expected delay and unexpected delay. To illustrate this, suppose a traveler is making a trip between Des Moines, Iowa and
Minneapolis, Minnesota, which normally takes four hours. Also, suppose on the
traveler’s next trip she is delayed because a road is closed due to high winds and blowing and drifting snow just north of Des Moines. The roadway remains closed for three hours until the winds subside. When the road is re-opened, travel is resumed north of Des Moines, but the snowy conditions slow traffic and the trip’s travel time is now seven hours. Thus the door-to-door travel time is ten hours (three hours delay plus seven hours travel time). We could assume that the cost of travel to this traveler was ten hours of unproductive time, as opposed to the normal cost of four hours of unproductive time. A six-hour increase in unproductive time is caused by the road closure and the poor driving condition. This analysis illustrates the generalized costs of delay. Generalized costs are the hourly travel time costs (e.g., we might assume that this equals the hourly wage of a traveler on a business trip) and the direct costs (e.g., fuel, automobile ownership costs, insurance). If this were a trip with no synchronous activities waiting for the traveler’s arrival in Minneapolis, for example a trip to visit the Art Institute in Minneapolis, the only costs associated with this delay might only be the generalized costs.
However, in a more realistic situation, if the traveler knew that the conditions were likely to warrant a road closure, the traveler would probably stay in Des Moines and find something productive to do; for example, visit the Des Moines Art Center. However, if the trip is one where synchronous activities are going to take place once the traveler arrives in Minneapolis, the delay will impact more than just the traveler. The delay will impact those activities that must be postponed until after the traveler’s arrival. For example, suppose the traveler is a professor at the University of Minnesota and a failure to arrive at class on time will cause all of her students to spend unproductive time traveling to class only to find that class is cancelled and that the information not covered by this class has to be covered during a different class or not covered at all. In this case, the road closure has not only resulted in costing the professor several unproductive hours but has resulted in the secondary costs of unproductive time accrued by the entire class.
intuitively understand but is difficult to quantify. We also intuitively understand that given more advanced warning of a delay, travelers have a greater ability to adjust and accommodate a delay. It is an unexpected delay that provides the traveler the least opportunity to adjust synchronous activities and results in the highest costs.
When we examine freight transportation, we find similar relationships with synchronous activities at the trip’s destination. The costs of a delay will be greater for shipments with synchronous activities that will take place when the shipment arrives than for shipments without synchronous activities. For example, a delay of a just-in-time delivery may stop work for entire manufacturing facility and result in substantial secondary costs, but a delay for a commodity that is stockpiled at the destination (e.g., grain) may only result in a loss of the generalized costs associate with truck and the driver.
From these examples, we can see that the cost of delay for a traveler is very dependent on characteristics related to the trip and the trip maker, such as the flexibility of the arrival time, the type of trip (business or social), the income of the traveler, distance of the trip, etc. The costs associated with the delay of a shipment depend on the value of
synchronous activities at the destination, the value of the shipment, the quantity shipped, the perishability of the shipment, and other shipment attributes. Another key variable in calculating the cost of delay is the amount of advanced notice given that a closure of a roadway is likely to occur. With advance notice, the traveler is more likely to be able to make alternative arrangements and the shipper can reduce the costs associated with missing delivery schedule. To understand this further, we investigated literature addressing service disruptions and unexpected delays for both travelers and freight.
Cost of Traveler Delays
Most studies of the cost of traveler delay concern situations with incremental changes in travel time or delay. For example, a typical study would be an investigation of the
reduction in travel time (traveler benefits) resulting from grade separating the intersection of two busy highways. In this case, the new alternative (grade separation) reduces travel time in comparison to the existing condition. In a winter maintenance example, we could assume that the benefits of a higher level of winter maintenance service include vehicles being able to travel faster, reducing travel times. Therefore, the user cost reductions (user benefits) are spending less time traveling. However, in the case of a closure, the traveler is not traveling and there are likely to be other options for the use of this time. For example, if a driver is forced to stop due to a road closure they might find some place to stay and continue to work on a laptop computer or read a book. These are activities that the driver could not engage in more typical analysis. Therefore, even if the traveler has no advanced warning of the closure, it is not the same as conventional change in travel time.
researchers have tried to evaluate travel time unreliability have dealt with incidents in congested traffic where unexpected delays might be a few minutes to 30 minutes. However, in the case of a road closure, the delay will be from a few hours to as much as one or two days. Therefore, applying the results of existing travel time studies to a road closure may be inappropriate because of the difference of the context.
A recent study by Small, Winston, and Yan identified the value of travel time and travel time reliability through the use of revealed preference (RP) and stated preference (SP) data (13). RP is where choices are observed and the researcher uses these data to
determine the relative importance (value) of the attributes the decision maker considered in making a choice. In this case, the researchers studied State Route 91 in California where drivers have a choice between taking the free lanes which are often congested or a tolled lane that is less congested and usually provides more reliable travel times. By knowing whether the driver chose to pay the toll and the relative travel time performance of the free-lanes versus the toll lanes, the researcher can estimate the value of travel time and travel time reliability with the use of a discrete choice model. SP uses a simulated situation where a driver has to make the trade-offs between the toll and travel time reliability. SP is generally considered a less robust technique than RP because SP illustrates what a driver thinks she/he will do, while RP illustrates what a driver has actually done.
Small, Winston, and Yan found that based on RP data, the median value commuters placed on travel time was $20.36 per hour. The median value on travel time reliability (the median value that a driver would pay to avoid an unexpected delay) was $19.31 per hour. Although the numbers may not be entirely applicable to the circumstances involved in a winter weather road closure, it is clear that the most undesirable case is one where travel time is lengthened and the added travel time is unexpected—almost doubling the cost of an expected increase in travel time.
To further understand traveler behavior when facilities are closed, we looked for impact studies conducted on transportation systems disruptions resulting from construction projects, natural disasters, and other events that would cause the total closure of a
roadway. There are many such studies of land slides knocking out roads in New Zealand, earthquakes collapsing freeways in California, and transit workers striking in large urban cores (14). However, the most comprehensive and widely cited study is one by Cairns, Hass-Klau, and Goodwin conducted for the London Transport and the Department of Environment (15). This study set out to answer the questions “what really happens to traffic conditions when road capacity is reduced or relocated?” and “what are the underlying changes in travel choices and behavior that cause these effects?”
roads at the same or different time of day. This suggests that quite a few trips are naturally dissipated due to road closures.
The authors examined different conditions where roads are reduced in capacity or closed. The authors determined that the response (reduction in traffic) is a result of the number of alternative routes, the duration of the capacity reduction, and the availability of
alternative modes of travel. However, in studying even short-term closures due to railroad worker strikes, users seemed to be able to accommodate capacity reductions very quickly. This is due in part to the availability of information regarding the capacity reduction that allows the public to adjust trip-making behavior. The authors found that in some cases, even on the first day of the disruption there was no substantial traffic chaos, and the lack of chaos was often greeted with the bemusement of the press and transportation
professionals. They also found that the extent of publicity and information before the change might itself influence expectations and outcomes.
From the work by Cairns, Hass-Klau, and Goodwin we can see that travelers are amazingly resilient in working their way through a closure or a reduction in capacity. Travelers are finding other activities to remain productive and the issue is not so simple as to assume that if a traveler does not make a specific trip that productive activities cease.
Several studies have found that traffic volumes decrease during winter storms even when roads are not closed (16, 17, 18, 19). This may be due to several reasons, including travelers diverting trips to other modes or other paths, canceling trips, and taking trips at other times before or after the storm. Hanbali and Kuemmel investigated volume
reductions due to winter storms across varied intensity of snow fall, time of day, day of the week, and roadway type (20). Overall, they found that reductions ranged from 7% to 56%, depending on the type and severity of the winter event. Hanbali and Kuemmel conclude that volume decreases with the total volume of snow, and volume decreases are smaller during the peak travel periods (work trips) and on weekdays than during off-peak hours and on weekends (discretionary trips). This means, depending on type of trip (work versus discretionary trips), a number of travelers will prudently decide not to travel when the weather conditions are adverse. Travelers who decide not to travel when weather conditions result in poor driving condition make the road closure decision irrelevant to this portion of the traveling population because they weren’t going to travel anyway.
Cost to Freight Transportation Delays
carriers. However, based on the small sample, motor carriers valued transit travel time at $144.22 to $192.83 per hour (expected delay) and savings in late schedule delays at $371.33 per hour (unexpected delay).
A second U.S. study was conducted by Kawamura. His database consisted of 70 carriers, of which about half were truckload carriers and half were less-than-truckload carriers (22). Each carrier representative was interviewed, and during the interview, the carrier’s representative was asked stated preference questions where the carrier decision maker had to make trade-offs between travel time and tolls on a routes with faster travel times. No estimates of value were made for travel time predictability. The value per hour tended to vary by carrier type (truck load versus less than truck load), but the average travel value was $23.40 per hour.
The problem with both of the above studies is that they interviewed the carrier and not the shipper and/or receiver. The shipper and/or receiver are the ones that will have to suffer the consequences of a late delivery. Although, to some extent, carriers should reflect the interests of their customers, their perspectives are not the same. In addition, it is the attributes of the goods carried that are important in determining a value for time, particularly when determining the value an unexpected delay.
In the Handbook on Transportation Modeling, De Jong reviews the state of the art of Value of Freight Travel-Time Savings. The studies and results he presents are from Western European studies that use factor-costs based modeling approaches and discrete decision making modeling approaches based on RP and SP methods. Factor-cost approaches attempt to calculate the costs per hour through estimates of the inputs to transportation (e.g., fuel, driver’s wage, opportunity costs of cargo). In general, the RP and SP surveys are surveys of shippers as opposed to motor carriers that better reflect the costs of a delayed shipment. The RP and SP studies result in value of travel time per hour per truckload ranging from almost nothing to $71 per hour; the author believes a realistic average value of a truckload travel time is about $40 per hour. De Jong points out that this is about twice the value that is typically arrived at using factor costs models. He interprets this to mean that the cost imposed on industry by delays in transit is about double the direct costs (the factor costs).
The relationship between costs of unexpected and expected delay is shown in Figure 2.1. With enough advanced warning of an unexpected delay, it is no longer unexpected and becomes expected. In Figure 2.1, the decrease in cost is shown as a line representing the declining cost to the cost of an expected delay over some time after notification which reduces costs down to the cost of an expected delay. The issue is to provide enough advanced warning so that the delay due to inclement weather is only valued at the cost imposed by an expected delay.
Figure 2.1. Relative cost of a delay
Literature Review Conclusions
We found no literature dealing directly with the benefits and costs of road closure during severe winter storms. We found studies that provided insight into the problem and those that researched the outcomes of transportation capacity reduction and restrictions and studies of delay costs. However, because none of these studies were in the context of a winter road closure, the results are not likely to be directly transferable.
Some of the issues that were made clear through the literature review included the following:
Availability of information describing a transportation system disruption or the likelihood of a future disruption allows travelers and freight shippers to adjust the synchronous activities that will take place at their destination. The more warning the traveler or shipper has before the disruption occurs, the greater the opportunity to adjust and the lower the costs.
Because the literature tells us that an unexpected delay is greater for freight shippers than it is for travelers, and that there tends to be a lot of heterogeneity in the value of travel time reliability between different types of freight, the next chapter explores the cost of a disruption of transportation services due to road closure through interviews with
3. CARRIER AND SHIPPER/RECEIVER INTERVIEWS
The impact of highway closings varies widely among trucking companies and shippers and receivers of freight. The research team conducted interviews with six companies (three trucking firms and three shipper/receiver firms) to gather information on the types and magnitudes of costs associated with highway closings and how companies cope with these closings. Though one cannot generalize the findings from a limited number of company interviews, the information gathered from the interviews is insightful nonetheless.
The primary objective of the interviews was to obtain a broad range of perspectives on the impacts of highway closings in Iowa and Minnesota. Two criteria were used for selecting the companies to interview. First, each company must have facilities in either Iowa or Minnesota or in both states. Second, because the costs of transit delay depend upon a number of product and operating characteristics, there had to be differences among the companies in terms of their operations and the products/services they provide. For example, for the trucking company interviews, a general freight truckload carrier, a flatbed carrier, and a less-than-truckload carrier were selected because their operations, customer requirements, and cost structures are quite different from each other.
Selected companies were contacted to solicit their voluntary participation. Each company was provided with a brief overview of the project and its objectives and was promised confidentiality (anonymity). To provide consistency in the information gathering process, a set of questions was developed and faxed to the companies before the interview,
allowing each interviewee adequate time to prepare for the interview. The interview questions are provided in the Appendix. The interviews were conducted by telephone or in person and tape-recorded for reporting accuracy purposes. At least two members of the research team participated in each interview.
The key findings from each interview are presented in the following sections. A summary and conclusions derived from the interviews are then discussed.
Trucking Company Interviews
Company A
Company A is a truckload carrier that operates approximately 800 dry vans and hauls general freight. Some of its key customers are in the food, consumer durable goods, and equipment manufacturing industries. The interviewee is the director of expedited
services.
deliveries. Vehicle delays have a ripple effect—they affect not only the immediate load, but subsequent loads as well. Road closings are a large factor in these types of operations. Furthermore, because of the tight profit margins in the trucking industry, a bad month, especially in the winter, can make or break a trucking company.
Financial Impacts
When a vehicle is delayed due to a winter road closing, Company A estimates it costs $25 per hour, or a total operating and financial cost of $600 per day ($1,150 if it is a team driving situation). This includes the cost of fuel consumption while the vehicle is idling, capital costs for the equipment, lost opportunity cost (i.e., missed revenue opportunities), etc. Additionally, the company may be subject to penalties from its customers for late shipments. The company usually avoids these penalties, however, because it can document the severity of the bad weather and/or convince its customers that the delay was due to safety considerations.
The company’s customers may incur even greater costs due to delayed shipments. For example, one key manufacturing customer reports a cost of $1,000 per hour when
shipments of parts arrive late. Another JIT customer is a make-to-order company. That is, the company does not fabricate a product until it has received an order for it. This
customer, therefore, puts tremendous emphasis on fast, dependable transportation both for inbound and outbound movements. Though Company A cannot cite a cost for delayed shipments for this customer, it estimates it is in the thousands of dollars per hour for inbound shipments.
Coping with Road Closings and Bad Weather
At Company A, unless the public authority closes the road, the decision to delay a trip due to severe weather conditions resides with the driver. In terms of anticipating weather-related delays, Company A uses the internet, the Weather Channel, and in-truck satellite information to assess each situation. When asked about the possibility of better road weather prediction through Roadway Weather Information Systems (RWIS), Company A thought that RWIS data would help them to document for their customers the condition of the road when a shipment is delayed due to severe weather conditions (i.e., road closed, snow/ice accumulation, visibility) after the fact to avoid late shipment penalties.
Company A notes that it is very difficult to prepare for or circumvent weather-related delays. It is often not possible or practical to make route adjustments because either alternative routes are also affected by the same weather conditions or alternative routes are too lengthy (i.e., less time and cost are incurred by waiting until the road re-opens).
The company stresses communications with customers as the primary means of coping with or adjusting to weather-related delays. Informed customers can then make
customers (such as those on JIT or dedicated systems). Currently, all customers receive either verbal or electronic shipment updates every hour, but they do not have real-time access to Company A’s AVL and GPS location data. These communications efforts create additional costs for the company, as employees are often required to stay late or arrive early to keep customers informed.
Public Policy and Other Issues
When asked about best practices in public road management, the interviewee expressed a preference for forced closures. Shutting down the roadway leaves little doubt about what the driver and company should be doing. The company’s most problematic route for severe weather is I-80 through Wyoming. The interstate is gated and no entry is allowed during windy or poor conditions. Closures on this portion of highway seem to occur more frequently than on other roadways that Company A uses, and the delays can be quite lengthy (a day or more).
An issue that will exacerbate the costs and operational problems associated with road closings and delays are the new hours-of-service regulations that became effective on January 4, 2004. Truck drivers can no longer log weather delays as “off-duty” time. Thus, delays will now have a greater effect on the number of hours that drivers can work and drive.
Company B
Company B is a flatbed trucking company that operates nationwide. This interview was conducted with both the vice president of operations and the vice president of safety.
More than 50% of Company B’s business involves delivering materials to construction and building job sites. All of their loads are handled on a just-in-time basis. The
interviewees estimate that 50%–60% of loads have a delivery window of one to two hours.
Financial Impacts
Company B’s estimates of delay costs, $575–$600 per truck per day, are similar to that of Company A. Company B provided a breakdown of costs as well, estimating that total fixed costs are $26 per hour and total variable costs are $0.45 per mile.
The costs of a late delivery can be substantial for Company B’s customers. The
interviewees were aware of delay costs of thousands of dollars. For example, cranes are often needed to unload building materials from the flatbed trailers at the job site. These cranes are leased on an hourly basis, and the customer pays for the period of time the cranes are at the site, regardless of whether or not they are used. Lease costs of up to $1,000 per day are not uncommon. Also, many of Company B’s equipment
finished product directly from the production line onto the flatbed trailer. Therefore, the penalties for late delivery are substantial.
Coping with Road Closings and Bad Weather
Company B gains valuable weather information from a number of sources, including the Weather Channel, Internet, state road condition web sites, and feedback from the drivers themselves. Unless the public authority closes the road, the driver decides when it is unsafe to proceed. Drivers are told to continue only when the route is acceptable for his or her driving abilities.
When there is an advanced warning of serious weather conditions, alternatives considered include shipping that day and incurring the delay, keeping drivers at the terminal and shipping late, and shipping early (with customer’s permission) and beating the weather. Use of alternate routes is usually not a feasible option for reasons mentioned by Company A. However, when the company is expecting a storm, Company B will try to avoid the affected area to maximize productivity.
Company B tries to be proactive in communicating their delays. With effective communication, nine out of ten customers understand the reason for the delay. The biggest problem with respect to customer relations and assignment of fault or liability occurs when the bad weather is not at the origin or destination point. For instance, a Texas consignee is less aware and understanding when bad weather in Iowa causes the delay than if the weather problem was in Texas. Thus, the ability to document road closings and driving conditions nationwide is important to the carrier.
Public Policy and Other Issues
The interviewees cited a problem with lack of advance information about road closings and travel delays. They emphasized the need for state and local governments to
communicate with each other and the public.
Company B, like Company A, is concerned about the impact of the new hours-of-service regulations. The interviewees believe the new rules will make it very difficult to “work through” road closures. Because of the inability to log off-duty time, they are also concerned that the new rules will put pressure on drivers to continue driving when they should be shutting down for safety reasons (e.g., weather, fatigue)
Company C
Financial Impacts
Company C reports that delay costs for LTL carriers’ over-the-road equipment should be similar to those of truckload carriers. However, travel delays create much greater
operating costs at the LTL carriers’ terminal facilities where shipments are consolidated for the line-haul move and de-consolidated for local distribution.
Employees and assets in the terminals represent a fixed cost (i.e., a “committed” resource). Almost 90% of Company C’s cost would be classified as fixed. Shipment delays disrupt operations planning and cost performance. For example, the company plans its weekly workloads far in advance, using historic data and recent freight orders, and schedules dock workers one day prior. When a truck is delayed in getting to the terminal, the result is excess labor during the delay and a shortage of labor during the “catch up” period (when the delayed and regularly-scheduled shipments arrive). The company incurs non-productive downtime costs during the slack period, and higher labor costs due to overtime pay and congestion during the catch up period.
Coping with Road Closings and Bad Weather
Company C receives weather information from three sources:
Central dispatch (at corporate headquarters) produces weekly and daily reports that are sent directly to the terminals and drivers
Driver feedback to gain current, up-to-the-minute data
In its safety department, Company C employs former drivers to drive to the problem to experience the conditions first-hand
Company C’s central dispatch makes all decisions on closing routes, changing routes, and monitoring the weather in Canada, Mexico, and the United States. The interviewee noted that to alter a route, the movement must be substantial enough to allow the driver to bypass a large portion of the U.S. It is difficult to make those types of adjustments on shorter trips.
Public Policy and Other Issues
The interviewee did not identify any best practices from local or state governments. Nevertheless, he suggested that an improved information flow between the company and local/state authorities would greatly benefit the safety and operational planning of the company.
Company D
Company D is a manufacturer of consumer and industrial durable goods and is the country’s largest producer in its primary industry. All products are made-to-order rather than made-to-stock, and very lean inventories are kept. The company receives and delivers 80% of its products on a JIT basis. Delivery windows range from 1 to 4 hours, and carriers must make appointments for loading and unloading shipments.
Financial Impacts
Because of the integrated nature of its plant operations and the use of JIT systems, late deliveries of inbound materials create huge costs for Company D. Delays of basic materials can shut down an entire plant. The downtime cost at one of its mid-size plants is $6,000/hour.
Company D’s customers assess a $500 penalty if the shipment is more than 30 minutes late. Carriers also assess a penalty of $600 per truck per day when an appointment is missed and must be rescheduled.
Coping with Road Closings and Bad Weather
Like the other companies that we have interviewed, Company D stressed that
communication is the key to mitigating the effects of delays. Early communication of potential or impending delays allows Company D and its customers to make adjustments. For example, Company D does have some flexibility in its manufacturing facilities to switch over production lines to alternative products. Typically, 12- to 24-hour advance notice is adequate. The company monitors the Internet and the weather channel for climate information.
In the event of bad weather and potential road closings or delays, Company D occasionally makes an effort to receive a shipment earlier or possibly reroute the