Abstract: Industrial processes particularly cement manufacturing unit consumes about 7% of total fuel used in the industry and hence there are strenuous efforts to reduce the fuels and lower the production costs by applying Optimal Control Algorithms. In order to achieve these parameters in the Rotary Kiln Plant, we need to continuously monitor the temperatures of the burning zone inside the rotary kiln at Regions of Interest (ROI) in real-time. In this image processing setup a thermal camera samples the temperatures inside the kiln at a rate of 5 frames per 2 seconds. The images which are highly sensitive to red and green wavelengths provide sufficient resolution to differentiate between various burning temperatures. The present burning zone temperature measurement obtained from the radiation pyrometer is not reliable on the one hand and indicates temperature information about particular point in the burning zone on the other hand. This is inadequate for optimizing the operation the kiln where a kiln furnace camera has been already installed at the plant for watching the burning status the inside the kiln. Software will be developed to determine the temperature T, for the video captured from the camera. Presently real time video from the camera is displayed in a computer monitor at kiln control room. We will tap the video signal from the setup and the calculate the burning zone temperature at the Region of Interest utilizing real time Image Processing Technologies. The temperature signal so estimated will be validated using the radiation pyrometer signal obtained from the field. The graphical tool developed in MATLAB automatically converts the receiving color images to temperature measure by proposed algorithms and also interactively analyzes the temperatures in a neat graphical user interface, in less than 2 seconds duration. ROI can be selected by a movable and re-sizable window which acts like a probe on the kiln temperatures at this instant, then displays the summary statistics of the temperatures. The tool is extended to provide a real-time graph of average temperature in the ROI over a long time when the probe is fixed at a particular region. However, the developed temperature tool and the point burning zone temperature measured by a proposed mathematical model as like thermocouple in the plant. The results are carried out by MATLAB software and benefits will be quantified in terms of enhancement in the Production efficiency, Energy efficiency, Pollution Control and clean environment. Index Terms: Cement Rotary Kiln, Mathematical model of Burning Zone temperature, Digital Image Processing.
Revised Manuscript Received on July 09, 2019
N Merrin Prasanna, Research Scholar, Department of Electronics and Communication Engineering, Koneru Lakshmaiah Education Foundation, Vaddeswaram, Guntur, Andhra Pradesh, India.
Polaiah Bojja, Professor, Department of Electronics and Communication Engineering, Koneru Lakshmaiah Education Foundation, Vaddeswaram, Guntur, Andhra Pradesh, India.
I. INTRODUCTION
Rotational kiln are crucial of cement assembling process whose deliver is clinker which thus ground to produce. The rotational furnace, as a huge scale warm trade office, is broadly utilized as a part of metallurgical, cement, substance, and condition security enterprises. A noteworthy issue in sintering [7] process of the rotating kiln is the online file estimation for the framework yield in terms quality of the clinker [2] in liter weight. Sadly, there is no analyzer instrument accessible so far for ongoing detecting of clinker quality because of its unique structure. Some significant work using either process factors or fire picture highlights has been done in light of measurable methodologies .The process mainly involves three phases of generation crude meal, clinker and cement.
The estimation of consuming zone temperature is acquired in plants customarily, with radiation pyrometers which present the temperature of a hotspot[1]. The standard of radiation also influenced with the errors contributed by radiation weakening and emissivity and thus present odds of getting to inaccurate.
In this paper, we were present Image processing based thermo graphic methodology presented to measure the temperature of hotspot region. Thermo graphy methodology is proposed here to screen temperature on high temperature recalcitrant protection, a turning kiln, furnance or heater there might be of 6000C15000c.Thermal designs identified in these cases can be utilized to screen the state of the protection or even as certainded the thickness of the staying obstinate. Such type of thermography can play major role to identify and detect exact temperature and there by estimate the damages to the refractory linings.
Thermo graphical [5] data analysis of various process steps. Pseudo-coloring of thermo gram is one of the vital variables for exact finding. Pseudo-color is regularly utilized as a part of information perception etc.This Procedure can essentially enhance the perceptual capabilities of human visual frame work.
A.Implementation of Proposed system
The image processing system will be implemented at KCP
cement, muktyala,
Krishna district,
Development and Evaluation of Mathematical
Model based Region of Interest for Rotary kiln
Burning Zone Temperature in Cement Industry
by Digital Image Processing
A PC based image processing system is used. High resolution CCD cameras placed at rotary kiln with safety parameters. The standard image processing algorithms will be taken from backend image processing library and the image processing framework, will utilized for integrating the total system. A pseudo –color coded thermo graphic presentation system will be the HMI of the system as shown in schematic diagram for the field implementation in figure.
Fig.1Rotary Kiln Burning Zone Temperature Estimation scheme using Image Processing
B.Software Architecture
An alternate method is also proposed to discover the relationship between's the R, G, B esteems (free factors) and temperature (dependent factors), different strategies, for example, least square technique, polynomial fit, linear and non-linear relapse can be utilized. The proper strategy should fit the information well with least standard deviation. The results can be validated using already existing radiation pyrometer readings. The analysis will be done using commercially available standard statistical software. The method, giving minimum standard deviation, will be selected as the algorithm for the proposed system as shown in figure 3.
Fig.2 Soft ware architecture of Temperature Measurement from Flame Image
II. STAGESINCEMENTCLINKERPRODUCTION
A.Raw meal production
The lime stone acquired from apprehended mines is mixed with higher quality limestone and laterite. Ropeway system with 180 buckets (approx) is employed for transporting the lime stone from the mines to the plant. The crude blend
ordinarily contains 95% limestone and 5% laterite. The crude materials are smashed using primary and secondary crushers to a very fine powder. The resultant item is called crude meal and is put away in solid soils where it is pneumatically homogenized to get a uniform item.
B.Cement production
Cement is created by crushing clinker with 3-5% Gypsum in a close circuit ball production line to required fineness. Gypsum is added to control the setting properties of bond. Crushing clinker and gypsum yield ordinary Portland bond (OPC). Fly fiery debris/slag at required extent is ground alongside clinker and gypsum to deliver Portland pozzolana concrete (PPC)/Portland slag cement (PSC). The ground bond is put away in solid soils and pressed in 50 kg sacks utilizing electronic pressing machines.
Fig.3 Rotary Kiln
Revolving kilns are long, barrel shaped, marginally slanted heaters are fixed with refractory to ensure the shell and hold heat inside the kiln. The crude material blend comprising of Cao (65%), Sio2 (20%), Al2O3 (10%) and FeO (5%), enter the kiln at the raised end. The ignition powers are brought into the base end of the heater in a countercurrent way. The temperature and thus the consuming conditions are assessed utilizing segmentation strategy. The materials are steadily and bit by bit moved to the base end by the upheaval of the oven. As they move down the oven, the crude substantials are warmed by flame at a temperature of approximately 1450oC
within the
kiln.
The most ordinarily utilized furnace energizes are coal, petroleum gas and periodically oil.
C. Clinker Production
The raw meal is fed to a 4-stage multi cyclone pre-heater system by means of belt bucket elevators. Calcination takes place in the cyclones and this is then fed to a rotary kiln where Clinkerization takes place. The turning oven is around and hollow steel shell of 65m length and distance across 4.2m, fixed with refractory bricks. The oven is marginally disposed and set rotating at a speed of 2-2.2 rpm. The kiln is fired with pounded coal and sufficient air and kept up at a temperature of around 1450C.
The hot gasses arising from the combustion are passed through the other end of the kiln. In the pre radiator and kiln, the crude meal experiences a progression of physical and also compound changes. The resultant item in nodular shape acquired from the kiln is called clinker. Clinker is quickly extinguished in the clinker cooler to balance out its properties and put away in the clinker stockpile as shown in figure 1.
III. DESCRIPTIONOFSYSTEMARCHITECTURE Proper production of clinker will happen at a certain burning zone temperature, which varies with raw material quality. The inappropriate temperature at the burning zone can make the clinker under-burnt or over-burnt. Under-burnt clinker will be in dusty form and requires to be retained in the kiln for a longer time than the normal retention time. This will cause an accumulation of raw materials inside the kiln and worsen the performance of the kiln. Operator will have to either increase the fuel feed rate or reduce the raw material feed rate; both in turn deficit the production rate of the kiln. During over-burnt conditions there exists a sintering temperature that is higher than required for normal clinkerisation. The over-burnt clinker gets molten and forms large blocks which stick on the inner surface of the kiln. The over-burnt clinker will not be useful as it cannot be brought back to desired quality and will go as waste. Therefore accurate estimation of the clinkerisation is necessary for the cement plant in the performance point of view as shown in figure 1.
A new system which performs the visual examination of the sintering process is desired for the continuous runnability of the rotary kiln. An image processing based themographic system is presented.
The architecture of the system includes
(i)CCD camera based industrial image acquisition system
(ii) Integrating image processing algorithms from library
(iii)
Themographic presentationDiagram system arch of the proposed system based on flame imaging. The picture sensor and, a semiconductor gadget CCD camera that can change over captured pictures into advanced signs. In CCD camera number of minute sensitive photo elements or pixels are embedded. . The number of pixels increased then resolution increases, Clarity of the captured images increases. The part of the CCD resembles a photographic film, however it changes over pixels into binary levels. There are numerous capacitances efficient in CCD
which can draft light and change over pictures into advanced signs [7].
The system comprises of an optical test, a channel get together, a CCD camera, an edge grabber and image processing software. The camera is an industrial CCD camera with cooling mechanism and dust cleaning arrangements. The camera is to be placed at the end of the kiln where clinkerisation is taking place to get the image of firing zone. The temperature, which is mainly available from radiation pyrometer, is a point measurement of hotspot temperature. In many occasions, it is observed that the flame diameter has more influence over the clinker production than the ignition point. This flame diameter is termed as the region of interest in kiln thermography. Therefore a clear understanding of the firing temperature and the total area of the ‘regions of interest’ (burning zone temperature distribution) will help in estimating the sintering status by using the Digital Image processing technology.
IV. MATHEMATICALMODELBASEDREGIONOF
INTERESTFORROTARYKILNBURNINGZONE
FLAMETEMPERATUREMEASUREMENT
From the caught digital frames of flame in terms of temperature, singular pixels can be isolated utilizing region developing system. Pixel area and its Red (R), Green (G) and Blue (B) colour properties will be acquired for singular pixels. A color histogram can be utilized to speak to the colour arrangements of a picture. The temperature and its appropriation in an edge can be ascertained from the proportion between the dark ranges of relating small elements called pixels inside two pictures caught at (ƛ1,ƛ2) as wavelengths .
At the burning zone temperature extends from K
0
2000
1000 and wavelength varied from 0.6 to 0.8 µm.
According to Wien’s)[4][5][6] radiation law, in equation (1)
………. (1)
It can be demonstrated that the yield of the imaging framework, to be specific the gray level G (λ, T), i.e. equivalent to CCD camera sensing radiant intensity by equation (2),
G ( , T) = R. Sƛ. …………. (2) Where
R= It reflects various errors like radiation weakening because of optical framework.
Sƛ is the spectral intensity of the CCD sensor, is the emissivity, C1 and C2 are planks constant.
sensitivities for the red and green than for the blue and in this manner a superior SNR proportion can be accomplished. The wavelengths ƛ1 and ƛ2 corresponding to the colors R and G is given by equation (3)
)] 1 1 ( exp[ ) .( ) ( ) ( 1 2 2 5 1 2 2 1 1 1 , 2 , 1 T C s s T G T G … (3) Where
Sƛ1/ƛ2=spectral response characteristic (With the range of
0.005 to 0.1 µm)
Rearranging the above equation, yields the outflow of the objective temperature in equation (4):
2 C
T
2 1 1 2 , 2 , 1 12 ln 5ln
, , ln 1 1 S S T G T
G (4)
This shows the two-shading strategy tables the temperature in view of the proportion of the emissivity at two wavelengths without the earlier learning of the genuine emissivity. The temperature calculation steps using the two-color method.
V. IGNITIONAREAESTIMATIONANDMONITOR
Ignition area is a measure of the highest temperature distribution in the rotary kiln, which give the integrated information of sintering zone. The ignition area can be obtained by counting the pixels line by line, within the area and then normalize it to the area of the entire viewing field. For finding out the contours of a uniform thermal distribution, various edge discovery systems can be utilized.
The steps for finding out the flame area (i)Gray scale image conversion (ii) Image enhancement (iii)Spatial filtering (iv)Binary imaging (v)Erosion for non-targets
(vi)Edge detection and Hole filling (vii)Flame zone-area calculation. (i). Gray scale image conversion
Right off the bat the color pictures are changed over into grayscale pictures. This is trailed by applying picture improvement, spatial separating, binary picture, and picture disintegration, to the gray scale pictures.
(ii). Image enhancement – picture upgrade utilizes straight change to grow the appropriation territory of the grayscale to unique picture.
(iii). Spatial Filtering – picture spatial sifting utilizes a median filter. The rule orchestrates the grayscale estimation of the pixels secured by the cover from the little to huge. The incentive amidst the grouping is known as the middle, and is the yield of the channel. The technique id used to evacuate disconnected pixels, and holds the sharpness of the picture. The rule of middle sifting is exhibited in figure 4. Middle separating can expel antiquities pixels that low pass sifting isn't prepared to do.
Fig.5 Median Filtering
(iv). Binary imaging – Paired imaging – in gray scale pictures, every pixel ranging ( 0-255). By implement picture binarization on the picture, image gray scale picture is changed over into a paired picture essentially diminishes the multifaceted nature of picture preparing and figuring limits, there upon expands the proficiency of handling.
The objective protest, are spoken to by high contrast separately. The binarization formula is given by equation (5),
1, g(x, y)>T b (x, y) =
0, g(x, y) ≤T (5)
Where b(x, y) stays for two overlay picture, g(x, y) is dark scale picture, and T address the dim scale confine. In getting a correct target impede in the photo in binarization technique, an convenient edge was required. If the cutoff is set too high, the goal would appear to be lacking, and darker target would be assembled as a feature of back ground. Notwithstanding what may be normal, if the farthest point is set too low, an extensive number of relics would be made, which extends the inconvenience of anchoring the target.
(V). Erosion technique - Non-target items are expelled by applying the disintegration operand that levels just the foundation and the objectives on the picture. This disentangles the way toward extricating targets. Disintegration techniques are isolated into 4-neighbor and 8-neighbor disintegrations in equation (6).
After picture pre-preparing, non-target items will be totally dissolved. Just the foundation and the targets will be left of the image. The picture now contains twofold pixel with "0" and "1" values. Blob examination can be connected to extricate the attractive pad zones. To begin with, the picture will be marked by apportioning diverse numbers to various targets. The handling items are the pixels with their nearby pixels. The picture naming procedure is appeared with three focuses as underneath as shown in figure 5.
Fig.6 Image labeling in blob analysis
The objective social event is given a practically identical number when the pixels of the objective get-together had the estimation of "1". The objective social occasion were settled in the wake of marking.
(vi). Edge Detection, Hole Filling -Edge Detection After separating each objective gathering, edge discovery will be completed. Edge location is the most widely recognized strategy for distinguishing important discontinuities in dark scale. Regular edge discovery strategies are: sobel, prewitt, Laplacian Roberts, and Canny. Sobel approach can be attempted to identify the edges of the protest. Sobel cover is a 3*3 inclination administrator used to distinguish edges in pictures. The X indicates horizontal bearing and Y indicates vertical course administrators are given in beneath as shown in figure 6.
1 2 1
0 0 0
1 2 1
x
G
1
0
1
2
0
2
1
0
1
Gy
In the new picture, the situations with solid reactions are confine parts, known as Edges.
Fig.7 Edge detection
Hole filling decides the pixel amass in the trademark gap of a similar region. This is trailed by filling the opening with a similar particular esteems inside a similar region . Figure given beneath demonstrates the computed comes about after holes filling as shown in figure 7.
Fig.8 Flame holes are filled
Edge detection alludes to the way toward recognizing and finding sharp interstice in a image. The interstice are sudden changes in pixel force, such a gap portray breaking points of items in a locale. Established procedures for edge recognition incorporate convolving the photo with an administrator (a 2D channel), which is developed to be touchy to substantial slants from photo while returning estimations of zero in steady locales.
Picking an edge detection administrator includes different variables, in particularly Edge Location, Noise, edge structure. There are various ways to deal with perform edge recognition. In any case, the lot of various techniques may be divided into two classes i.e. Gradient and Laplacian. In gradient the edge methodology perceives the edges by methods for looking to the most mind blowing and slightest in the fundamental subordinate of the photograph. In Laplacian the laplacian system checks for zero assembly in the
secondary backup of the photo to detect edges. An edge has the 1-D state of review and figuring the auxiliary of the photograph includes its zone.
(a)Sobel Edge Detection Operator: This method consists of a couple of 3*3 convolution kernel as takes after. One kernel is just the other pivoted by .90o as follows:
Such kernels are proposed to respond maximally to edges running diagonally and on a level plane concerning the pixel system, one area for each and every one of the two reverse introductions. The parts can be connected self-self-governing to the information picture, to make confine estimations of the inclination fragment motel each introduction (call these GX and GY). These can be gotten together to find the special size of the tendency at each point and the introduction of the edge. The edge measure is given by condition (8).
|
G
|
Gx
2
Gy
2
……. (8) Ordinarily, a inexact magnitude is registered Utilizing: |G|= |Gx| + |Gy| ………. (9) the spatial angle is given by
=arc tan (Gy/Gx) …….. (10) (b)Prewitt’s operator:Prewitt administrator is as same as the Sobel administrator and is utilized for distinguishing diagonally and flat edges in pictures in following.
Fig.8. Sobel convolution kernel (c) Laplacian of Gaussian:
The Laplacian is a 2-Dimensional extent of the second dimensional subordinate of a photo. The Laplacian is routinely connected with a photograph that has first been smoothed with something estimation a Gaussian smoothing straightforwardly remembering a conclusive focus to diminish its affectability. The chief for the most part takes a singular to decrease level picture as data and exhibit another reduce level picture as yield.
The Laplacian L(x, y) of a photo with pixel control regards I(x,y) is given by condition (11):
L(x, y) =
2 2
2 2
y
I
x
I
of discrete pixels, we will find a discrete convolution part in the vitality of the Laplacian. Three as often as possible utilized little pieces are appeared in figure underneath.
Fig.9 Three Normally Utilized Distinct Approximations To The Laplacian Filter
Since these bits are comparative a moment subordinate estimation on the photograph, these are exceptionally dubious to clack. For this, the photo is frequently Gaussian smoothed before relating the Laplacian channel. This pre-overseeing step diminishes the high recurrence commotion preceding methodology following stage. Of course convolution task is affiliated, the Gaussian-smoothing channel with the Laplacian channel can be utilized to start with, and after that convolve this crossover channel with the picture to accomplish the required outcome. This method has two focal points.
i) Since both the Gaussian and the Lapalacian bits are typically altogether tinier than the picture, this method when in doubt needs far less calculating task.
ii) The Laplacian of Guassian kernel can be registered early so only a solitary convolution ought to be achieve at execution-time.
The 2-Dimensional Laplacian of Guassian work upset on zero and, ‘
’has the shape as in equation (12).LoG (x, y) =
-2 2 2
2 2
2 2
4
]
2
1
[
1
y x
e
y
x
(12) and is as below figure.
Fig.10 The 2-D Laplacian of Gaussian function
Fig.11 Detached approximation to Laplacian of guass function with Gaussian
=1.4As the Gaussian is made coherently confined, the LoG bit changes into the same as the unforeseen Laplacian bits as
appeared in Figure 5.10.13.This is a direct result of smoothing with preposterously oblige Gaussian ( <0.5 pixels) on a discrete framework has no impact . Along these lines on a withdrew arrange, the fundamental Laplacian can be viewed as a limiting instance of the Laplacian of Gauss work for control Gaussians.
(d)Canny Edge Detection Algorithm
The idea behind in this algorithm is to discover focuses in the tested picture that have locally substantial inclination extents. The edges in genuine pictures are not impeccably sharp since the edges are smoothed by the low-pass separating inalienable in the optics of the camera focal point and the data transmission confinements in the camera.
After smoothing the picture and dispensing with the clamor, the resulting sort out is to discover the boundary quality by taking the edge of the photograph. The Sobel's take plays off a 2-D spatial slope estimation on a photograph. The Sobel head plays out a 2-D spatial slant estimation on a photo. The administrator involves two or three 3x3 convolution parts. One piece is basically the other turned by 90 degrees. These pieces are wanted to react maximally to edges running vertically and in like manner with respect to the pixel matrix, one piece for each and every one of the two switch strategies. The parts are related uninhibitedly with the data picture, to make disengage estimations of the edge section one in the x-bearing (segments) and the other in the y-heading (columns).These would then be able to be consolidated together to find the aggregate size of the slant at each point and the presentation of that edge.
Along these lines, the figure mean edge sizes (edge quality) at each point can be found. The figuring by then tracks forward these domains and covers any pixel that isn't at the best (non-most over the top suppression).The inclination amass is in addition decreased by hysteresis.Hysterisis is utilized to track along the straggling leftovers of the pixels that aren't covered. It utilizes two edges and if the criticalness is beneath the basic edge, it is fixed to zero if the degree is over past what many would think about conceivable, it is made an edge. In like manner, if the size is between past what many would think about conceivable, it is fixed to zero aside from if there is a route from this pixel to a pixel with a point above T2.
VI. PROPOSEDMODEL
Thermo Graphic Methodology:
Thermo graphy is an imaging methodology arrangement of the temperature, angles utilized for the investigation and recognition of hidden thermodynamic development. The technology allows operators to validate normal temperature distribution patterns in clinker burning operations and more precisely, locate thermal abnormalities which indicate possible heat zones, areas of separation, distribution and hot spots within the area under observation.
the turning kiln, furnace or heater there might be of c
C 0
0
1500
600 .Thermal designs identified in these cases
can be utilized to screen the state of the protection or even ascertained the thickness of the staying obstinate .Such type of thermography can play major role to identify and detect exact temperature and there by estimate the damages to the refractory linings. Thermo graphical data analysis of various process steps.
Pseudo color coding in Thermography:
Thermo grams are generally given in dark level pictures however dim pictures are not suitable for human elucidation. Individuals can just recognize a couple of dozen dim level esteems while they can recognize a great many hues. So Pseudo-coloring of thermo gram is one of the vital variables for exact finding. Pseudo-color is regularly utilized as a part of information perception with a specific end goal to pass on a wide assortment of data including metric esteems, patters, accentuation, etc,. Colored thermo grams result in a more compelling representation and after that precisely conclusion temperature zones. This procedure can essentially enhance the perceptual capacities of human visual framework.
Some important considerations while selecting Pseudo-Coloring algorithm are
• The calculation for coloring ought to be with the end goal that exact ID of individual and element is conceivable.
• Coloring ought to be with the end goal that the objective is perceivable from non-target components.
• The quantity of hues ought to be ideal for vision holding. A color thermo gram for instance in RGB framework contains three dim parts. So keeping in mind the end goal to create shaded thermo grams, we must give three matrices to change on the original gray thermo gram and deliver three gray segments. At that point joining them, the colored thermo gram is realized.
In Pseudo-shading procedure, taking care of following focuses is essential:
• Colors are allocated subjectively as per the specific shading map capacities in view of power of unique thermo gram.
• The shading are basically a visual guide for understanding the temperature inclinations engaged with each picture and wear not expand picture data.
• It is vital to comprehend that specific shading isn't allocated to a specific temperature in all pseudo-shading calculations.
PSEUDOCOLORING ALGORITHM-1: “Hot Color Scale”
The primary shading scales that are utilized world over for gray thermo grams is Hot Color Scale. This shading scale changes effectively from reduce, through gloominess of R, G,B to white. Inevitable outputs of employ this shading map have been showed up beneath as shows the resultant image in figure 12.
Fig.12 Thermo graphy –Hot color scale PSEUDO-COLORING ALGORITHM-2: “Hot Color Map”
[image:7.595.308.543.282.384.2]This shading range shifts from dull blue, maroon and orange, to light yellow. With a specific end goal to make such a scale, a winding way on corner to corner of RGB demonstrate is utilized. Figure below illustrate the utilization of this strategy to shading code dark level pictures levels are shown in results in the figure 13.
Fig.13 Thermography-Warm color map
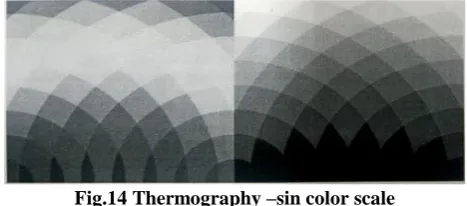
PSEUDOCOLORING ALGORITHM-3: “Sin Color Scale”
[image:7.595.309.543.551.654.2]In this shading range, sin change capacities are utilized to appoint the hues to dim level image. Human eyes are delicate to longer wavelengths than shorter wavelengths .So we require targets addressed with orange and red and non focus, for instance, foundation diagram with blue shading. Picture underneath give such forms. Before utilizing sin function, more often than a pre-change work is applied. This capacity communicates the connection between pixel esteems and the relative combined angle extent of unique picture forces as shown in figure 14.
Fig.14 Thermography –sin color scale Proof of the Concept by proposed Algorithms:
The results can be validated with the pyrometer readings. Figure 15 Illustration of the procedure for proof of Concept.
( a)
(b)
Fig.15 (a&b) Experimental Results for Proof of the Concept
VII. RESULTS&DISCUSSION
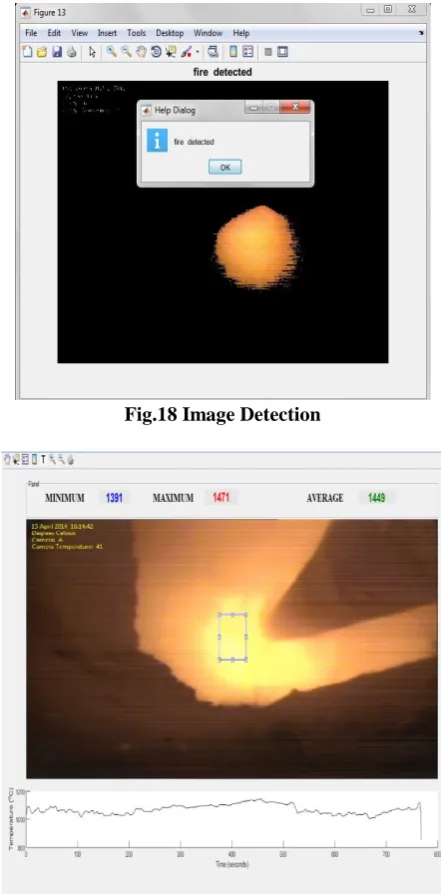
[image:8.595.315.536.49.497.2]The KCP Cement Plant collection of the data in terms of real time images are used to train the different algorithms. The results are obtain as shown in figure 15, fire also, material zones are isolated from these shealth and relating ROIs .On placing the mouse over the pixels of pseudo shading pixel picture, temperature regard will be bloop up. This temperature esteem was differentiated and the estimation procured from pyrometer and was seen to be attractive with a inappropriately of +-20 C. The yield of the thermography display as appeared figure.
Fig.16 Images from the capture video at rotary kiln at different time
Fig.17 Images Represented in RGB and YCB colors
Fig.18 Image Detection
Fig.19 Measuring of Min, Avg, Max temparature VIII. CONCLUSION
In this paper, we have built up a shading highlight based division for removing the highlights of fire pictures and also consuming state recognition. This image handling based fire investigation can give the thermal dissemination inside the combustion zone. Also the errors which may emerge while utilizing radiation pyrometers are maintained a strategic distance from by this method.Moreover, thermographic introduction gives an unmistakable image of the procedure occurring inside furnace to the operator and consequently serves to effectively control the procedure. Hence, it can conclude the above results to perform the following benefits:
A single camera alone has the potential of providing wider temperature profile that can be analyzed.
[image:8.595.47.293.81.314.2] [image:8.595.48.290.473.695.2] Quality of clinker can be maintained and thereby increase the production rate.
Kiln control performance can be optimized by using the proposed system.
REFERENCES
1.M. Akalp, L. Dominguez, R. Longchamp, “Supervisory fuzzy control of a rotary cement kiln,” in 7th IEEE conference on Electro technical, Mediterranean, 1994, pp 754-757.
2.Weitao Li, Dianhui Wang, Tianyou chai, “Flame Image Based Burning state Recognition for Sintering Process of Rotary Kiln Using Hetrogeneous Features and Fuzzy Integral”, IEEE Transaction on Industrial Informatics, Vol. 8, No. 4, November 2012.
3.S T Li, Y N Wang, “ Segmentation of kiln flame image based on neural networks” Chinese Journal of Scientific Instrument, Vol.22, 2001, pp 10-14.
4.Hossain, Md. Moinul, Gang Lu, and Yong Yan."Measurement of flame temperature distribution using optical tomographic and two-color pyrometric techniques", 2012 IEEE International Instrumentation and Measurement Technology Conference Proceedings, 2012.
5.Zhong Zhou, Delei Tian, Zhaohui Wu, Zhiyi Bian, and Wei Wu, “3-D Reconstruction of Flame Temperature Distribution Using Tomographic and Two color Pyrometric Techniques”, IEEE Transactions on Instrumentation and Measurement, Vol 64, No. 11, November 2015. 6.Yao Jie, Zhung Yonghong, “Application of DSP-Based Flame Image
Processing Technology to ceramic kilns Temperature Detection”, in 5th International Conference on Intelligent Computation Technology and Automation, 2012.
7.Weitao Li, Dianhui Wang, Tianyou chai, “Flame Image Based Burning state Recognition for Sintering Process of Rotary Kiln Using Hetrogeneous Features and Fuzzy Integral”, IEEE Transaction on Industrial Informatics, Vol. 8, No. 4, November 2012.