FDM
C0 C1 C2 C3
OFDM
50% Bandwidth Saving
Saving of Bandwidth
C0 C1 C2 C3
Abstract: In the revolution and advancements of wireless communications, the Orthogonal Frequency Division Multiplexing (OFDM) plays a major role. The main drawbacks of OFDM are Inter-Symbol Interference (ISI) and Inter Carrier Interference (ICI), will degrade its performance, motivates the idea for reducing PAPR. In order to improve the performance of 4G-LTE system, PAPR has to be minimized hence various reduction schemes of PAPR such as Selective Mapping (SLM), Clipping and Filtering (CLF), and Partial Transmit Sequence (PTS) are discussed in this paper. This paper aims at the performance comparison of various reduction schemes of PAPR. Complementary Cumulative Distribution Function (CCDF) plots are used to figure out the best reduction scheme. From simulation results, it is observed that CCDF and PAPR of original signal are 0.875 and 10.61, with CLF 0.75 and 8.42, with SLM 0.75 and 9.695, with PTS 0.75 and 4.43 respectively. Hence, PTS gives better performance when compared to other schemes.
Index Terms: CCDF; CLF; ICI; ISI; OFDM; PAPR; PTS; SLM
I. INTRODUCTION
Most of the 4G wireless communications uses OFDM modulation scheme, is multi-carrier modulation technique, which is used to meet high spectral efficiency and high data rate (Gottapu Sasibhushana Rao, 2013). In this scheme, parallel data streams or channels are transmitted through closed spaced orthogonal sub-carrier signals. Figure 1 show the bandwidth comparison between FDM and OFDM. It shows that OFDM saves 50% bandwidth when compared to FDM for the same number of carriers used.
Figure-1. Bandwidth Saving in OFDM
Revised Manuscript Received on May 28, 2019.
Chanamala Vijay, Electronics and Communication Engineering, Andhra University College of Engineering (A), Visakhapatnam, India.
Gottapu Sasibhushana Rao Electronics and Communication Engineering, Andhra University College of Engineering (A), Visakhapatnam, India.
Now a days OFDM has gain attention due to following reasons
• High spectral efficiency due to the absence of guard band
• Simple and efficient hardware implementation using the FFT operation
• Avoids Inter Symbol Interference, thereby avoids the equalizers and hence the complexity of receivers is reduced
• Each sub carriers can have different modulation or coding schemes leading to the design of highly robust adaptive transmission schemes
• Enables frequency diversity by spreading the sub carriers across the usable spectrum
• Good resistance is provided against co-channel interference and impulsive noise
The major drawback of OFDM is PAPR that encounters due to envelope fluctuations in the signal. High PAPR in OFDM takes place due to large dynamic range of its symbols and also gives rises due to the coherently added independently modulated subcarriers of OFDM signals (R. Van nee and R. Prasad, 2000). This effect occurs more in uplink communication which leads to requirement of more power at mobile terminal. In order to overcome this hurdle, various PAPR reduction schemes have been introduced.
Performance Analysis of Various PAPR
Reduction Schemes for 4G-LTE Cellular Mobile
Systems
II. PEAKTOAVERAGEPOWERRATIO(PAPR) OFDM signal consist of independent subcarriers which are combined constructively gives rise to high PAPR, which is also known as crest factor causing sensitive to non-linearity of high power amplifier. PAPR is the interconnection between the transmitted symbols maximum power to the mean power of that OFDM signal (J. Heiskala and J. Terry, 2002, Y.Wu and W.Y. Zou, 1995). Let block of data of length N be denoted by vector Bk, as Bk=[B0,B1,B2,….,BN-1] over time interval [0, τ], then multi carrier modulated OFDM symbol can written as
− = = 1 0 2 0 ) ( N k t kf j ke B t B (1)Where, fo is the carrier frequency, Bk is modulated data symbol which is complex in nature on subcarrier ’k’ from a given BPSK or M-ary QAM constellations. Samples of b(t) can be calculated using inverse fast fourier transformation process as B=[B0,B1….BN-1 ].The OFDM signal is the summation of information samples which are presumed to be identically distributed and statistically independent. The transmitted power of OFDM signal determined as
− = − − − = 1 0 ) ( 2 1 0 2 1 ) ( N m N t k m j k N k mB eB N t B (2)
The envelope fluctuations of OFDM signal B(t) can be characterized as PAPR. The ratio of peak instantaneous power to average power represents the PAPR of signal b(t), which is expressed as (Yasir Rahmatallah et al., 2013, G. L. Ren et al.,2003)
` {() } )] ( [ max } ), ( { 2 2 , t b E t b t b
PAPR = t
(3) Where defines the power of peak signal,
is the average signal power. In OFDM systems the high PAPR essentially arises because of the inverse fast fourier transformation process before transmission of information symbols. Hence, to improve the efficiency of the system different types of methods are proposed in the following sections.
Figure 2 depicts the block schematic of OFDM, which shows the occurrence of PAPR due to the mismatch frequencies at the receiving end along with the combination of Gaussian noise w(t) and Normalized Carrier Frequency Offset (
) .Figure-2. Block Schematic of ODFM
III. PAPRREDUCTION TECHNIQUES
This section discusses about CLF, SLM and PTS, they are described as follows
A. Clipping and Filtering (CLF)
This signal distortion scheme used in the reduction of PAPR, by limiting the maximum power of the transmitted signal to a specified threshold value. Bit Error Rate (BER) degrades due
interference where CLF operation is used. Discrete time domain clipped signal is expressed as
B(k) B(n) Adding b(t)
Cyclic Prefix and P/S Adding Pilots and IFFT Signal Mapper Channel k(t) S(k) DAC S/P z(t) X x j e 0 1 2 f = 1
Gaussian noise w(t)
− −
=
C n b C
C n b n b
C n b C n bclipped
) ( ,
) ( ), (
) ( , ) (
(4)
Where C is the predefined clipping level
The process of data transmission in CLF is shown in Figure 3
Figure- 3. Block Schematic of clipping and filtering (CF) based OFDM system
B. Selective Mapping (SLM)
There are six signal scrambling schemes in PAPR reduction. SLM is one of them. In SLM, the input data
sequences are expanded to generate alternate input data sequences by using subcarrier phase sequences. The alternative input data sequence is generated with inverse fast fourier transformation process, and the data with least PAPR is transmitted. Figure 4 presents a block schematic for SLM. Here, the input data block [B=B(0),B(1),….,B(N-1)] is accumulated with ‘W’. The phase sequences w
x
j w
x e
P = for x=0,1,2…N-1 is accumulated with input data block to produce Bw=[Bw[0],Bw[1],….Bw[N-1]]T (Leman Dewangan et al., 2012).
The IFFT of independent sequences Bw are take to produce Bw= [Bw[0],Bw[1],….Bw[N-1]]T out of which the data having least PAPR is preferred for transmission and fixed phase factors Pxwto be transmitted as side information, SLM scheme requires ‘W’ times inverse fast fourier transformation process and logW2 number of bits needed for side information in each block of data. In order to reduce PAPR, SLM rely on phase factors W and its scheme.
Figure- 4. Block Schematic of Selective Mapping (SLM)
C. Partial Transmit Sequence (PTS)
PTS is used to reduce the PAPR and is alternate approach in signal scrambling schemes, the input block of data with ‘N’ symbols are splits into ’V’ sub-blocks is shown as
B = [B1,B2….Bv]T (5)
Where, BV is the repeated sub-blocks of same size. In this scheme the sub-blocks are considered to be rotated w.r.t rotation factors those are statistically independent. The complex phase factor
x=
e
j
x is accumulated by partitioned sub-block, where x=1,2,…X (S. Muller and J. Huber, 1997, Md. MunjureMowlaa et al., 2014).
QPS K
IFFT Clip- ping
Filter- ing
Ampli- fier
I/P OFDM
signal
Selective Mapping
0 P
0 B 0
B
Bit stream IFFT
OFDM signal
B Signal Mapper
(PSK)
S/P P1
1 B 1
B Select the
branch with minimum
PAPR IFFT
1 −
x
P
1 −
x
B
1 −
x
B
= = = = = = X x x x X x x x X x xxB IFFTB b
IFFT b 1 1 1 ] [ (6)
Where bxrefers to Partial Transmit Sequence (PTS). Phase vector is selected to minimize PAPR is shown as,
− = =
= X x x x xx b n
N n 1 ~ ~ 2 ~ 1 ~ ~ 2 ~
1 ( )
1 ,.... 1 , 0 max ] ,.. , [ min arg ] ,.. , [ (7)
The time domain signal having minimum PAPR can be indicated as
= = X x x xb b 1 ~ ~
(8)
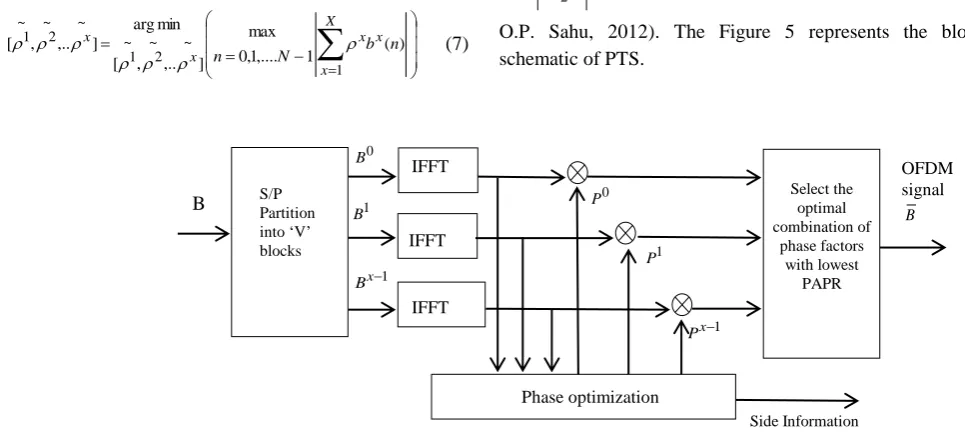
The allowed phase factors set is ={ej2i/W,i=0,1,...W−1}and to find optimal value of phase vectors, Wx−1sets of phase factors should be found out. If the number of sub-blocks increases search complexity will increase exponentially. The PTS scheme needs W-IFFT operations for each block of data and logW2 X bits of side information (Sanjeev Saini and Dr. O.P. Sahu, 2012). The Figure 5 represents the block schematic of PTS.
Figure- 5. Block Schematic of Partial Transmit Sequence (PTS)
IV. RESULTS AND DISCUSSION
This section discusses the performance of OFDM with respect to PAPR and CCDF. CCDF provides more insight for the study of signal performance by considering power level across the time as basis. Figure 6 shows the plot between CCDF and PAPR for different modulation techniques.
Figure- 6. OFDM performance for different modulation schemes
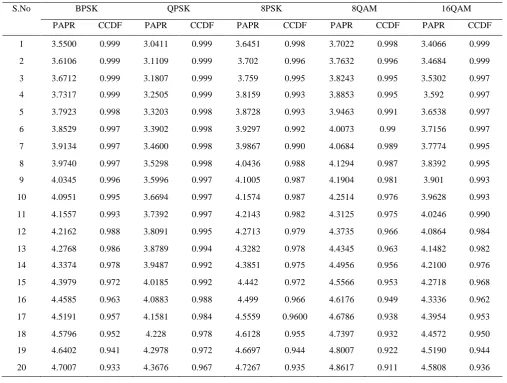
From Figure 6, as PAPR increases CCDF decreases and it is shown that low PAPR is observed for 16QAM as compared to other techniques. Different CCDF and PAPR values of the above figure are listed in Table 1.
Table 1 shows the comparative analysis for various modulation techniques. The simulated values of PAPR and CCDF for BPSK are 4.6402 and 0.941, for QPSK are 4.2978 and 0.972, for 8PSK are 4.6697 and 0.944, for 8QAM are 4.8007 and 0.922 and for 16QAM are 4.5190 and 0.944. The comparative analysis of PAPR reduction techniques CLF, SLM and PTS is shown in Figure 7. The performance of these schemes is analyzed by taking the parameters PAPR and CCDF.
B S/P Partition
[image:4.595.55.538.211.430.2] [image:4.595.51.281.584.754.2]Table- 1. Comparative Analysis of OFDM for various modulation techniques
Figure 7 shows the OFDM system performance for various PAPR reduction schemes with respect to PAPR and CCDF. The results shows that by using PTS the PAPR is reduced more when compared to other techniques. Hence PTS is more suitable to reduce PAPR and the tabular form is shown in Table 2.
Figure- 7. Comparison of the Original signal with various PAPR Reduction Schemes
S.No BPSK QPSK 8PSK 8QAM 16QAM
PAPR CCDF PAPR CCDF PAPR CCDF PAPR CCDF PAPR CCDF
1 3.5500 0.999 3.0411 0.999 3.6451 0.998 3.7022 0.998 3.4066 0.999
2 3.6106 0.999 3.1109 0.999 3.702 0.996 3.7632 0.996 3.4684 0.999
3 3.6712 0.999 3.1807 0.999 3.759 0.995 3.8243 0.995 3.5302 0.997
4 3.7317 0.999 3.2505 0.999 3.8159 0.993 3.8853 0.995 3.592 0.997
5 3.7923 0.998 3.3203 0.998 3.8728 0.993 3.9463 0.991 3.6538 0.997
6 3.8529 0.997 3.3902 0.998 3.9297 0.992 4.0073 0.99 3.7156 0.997
7 3.9134 0.997 3.4600 0.998 3.9867 0.990 4.0684 0.989 3.7774 0.995
8 3.9740 0.997 3.5298 0.998 4.0436 0.988 4.1294 0.987 3.8392 0.995
9 4.0345 0.996 3.5996 0.997 4.1005 0.987 4.1904 0.981 3.901 0.993
10 4.0951 0.995 3.6694 0.997 4.1574 0.987 4.2514 0.976 3.9628 0.993
11 4.1557 0.993 3.7392 0.997 4.2143 0.982 4.3125 0.975 4.0246 0.990
12 4.2162 0.988 3.8091 0.995 4.2713 0.979 4.3735 0.966 4.0864 0.984
13 4.2768 0.986 3.8789 0.994 4.3282 0.978 4.4345 0.963 4.1482 0.982
14 4.3374 0.978 3.9487 0.992 4.3851 0.975 4.4956 0.956 4.2100 0.976
15 4.3979 0.972 4.0185 0.992 4.442 0.972 4.5566 0.953 4.2718 0.968
16 4.4585 0.963 4.0883 0.988 4.499 0.966 4.6176 0.949 4.3336 0.962
17 4.5191 0.957 4.1581 0.984 4.5559 0.9600 4.6786 0.938 4.3954 0.953
18 4.5796 0.952 4.228 0.978 4.6128 0.955 4.7397 0.932 4.4572 0.950
19 4.6402 0.941 4.2978 0.972 4.6697 0.944 4.8007 0.922 4.5190 0.944
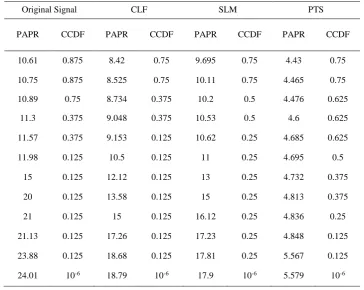
[image:5.595.39.547.86.469.2]Table-2. Comparative analysis of different PAPR Reduction Schemes
Table 2 presents the comparative analysis of various reduction techniques. From the Table, it is concluded that the PAPR and CCDF values are minimum in PTS schemes. Minimum PAPR results in power efficiency. CCDF performance of OFDM signal for different PAPR has been discussed in this section. The overall result observed is shown in Figure 8.
Figure- 8. Comparison of different techniques
CCDF is described with no. of data sets having probability density function (PDF). CDF can be obtained by integrating PDF and CCDF is compliment of CDF which is shown as CCDF=1-CDF.
V. CONCLUSION
Analysis of OFDM system performance using different PAPR reduction schemes are evaluated in terms of PAPR and CCDF. The executed results are compared with different reduction schemes with variations of PAPR and CCDF. The duration of the signal spends above or at a given power level can be known from CCDF. The difference of relative power levels and probability is plotted using CCDF. From result, it is found that PTS achieves low PAPR when compared to other schemes such as CLF and SLM with respect to CCDF with the original signal having PAPR and CCDF values of 23.88 and 0.125, clipping and filtering the signal having PAPR and CCDF values of 18.68 and 0.125, selective mapped signal having PAPR and CCDF values of 17.81 and 0.125 and PTS signal having PAPR and CCDF values of 5.567 and 0.125.
REFERENCES
1. Gottapu Sasibhushana Rao , ‘Mobile Cellular Communication’, Pearson Education, New Delhi, 2013. 2. R. Van nee and R. Prasad, ‘OFDM Wireless Multimedia communications’,Artech
House, Boston, MA, 2000. 3. J. Heiskala and J. Terry, ‘
Original Signal CLF SLM PTS
PAPR CCDF PAPR CCDF PAPR CCDF PAPR CCDF
10.61 0.875 8.42 0.75 9.695 0.75 4.43 0.75
10.75 0.875 8.525 0.75 10.11 0.75 4.465 0.75
10.89 0.75 8.734 0.375 10.2 0.5 4.476 0.625
11.3 0.375 9.048 0.375 10.53 0.5 4.6 0.625
11.57 0.375 9.153 0.125 10.62 0.25 4.685 0.625
11.98 0.125 10.5 0.125 11 0.25 4.695 0.5
15 0.125 12.12 0.125 13 0.25 4.732 0.375
20 0.125 13.58 0.125 15 0.25 4.813 0.375
21 0.125 15 0.125 16.12 0.25 4.836 0.25
21.13 0.125 17.26 0.125 17.23 0.25 4.848 0.125
23.88 0.125 18.68 0.125 17.81 0.25 5.567 0.125
24.01 10-6 18.79 10-6 17.9 10-6 5.579 10-6
C
C
DF
[image:6.595.45.291.504.663.2]Theoretical and Practical Guide’, Sams Publishing, 2002 4. Y. Wu and W. Y. Zou, ‘ Orthogonal frequency division multiplexing: A multi-carrier modulation scheme’, IEEE Trans. Consumer Electronics, Vol. 41, No. 3, PP. 392–399, Aug. 1995
5. Yasir Rahmatallah, Seshadri Mohan, Member, ‘Peak-To-Average Power Ratio Reduction in OFDM Systems: A Survey and Taxonomy’, IEEE
Communications surveys & tutorials, Vol. 15, No. 4, fourth quarter 2013
6. G. L. Ren, H. Zhang, and Y. L. Chang, ‘A complementary clipping transform technique for the reduction of
peak-to-average power ratio of OFDM system’, IEEE Trans. Consumer Electronics, Vol. 49, No. 4, PP. 922–926, Nov. 2003
7. Leman Dewangan, Mangal Singh, Neelam Dewangan, ‘A Survey of PAPR Reduction Techniques in LTE-OFDM System’, International Journal of Recent Technology and Engineering (IJRTE) ISSN: 2277-3878, Volume-1, Issue-5, November 2012.
8. S. Muller and J. Huber, ‘OFDM with reduced peak-to- average power ratio by optimum combination of partial transmit sequences’, Electronics Letters, vol. 33, no. 5, pp. 368–369, Feb 1997.
9. Md. Munjure Mowlaa, Md. YeakubAlib and Abdulla Al Suman, ‘Better Performance ACF Operation for PAPR Reduction of OFDM Signal’, American Academic & Scholarly Research Journal Vol. 6, No. 1, Jan 2014. 10. Sanjeev Saini and Dr. O.P. Sahu, ‘Peak to Average Power Ratio Reduction in OFDM System by Clipping and Filtering’, International Journal of Electronics
Communication and Computer Technology (IJECCT) Vol.2 Issue 3, May 2012.
AUTHORSPROFILE
Chanamala Vijay received his B.Tech degree in Electronics and Communication Engineering from Lendi Institute of Engineering and Technology, affiliated to JNTU Kakinada, India, in 2012, and the M.Tech degree in Electronics and Communication Engineering from Andhra University, Visakhapatnam, India, in 2014. Currently he is Research Scholar in Andhra University. His research area is Wireless Communications.
Dr.G.Sasibhushana Rao received his B.E. Degree in Electronics and Communication Engineering from Andhra University, Andhra Pradesh, India, and M. Tech. Degree in Electronics and Communication Engineering from JNTU University, Andhra Pradesh, India. He obtained his Ph.D. degree in Global Positioning System from the Osmania University, Andhra Pradesh, India. He is currently working as Professor in Department of Electronics and Communication Engineering, Andhra University. He is the author of about 517 scientific publications in journals, international and National conferences. His research interests include Global Positioning Systems, Wireless communication, Signal Processing. He is an author of the 4 text books ‘‘Global Navigation Satellite
System’’ (published by McGraw-Hill Education), ‘‘Mobile Cellular
Communication’’ (Published by Pearson Education),