International Journal of Innovative Technology and Exploring Engineering (IJITEE) ISSN: 2278-3075, Volume-8 Issue-10, August 2019
Abstract: The rise in the awareness of climate change and the increasing environmental concerns has led to research in the areas of using the waste materials from Ready Mix Plants. This paper is an attempt to focus on the use of these wastes as using ready mix concrete plant waste aggregates obtained by crushing, and finding motorized assets of concretes complete by using many aggregates proportions with various proportions. Recycling materials is an efficient way to increase the life cycle of the material and contributes to environmental protection.
Index Terms: Aggregate, Concretes, Ready mix plants, Recycling materials,
I. INTRODUCTION
Concrete is made of different binding materials, water, aggregates and admixtures. Aggregates play a vital role in concrete and occupy up to 75% of the total volume of the concrete1. Up to 2 billion tons of concrete waste is generated every year. This waste ends up in landfills which results in landfill space exhaustions. The use of recycling this concrete has develop additional important in the latter few years. Now remain several factors underwriting to this, after the obtainability of different material and the impairment produced by the mining of ordinary aggregate to the amplified removal costs of waste resources. Newly, these started aggregates used to be for intermediate value applications, such as practicalities for structures. The advantages of recycling construction and destruction waste are it reduces the amount of construction and destruction waste entering landfill sites; and it reduces the use of normal resources.
1. MATERIALS AND METHODOLOGY
1.1
Cement
[image:1.595.309.545.201.330.2]43 Grade Ordinary Portland cement (OPC) of IS 8112-1989 standards of confirming was use .
Table 1: Test Results of cement SR.
No. Name
Experimental value
IS 8112-1989 specified limits
1 Fine of cement ( Sieving method) 5.24 ! > 10%
2 Normal Consistency 32 --
3 Initial Setting Time 84 mins !< 30mins
Revised Manuscript Received on August 10, 2019. Abhay B. Shelar VIT Vellore,
Dr Amit Mahindrakar Professor in the Civil Engineering dept., VIT Vellore..
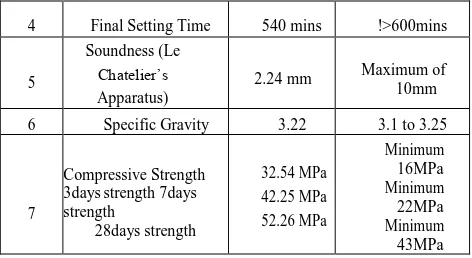
4 Final Setting Time 540 mins !>600mins
5
Soundness (Le Chatelier’s Apparatus)
2.24 mm Maximum of 10mm
6 Specific Gravity 3.22 3.1 to 3.25
7
Compressive Strength 3days strength 7days strength
28days strength
32.54 MPa 42.25 MPa 52.26 MPa
Minimum 16MPa Minimum 22MPa Minimum 43MPa
1.2
Fine Aggregate (FA):
Zone II river sand from a in Pune confirming to Table 4 of IS code 383-1970 . Specific Gravity, Water Absorption, Fineness Modulus tests are conducted. The test result on fine aggregate in the Table 2Table 2: Test results of Fine Aggregate
Sl .No. Test Value
1 Specific Gravity 2.62
2 Water Absorption 1.25%
3 Fineness Modulus 2.58
1.3
Coarse Aggregate (Natural) :
[image:1.595.308.530.405.533.2]Creased aggregate from limited crusher which has maximum size of 20mm. Tests on aggregate are conducted as per IS 383- 1970 procedure and the obtained results are in Table 3,
Table 3: Coarse Aggregate (Natural) Sl. No. Examination
Experimental Results
1 Specific gravity 2.65
2 Impact value 8.52 %
3 Water absorption 1.57%
4 FM 4.46
5 Elongation index 11.24 %
6 Flakiness index 8.24 %
Practical Scrutiny for Concrete Strength
Properties of Ready-Mix Concrete Plant from
Waste Concrete Aggregate
[image:1.595.52.290.646.732.2]Aggregate
1.4 Ready Mix Concrete Plant Waste Concrete Aggregate (RMCWA):
[image:2.595.50.285.160.358.2]Ready Mix Concrete Plant Waste Concrete coarse aggregate was got from wastes 3 days old waste concrete. Popular instruction use to aggregate graded, material waste was braked and made as 20mm & 12.5 mm aggregate. Tests showed as similar as natural aggregate. Results are accessible in Table 4
Table 4: Ready Mix Concrete plant waste concrete aggregate
Sl. No
.
TestReady Mix Concrete
plant waste concrete
aggregate
1
Specific gravity
2.68
2
Impact value
15.14 %
3
Water absorption
2.52
4
FM
1.75 %
5
Elongation
index
11.46 %
6
Flakiness index
9.24 %
1.5 Water:
Mixing and curing Potable water was used. 1.6 CASTING:
[image:2.595.310.541.358.686.2]The cubes of dimensions 150 X 150 X150 mm was cast to novelty out the compression strength. Evaluation the split tensile strength, cylinders of 150 mm diameter with 300 mm height was cast and a beam 150 mm x 150 mm x 700 mm. The proportions of mixes evaluated for 10 to 20 mm slump. The mixtures are intended for M 20 grade concrete as per IS Codes. The recycled-coarse aggregate, sand, cement, coarse aggregate and were dry mixed on platform mixer carefully till uniform mix is achieved. Essential amount water in dry-mix. Concrete existed mold and the compaction was done by mechanical vibrator. The samples was removed from molds after 24 hours & put in water for curing 28 days. Afterward a age for 28 days the samples was allowable for testing.
Table 5: Quantities of concrete (W/c = 0.5)
2
Examinations for Samples
2.1
Compressive Strength Test:
By using UTM machine test is shown using 6000kN (UTM). Cube was kept on the UTM platform & the load was constant rate up fails the specimen and the consistent load noted as ultimate load and finding compressive strength.
By using Universal testing machine (UTM) test was conducted on Cylinder. The load applied up to failure calculated by using formula of 2P/πdl.
2.3 FLEXURAL STRENGTH OF CONCRETE
Using 6000kN Universal testing machine (UTM). It is measured by loading unreinforced 150 x 150 X 700 mm long concrete beams with a size three times the depth.
2.4FINITE ELEMENT ANALYSIS:
Investigative systems provide precise choices with simple geometrics requests. Trial ways are used to test. Behavior in cognizance was algebraic methods is possibly the most required after process for engineering assessment. Software was used to estimate untried grades thru Investigative grades.
II. RESULTS AND DISCUSSION 2.5 Compressive strength:
On three 150×150×150 mm cubes Compressive strength test was conducted. Table provide the compressive Strength test results of 20, 40, & 60 % of Ready Mix Concrete Plant Waste Concrete aggregate concrete with cubes are tested for compressive strength remain undefended in Table 6 to 8 and Figure 1 to 3.
Table 6: Compressive Strength
SR. N0. Mix
Ultimate Load(KN)
Compressive Strength (N/mm2)
1 NAC 466 20.71
2 RMCWA-20 472 20.97
3 RMCWA-40 478 21.24
4 RMCWA-60 482 21.42
Fig 1: Compressive Strength
2.6
Split Tensile
[image:2.595.57.274.580.670.2]International Journal of Innovative Technology and Exploring Engineering (IJITEE) ISSN: 2278-3075, Volume-8 Issue-10, August 2019
[image:3.595.44.293.131.389.2]Tables from 7 figures 1 and 2 gives split tensile strength results with made concrete with 0, 20, 40, and 60% of Ready Mix Concrete Plant Waste Concrete coarse aggregate replacement.
Table 7: Split Tensile strength
Sl. N0. Mix
Ultimate
Load (kN) Split tensile strength ( N/mm2)
1 NAC-100 119 1.68
2 RMCWA-20 124 1.75
3 RMCWA-40 148 2.10
4 RMCWA-60 164 2.31
Fig 2: Split tensile Strength
2.7 CONCRETE FLEXURAL STRENGTH
Curing After 28 days of Split-tensile on shown on 150 mm x 150mm x 700 mm beam cast as per IS 5816 – 1999.with 0, 20, 40, and 60% of Ready Mix Concrete Plant waste coarse aggregate replacement in Following tables 8 & figure 4 to 6
Table 8: Flexural strength
Sl. N0. Mix
Ultimate L0ad.(kN)
Flexural Strength
( N/mm2)
1 NAC-100 17.8 2.36
2 RMCWA-20 20.75 2.78
3 RMCWA-40 22.3 2.97
[image:3.595.321.530.237.623.2]4 RMCWA-60 24.2 3.22
FIG 3: FLEXURAL STRENGTH
2.8 Finite Element Analysis:
2.8.1
Compressive Strength:
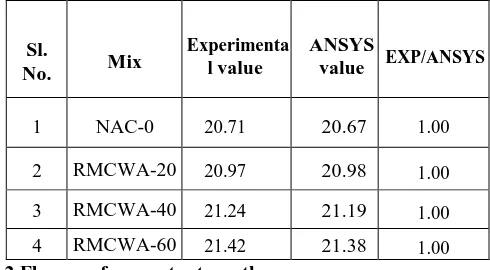
Three figure gives stresses are display, usual of these two values and related by the experimental results in the Table taken as the average cube strength earlier Figure 9 shows the regular investigational results compressive strength and ANSYS average Investigative compressive strength results. From the observed results the ratio EXP/ANSYS result is about 0.92. Difference remains due to the non-uniform spreading of load by compressive testing machine applied during test in the research laboratory and FEM examination was carried using ANSYS software the classic experiences. Since the systematic examination shows that the standards satisfied results.
Fig 4: Difference of compressive strength
Fig 5: Difference of split tensile strength
Fig 6: Flexure strength of NAC
[image:3.595.73.258.640.758.2]Aggregate
Fig 7 : Experimental and ANSYS Comparison of Compressive Strength
2.8.2 Split Tensile strength:
[image:4.595.62.280.84.241.2]Difference of pressure was shown on Figure 8 the figure together minimum & maximum stresses are showed. Normal of regular compressive strength of the cube and is related by the trial values in the Table 10 and Figure 7 shows the average trial compressive strength results and ANSYS regular investigative compressive strength results. Results observed the ratio EXP/ANSYS results are about 0.95 to 1.04. Variation remained outstanding to the non-uniform movement of load by compressive testing machine applied throughout research in research laboratory and here an FEM analysis was accepted using ANSYS software in this software the model involvements aimed at interlocking, this is also one of the reasons to get the correct results. From the reasonable investigation it is perfect that the difference ANSYS and EXP letters are obtained investigational values contented with systematic results.
[image:4.595.48.280.462.570.2]Table 10: Experimental and ANSYS Comparison for Split Tensile strength
Fig 7 Relationship of Experimental and ANSYS results Compressive Strength
3.2 Flexure of concrete strength:
Variation of stress are in Figure 7 Regular for these two standards is taken as the compressive strength of the cube and is related with the new values in the Table 11 and Figure 8 average examination compressive strength consequences and ANSYS regular strength outcomes. After results it is observed that the ratio EXP/ANSYS results are about 0.92 to 1.05 difference is small. Variation was due to the non-uniform spreading of load by compressive testing machine applied during experiment in the laboratory and here an FEM examination was carried using ANSYS software perfect involvements for meshing, this is also one of the details to get the correct results. Systematic investigation shows variation EXP and ANSYS results are small so that the got investigational standards pleased by investigative outcomes.
Table 11: Experimental and ANSYS Comparison of Split Tensile strength
Sl. No. Mix Experimental
value ANSYS value EXP/ANSYS
1 NAC-0 2.36 2.36 1.00
2 RMCWA-20 2.78 2.77 1.00
3 RMCWA-40 2.97 2.82 1.05
4 RMCWA-60 3.22 3.23 1.00
Fig 8: Experimental and ANSYS results Comparison of Split Tensile Strength Sl.
No. Mix
Experimenta l value
ANSYS
value EXP/ANSYS
1 NAC-0 20.71 20.67 1.00
2 RMCWA-20 20.97 20.98 1.00
3 RMCWA-40 21.24 21.19 1.00 4 RMCWA-60 21.42 21.38 1.00
Sl. No. Mix Experimental
value ANSYS
value
EXP/ANSYS
1 NAC-0 1.68 1.68 1.00
2 RMCWA-20 1.75 1.77 0.99
3 RMCWA-40 2.1 2.2 0.95
[image:4.595.61.276.603.778.2]International Journal of Innovative Technology and Exploring Engineering (IJITEE) ISSN: 2278-3075, Volume-8 Issue-10, August 2019
III. CONCLUSIONS:
Conclusion remained made from the existing work.
1. The RMCWA found through routing the offcuts of concrete that remained discarded outside deprived of passable compaction and remedial treatment was uniform properties to with Natural Aggregates.
2. Water absorption capacity of RMCWA was greater than NCA
3. Mortar attached remains on apparent of aggregates due to properties RMCWA concrete is lesser than NCA.
4. Concrete compressive made with 60% strength of additional of RMCWA gives higher strength than standard mix (0% RMCWA).
5. Concrete Split tensile strength made with 60 % standby of RMCWA provides developed strength reference or normal mix (0% RA).
6. Compressive strength and split tensile are experiential that the ratio is 0. 92 to 1.05 This designates investigational values are pleased with systematic results.
REFERENCES
.1. Van Jaarsveld J GS, Van Deventer J S J and Schwartzman A, The potential use of Geopolymeric Materials to Immobilise
2. Toxic Metals:Part I. Theory and application”, Minerals Engineering, Vol. 10, No. 7, pp. 659-669, 1997.
3. Xu H and Van Deventer J S J , The Geopolymerisation of AluminoSilicate Minerals”, International Journal of Mineral 4. Processing, Vol. 59, No. 3, pp. 247-266, 2000
5. Swanepoel J C and StrydomC A , Utilisation of fly ash in a geopolymeric material. Applied Geochemistry, Vol. 17: pp. 6. 1143- 1148, 2002.
7. Zhou X and Zhang J , Geopolymer Technology: The Current State Of TheArt”, Journal of Material Science, Vol. 42, pp. 2917-2933, 2007.
AUTHORS PROFILE
Abhay B. Shelar is pursuing Ph.D. from VIT Vellore, completed masters in construction management from Shivaji University, Kolhapur, He has a total experience of 18 yrs, out of which 14 yr of teaching and 04 yrs of industrial
.