Abstract: Multimodal biometric systems have been widely applied in many real-world applications due to its ability to deal with a number of significant limitations of unimodal biometric systems including non-universality, noise, population coverage, vulnerability and intra-class variability for verification, authentication and identification of an individual. In this paper, the impact of deep learning in the field of biometrics is investigated where supervised learning is primarily involved in identifying biometric traits using Graphical User Interface. The trained deep learning system proposed is called MultiTraitConvNet whose architecture is based on a combination of Convolutional Neural Network (CNN) and Softmax classifier to extract discriminative features from the input image without prior domain knowledge and classify the class of the biometric trait. A discriminative CNN training scheme is based on a combination of back-propagation algorithm and mini-batch Adam optimization method that is used for weights updating and learning rate adaption, respectively. To evaluate various CNN architecture data augmentation and dropout method training techniques have been used. A centralized database of different biometric trait images has been created using data sets of CASIA1 for iris trait, google 11K hand for palmprint trait, for face UTKFace is used. The accuracy of the proposed system is found to be 100%. Python library Keras is used to develop CNN model and TKinter is used to create GUI of the proposed system.
Index Terms: Deep learning, Convolutional Neural Network (CNN), GUI, face recognition, fingerprint recognition, footprint recognition, iris recognition, palmprint recognition.
I. INTRODUCTION
The recognition of people is a basic need of many day-to-day activities in the society and growth in the biometric research. In a variety of government and private domains biometric recognition is being promoted as a technology that can help to identify terrorists, provide better control of access to physical facilities and financial accounts, and increases the efficiency of access to services and their utilization. Thus, it is clear that biometric technology has the potential to profoundly influence the ways in which we are recognized for conducting various transactions on a daily basis. The motivation for using biometrics are diverse and often overlap. They include improving the convenience and efficiency of routine access transactions, reducing fraud, enhancing public safety and national security. Nowadays
Revised Manuscript Received on July 20, 2019.
Rohit Khokher, Research and Development Cell, Vidya Prakashan Mandir (P) Ltd., Meerut, India.
Ram Chandra Singh, School of Basic Sciences and Research, Sharda University, Greater Noida, India.
Aashish Jain, Department of Education, Government of NCT Delhi, New Delhi, India.
biometric authentication technologies are available commercially for fingerprint, palmprint, iris, face, voice recognition etc. that acquires data of an individual and compare the extracted set features with the recorded templates that already exist in the database.
The biometric systems can be broadly divided into two main categories: unimodal and multimodal biometric systems. Unimodal systems use one biometric trait to identify an individual whereas multimodal systems use multiple biometric traits. Presently, researchers are paying more attention to study multimodal systems due to their ability to achieve better performance compared to unimodal systems as it is difficult to spoof or forging multiple biometric traits of a legitimate user at the same time [1-3]. In multimodal biometric systems, the output of each classifier can be seen as a list of ranks of each enrolled person to all possible matches stored in database from highest method to the lowest matched trait. In this case, the ranking level fusion methods are applied to fuse the ranks produced by each classifier to identify the legitimate user. Machine learning methods are also becoming very popular in selecting appropriate feature representation that will facilitates the decision function in dealing with temporal information and is fusing multimodal information.
Recently, deep learning methods have demonstrated remarkable success for supervised learning tasks in multiple domain including computer vision, natural language processing, speech processing and its impact can also be recognized or identified from various biometric traits [4,5]. Deep learning approaches learn features from the data, and, when trained discriminatively, they might learn subtle features that can be used to distinguish large numbers of individuals. Sun et al. [6-8] proposed CNN architectures to identify face using DeepID features and Joint Bayesian classifiers. Parkhi et al. [9] proposed triplet loss machine learning and 13 convolution layers to verify the faces. A few other approaches have also been used similar techniques for face recognition [10-12]. A four-layer CNN model was proposed for palmprint recognition by Jalali et al. [13]. Minaee and Wang [14] used a two-layer deep scattering CNN for palmprint recognition.
Various deep learning techniques to identify an individual using palmprint images have also been studied [15-17]. Minnae et al. [18] used deep convolutional features for iris recognition. Gangwar and Joshi [19] used two very deep CNN architectures for iris recognition, one with eight convolutional layers and another with five convolutional layers.
Verification of Biometric Traits using Deep
Learning
In this work a deep learning system is proposed to identify a given biometric trait from a centralized database comprising of five different biometric traits using GUI. The proposed system uses CNN and softmax classifier to extract distinct features of a given trait and match with other images in the database. The rest of the paper is organized into 4 Sections: the system development and architecture is explained in Section 2. The proposed methodology is presented in Section 3. The experimental results are present in Section 4 and finally conclusion and future research direction are reported in Section 5.
II. SYSTEM DEVELOPMENT AND
ARCHITECTURE
A CNN model is designed for verification of biometric traits which is a pattern recognition system that is used to match the features of sample image with any of the input image of that trait. The process of trait recognition system consists of following stages:
A. Collection of Dataset
In order to train the CNN model, data of 05 biometric traits i.e. face, fingerprint, footprint, iris and palmprint have been collected and divided into two sets; training and testing. The training set contains 80 images and testing set contains 20 images of each biometric trait. The UTKFace database [20] has been used for taking images of face, the NIST special database 4 [21] has been used to collect fingerprint images, the scanned footprint images [22] have been collected, iris images have been taken from CASIA1 Iris database [23] and the 11K hands google database [24] has been used for collecting palmprint images. The training set has been created so that the proposed model can learn by identifying certain common features and relations related to the particular
biometric trait.
B. Building the CNN model
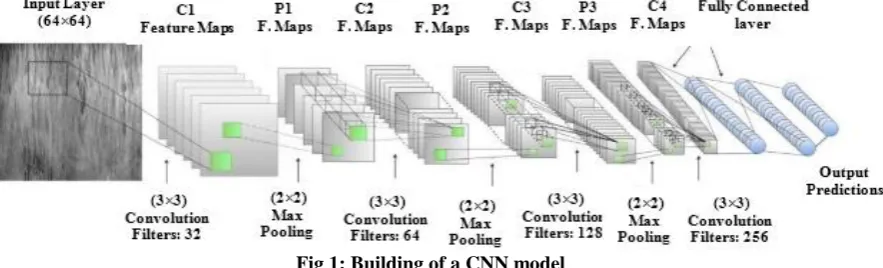
[image:2.595.82.524.472.606.2]The model consists of convolution layers, pooling layers, dropout layers and fully connected layers. The input biometric trait image has been reshaped to a size of 64×64 pixels and fed into first convolution layer. The convolution layer performs image enhancement operations like blurring, sharpening, edge detection, noise reduction to extract features from the input image and helps CNN model to learn special characteristics of the given image [25]. The convolution layers have a kernel size of 3×3. Each convolution layer extracts N numbers of features which is called as feature map [26]. The proposed model contains four convolution layer and produces a feature map of size 32, 64, 128, and 256 pixels, respectively. An additional operation called ReLu activation is used after each convolution layer to decide that which neurons are activated at a given time. The extracted feature map from each convolution layer is further fed into a pooling layer that reduces the image dimensionality without losing important features or patterns. This extraction is performed to reduce or compress the size of an input image. An additional dropout layer has been added after each pooling layer to probabilistically remove or drop out negative inputs to a layer. The dropout rate is set 0.25 to each layer which sets 25% of inputs to zero. A Flatten layer has been added before fully connected layers to transform a 2-D matrix of features into a 1-D vector that can be fed into a fully connected neural network classifier. The final layers of the CNN model are fully connected layers or dense layers where all nodes or neurons are ―fully connected‖ and generate the prediction of a given input image. The process of building a CNN model is shown in figure 1.
Fig 1: Building of a CNN model C. Training and evaluation of CNN model
The next step after building the CNN model is to train and evaluate the proposed model. The compilation of model takes a loss function and an optimizer. The loss functions are helpful to train a neural network by having an input and output class which are used to calculate the difference respectively. In this study, the proposed model is a multi-class prediction model where the output is usually a probability value f(x) called the score for the input image x. An optimizer is an optimisation algorithm which is used to update weights and biases parameters to reduce the error in the model. The proposed model uses ‗adam‘ optimizer, which stands for adaptive moment estimation. This optimizer is faster than other optimizers. After compilation, the training of CNN
model is required. In this work, fit_generator(training_set,
steps_per_epoch, epochs, validation_data, validation_steps)
method have been used to train the model where training_set is generator function which generates the desired shape images on the fly in a fixed batch size, steps_per_epoch is the number of training data points divided by the batch size, epochs is the number of times this process has to be repeated,
validation_data is the data on which to evaluate the loss and
D. GUI of Biometric Traits Verification
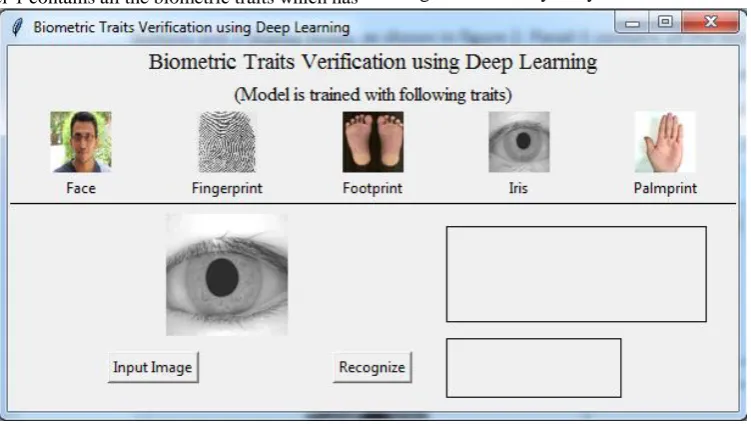
The GUI of biometric traits verification has been developed using Python 3.7 that allows steer focus and is intuitive. It consists of 2 panels, 2 buttons and 2 display boxes, as shown in figure 2. Panel-1 contains all the biometric traits which has
[image:3.595.111.487.108.320.2]been studied in this system. Panel-2 contains ‗Input Image‘ and ‗Recognize‘ button which are used to provide input image to the system and to recognize it with the traits available in the centralized database, respectively. The GUI is developed using Tkinter library in Python 3.7.
Fig 2: GUI of biometric trait verification using deep learning
III. METHODOLOGY
In this work two discriminative learning techniques have been proposed that are based on the combination of CNN and
the softmax classifier to classify multiple classes of biometric
traits which are stored in a centralized database of the system [27].
The methodology includes the following modules:
A.Deep learning for traits verification
The proposed model is developed using deep learning approach to verify the biometric traits. The model uses CNN for feature extraction and softmax classifier is used for classification. The architecture of proposed CNN is combination of convolution layers, pooling layers, and dropout layers which is discussed in section 2. The model consists of two fully connected layers for classification. The output of the first connected layer is fed into the softmax classifier (last fully connected layer) which produces a probability distribution over the N class labels. Finally, a cross-entropy loss function, suitable loss function for multi-label classification task, is used to quantify the agreement between the predicted class scores and target labels and calculate the cost value for different configurations of CNN. The performance of CNN is mainly influenced by three aspects namely: i) Training methodology, ii) network configuration or architecture, and iii) input image size which needs to be checked as these aspects help neural network in learning process and increases its ability of generalization. Training techniques like data augmentation, dropout method and Adam method have also been investigated in this study. These techniques are discussed below:
i. Training Methodology
A centralized database of 05 different biometric traits namely face, fingerprint, footprint, iris and palmprint has been
created. The database contains 500 images, 80 images of each trait are used for training and 20 images are used for testing. The training procedure is performed using the back-propagation algorithm with the ‗Adam‘ (Adaptive moment estimation) optimization method, where the training data is divided into mini-batches and the training errors are calculated upon each mini-batch in the softmax layer and propagated back to the lower layers to minimize the errors. In every epoch passing through every image of training set, the images of testing set are used to measure the accuracy of the current CNN architecture by evaluating the cost value and the validation error rate. The Adam optimization method is used to scale the learning rate using the following equation to be derived later:
(1)
where w is model weights and is the step size.
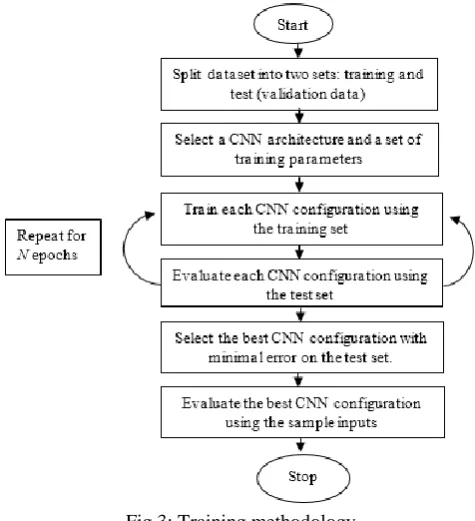
The training procedure terminates when the cost value and the validation error starts increasing again to avoid the overfitting problem. After completion of training the images of testing set are used to predict the output category by calculating the identification rate which is maximized during the learning process. The flow chart of training methodology is shown in figure 3:
ii. Network Architecture
Fig 3: Training methodology
The main aspect in identifying the best CNN architecture is the number of convolution layers which are used to employ transforming from the sample image to a high-level feature representations along with the number of convolution filters in each layer. In this study four convolution layers with 32, 64, 128, and 256 filters, respectively, have been used to avoid a rapid decline in the amount of input data.
iii. Input image size
The size of input image is one of the hyper-parameters in the CNN that has a significant influence in the speed and the accuracy of the neural network. The influence of input image size is investigated using the size 64×64 pixels (generated from original images of larger size) in which patterns become visible and features is extracted for further processing.
iv. Training strategies
To prevent overfitting problem during the learning process of the CNN model and to enhance its ability of recognition following techniques have also been performed:
a. Dropout method is a regularization method that
approximates training a large number of neural networks with different architectures in parallel and can be used to prevent neural networks from overfitting the training set [28]. During training, few are randomly ignored or
―dropped out.‖ This has the effect of making the layer
look-like and be treated-like a layer with a different number of nodes and connectivity to the prior layer. By ‗ignored‘ or ‗dropped out‘, means these units are not considered during a forward or backward pass. At each training stage, individual nodes are either dropped out of the net with probability 1-p or kept with probability p, sothat a reduced network is left.
(a) (b) Fig 4: Dropout method to a standard neural network Applying dropout to a neural network amounts to sampling a ―thinned‖ network from it. The thinned network consists of all the units that survived dropout (Figure 4b). A neural net with n unit, can be seen as a collection of 2n possible thinned neural networks. At test time, it is not feasible to explicitly average the predictions from exponentially many thinned models. However, a very simple approximate averaging method works well in practice. The idea is to use a single neural net at test time without dropout. The weights of this network are scaled-down versions of the trained weights. If a unit is retained with probability p during training, the outgoing weights of that unit are multiplied by p at test time. This ensures that for any hidden unit the expected output (under the distribution used to drop units at training time) is the same as the actual output at test time. By doing this scaling, 2n networks with shared weights can be combined into a single neural network to be used at test time. In this work, training a network with dropout and using this approximate averaging method at test time leads to significantly lower generalization error on a wide variety of classification problems compared to training with other regularization methods.
b. Adam algorithm is an adaptive learning rate method that it
computes individual learning rates for different parameters and uses estimations of first and second moments of gradient to adapt the learning rate for each weight of the neural network is given in by the following equation:
(2) where m is moment and X is random variable. To estimate the moments, Adam utilizes exponentially moving averages, computed on the gradient evaluated on a current mini-batch:
(3)
(4) where m and v are moving averages, g is gradient on current mini-batch, and beta- new introduced hyper-parameters of the algorithm. The expected values of moving averages is given as:
(5)
The value of m (defined in equation 3) goes expanding further, the less first values of gradients contribute to the overall value, as they get multiplied by smaller and smaller beta. The equation for moving average m can be rewritten as:
(7) The estimator needs to be corrected so that the expected value is the one required. This step is usually referred to as bias correction. The final equation for estimator will be as follows:
(8)
(9)
In the end, these moving averages are used to scale learning rate individually for each parameter. The weights are updated by following equation:
(10)
where w is model weights, and η is the step size (depends on iteration).
c. Data Augmentation is one of the methods of artificially
increasing the variations of images in data-set by using horizontal/vertical flips, rotations, horizontal/vertical shifts, variations in brightness of images etc. Keras provides the
ImageDataGenerator class that defines the configuration
for image data preparation and augmentation. The training set images have been rescaled, zoomed, sheared, and horizontally flipped and the test set images have been rescaled through this generator. The images have been augmented in this way so that the model would never see twice the exact same image and it helps the model to prevent overfitting and helps the model generalize better [29, 30].
The flow_from_directory() method has been used to
generate the batches of image data and prepare the data generator from the training set and test set images. After preparing the data generator, fit_generator() method has been called by passing the data generator, length of epoch, number of epochs, validation data set and validation steps to train the model.
d. The ReLU activation function is applied on the top of the
convolution layers and fully connected layers in order to add non-linearity to the network. It is a simple calculation that returns the value provided as input directly, or the value 0.0 if the input is 0.0 or less. This can be described mathematically as function g() using the max() function over the set of 0.0 and the input z:
(11) The function is linear for values greater than zero, meaning it has a lot of the desirable properties of a linear activation function when training a neural network using backpropagation. Yet, it is a nonlinear function as negative values are always output as zero. The main advantage of this function is that it results in neural network training several
times faster than other activation functions without making a significant difference to generalization accuracy.
IV. RESULTS AND DISCUSSIONS
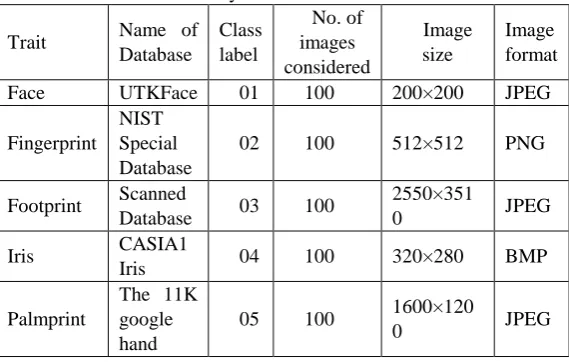
[image:5.595.302.587.309.490.2]The performances of the proposed CNN model are tested on the most common biometric traits: face, fingerprint, iris, palmprint, and footprint databases currently available in the public domain in order to demonstrate their effectiveness and compare their performances with different CNN architectures. The recognition time of the proposed approaches are measured by implementing them on a laptop and on a personal computer with the windows 7/8 operating system, a 3.60 Ghz core i7 processor and 8 GB RAM. The system is designed in Python 3.7. It is also to be noted that the execution time of the proposed system is proportional to the number of different biometric traits and their images in the centralized database for training. The description of the images and classes in centralized database is summarized in Table 1.
Table 1: Summary of centralized database
Trait Name of
Database
Class label
No. of images considered
Image size
Image format
Face UTKFace 01 100 200×200 JPEG
Fingerprint NIST Special Database
02 100 512×512 PNG
Footprint Scanned
Database 03 100
2550×351
0 JPEG
Iris CASIA1
Iris 04 100 320×280 BMP
Palmprint
The 11K google hand
05 100 1600×120
0 JPEG
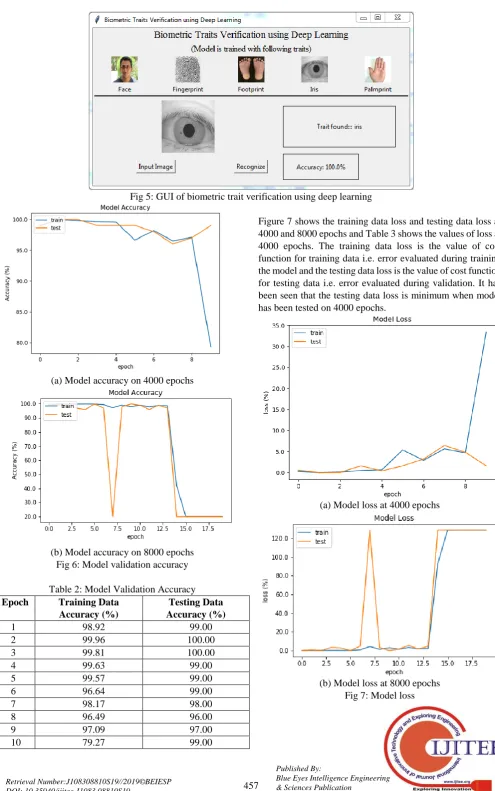
During the testing of the model: model accuracy, and model loss have been computed. The model accuracy is the measure of prediction done by the model. The model accuracy was obtained 100%, as shown in Table 2 and figure 5. Model loss is the value of cost function for cross-validation data which signifies the error evaluated during validation. The
fit_generator() method is used to train the CNN model that
Fig 5: GUI of biometric trait verification using deep learning
(a) Model accuracy on 4000 epochs
[image:6.595.127.463.49.233.2](b) Model accuracy on 8000 epochs Fig 6: Model validation accuracy
Table 2: Model Validation Accuracy Epoch Training Data
Accuracy (%)
Testing Data Accuracy (%)
1 98.92 99.00
2 99.96 100.00
3 99.81 100.00
4 99.63 99.00
5 99.57 99.00
6 96.64 99.00
7 98.17 98.00
8 96.49 96.00
9 97.09 97.00
10 79.27 99.00
Figure 7 shows the training data loss and testing data loss at 4000 and 8000 epochs and Table 3 shows the values of loss at 4000 epochs. The training data loss is the value of cost function for training data i.e. error evaluated during training the model and the testing data loss is the value of cost function for testing data i.e. error evaluated during validation. It has been seen that the testing data loss is minimum when model has been tested on 4000 epochs.
(a) Model loss at 4000 epochs
[image:6.595.187.537.342.828.2]Table 3: Model Loss Epoch Training data loss
(%)
Testing data loss (%)
1 0.293 0.571
2 0.016 0.008
3 0.142 0.041
4 0.491 1.612
5 0.649 0.385
6 5.379 1.612
7 2.932 3.224
8 5.643 6.447
9 4.679 4.835
10 33.403 1.612
V. CONCLUSION AND FUTURE SCOPE
In this work a CNN model has been trained and tested to verify various biometric traits using deep learning. A GUI has also been developed as an attempt towards exploring the recognition of biometric traits using TKinter library in Python 3.7. Deep learning techniques have shown reasonable improvement in the recognition of biometric modalities due to their feature learning capabilities. An efficient deep learning model based on a combination of CNN and Softmax classifier is proposed to extract discriminative features from the images of different biometric traits without any prior domain knowledge and then classify it into one of five classes in the centralized database. The results obtained have clearly shown the efficiency of proposed model by having a 100% accuracy. Despite of the success in recognizing five traits, deep learning approaches have been scarcely explored for other modalities. It can be a potential area of research that other modalities can also have leverage the advantage of deep learning. Clearly, further research will be required to validate the efficiency of the proposed model to recognize the individual after verifying the biometric traits and can be used on larger databases with more difficult and challenging biometric traits images.
REFERENCES
1. A. Ross, K. Nandakumar, and J. Anil K, ―Handbook of
Multibiometrics‖, J. Chem. Inf. Model, vol. 53, no. 9, 2006, pp.
1689–1699.
2. A. Ross and A. K. Jain, ―Multimodal Biometrics: an Overview,‖ in
Signal Processing Conference, 12th European. IEEE, 2004, pp. 1221 –1224.
3. A. Lumini and L. Nanni, ―Overview of the combination of biometric
matchers,‖ Inf. Fusion, vol. 33, 2017, pp. 71–85.
4. Y. Bengio. ―Learning deep architectures for AI‖. Foundations and
Trends® in Machine Learning 2, vol. 1, 2009, pp. 1–127.
5. J. Schmidhuber. ―Deep learning in neural networks: An overview‖.
Neural Networks, vol.61, 2015, pp. 85–117.
6. Y. Sun, Y. Chen, X. Wang, and X. Tang, ―Deep learning face
representation by joint identification -verifiation‖, In Advances in
Neural Information Processing Systems. 2014, pp. 1988–1996.
7. Y. Sun, X. Wang, and X. Tang, ―Deep learning face representation from
predicting 10,000 classes‖, In Proceedings of the IEEE Conference on
Computer Vision and Pattern Recognition. 2014, pp. 1891–1898.
8. Y. Sun, X. Wang, and X. Tang, ―Deeply learned face representations are
sparse, selective, and robust‖, In Proceedings of the IEEE Conference
on Computer Vision and Pattern Recognition, 2015, pp. 2892–2900.
9. O. M. Parkhi, A. Vedaldi, and A. Zisserman, ―Deep face recognition‖.
In Proceedings of the British Machine Vision Conference, vol. 1, no. 6, 2015.
10. X. Cao, D. Wipf, F. Wen, G. Duan, and J. Sun, ―A practical transfer
learning algorithm for face verification‖, In Proceedings of the IEEE
International Conference on Computer Vision, 2013, pp. 3208–3215.
11. D. Chen, X. Cao, F. Wen, and J. Sun, ―Blessing of dimensionality:
High-dimensional feature and its efficient compression for face
verification‖, In Proceedings of the IEEE Conference on Computer
Vision and Pattern Recognition, 2013, pp. 3025–3032.
12. C. Lu and X. Tang, ―Surpassing human-level face verifiation
performance on LFW with GaussianFace‖, In Proceedings of the AAAI
Conference, 2015, pp. 3811–3819.
13. A. Jalali, R. Mallipeddi, and M. Lee, ―Deformation invariant and
contactless palmprint recognition using convolutional neural network‖,
In Proceedings of the 3rd International Conference on Human-Agent
Interaction. ACM, 2015, pp. 209–212.
14. S. Minaee and Y. Wang. ―Palmprint recognition using deep scattering
convolutional network‖, arXiv:1603.09027, 2016.
15. X. Bao and Z. Guo, ―Extracting region of interest for palmprint by
convolutional neural networks‖, In Proceedings of tth International Conference on Image Processing Theory Tools and Applications
(IPTA’16). IEEE, 2016, pp. 1–6.
16. L. Dian and S. Dongmei, ―Contactless palmprint recognition based on
convolutional neural network‖, In Proceedings of the IEEE 13th
International Conference on Signal Processing (ICSP’16). IEEE, 2016,
pp. 1363–1367.
17. J. Svoboda, J. Masci, and M. M Bronstein, ―Palmprint recognition via
discriminative index learning‖, In Proceedings of the IEEE 23rd
International Conference on Pattern Recognition (ICPR’16). IEEE,
2016, pp. 4232–4237.
18. S. Minaee, A. Abdolrashidiy, and Y. Wang, ―An experimental study of
deep convolutional features for iris recognition‖, In Proceedings of the
IEEE Signal Processing in Medicine and Biology Symposium
(SPMB’16), IEEE, 2016, pp. 1–6.
19. A. Gangwar and A. Joshi, ―DeepIrisNet: Deep iris representation with
applications in iris recognition and cross-sensor iris recognition‖, In Proceedings of the IEEE International Conference on Image
Processing (ICIP’16). IEEE, 2016, pp. 2301–2305.
20. https://susanqq.github.io/UTKFace/
21. https://www.nist.gov/srd/nist-special-database-4
22. R. Khokher and R. C. Singh, ―Footprint-based personal recognition
using scanning technique‖, Indian Journal of Science and Technology,
vol. 9, no. 44, 2016.
23. http://www.cbsr.ia.ac.cn/IrisDatabase.htm
24. https://sites.google.com/view/11khands
25. Abibullaev B, An J, Jin SH, Lee SH, Il Moon J, ―Deep
machine learning—a new frontier in artificial intelligence
research‖, Med Eng Phys, vol. 35, no.12, 2013, pp. 1811–1818.
26. Khalajzadeh H, Mansouri M, Teshnehlab M, ―Face recognition using
convolutional neural network and simple logistic classifer‖. In: Soft
computing in industrial application, Springer, 2014, pp. 197–207.
27. Zeng R, Wu J, Shao Z, Senhadji L, Shu H, Zeng R, Wu J, Shao Z,
Senhadji L, Shu H,‖Quaternion softmax classifer‖. Electron Lett IET,
vol. 50, no. 25, 2015, pp. 1929–1930.
28. Srivastava N, Hinton GE, Krizhevsky A, Sutskever I, Salakhutdinov R,
―Dropout: a simple way to prevent neural networks from overftting‖. J
Mach Learn Res, vol. 15, 2014, pp. 1929–1958.
29. Krizhevsky A, Sulskever I, Hinton GE, ―ImageNet classifcation with
deep convolutional neural networks‖, In: Advances in neural
information processing system, 2012, pp. 1–9.
30. Al-Waisy AS, Qahwaji R, Ipson S, Al-Fahdawi S, ―A multimodal deep
learning framework using local feature representations for face
recognition‖, Mach Vis Appl, 2017, pp. 1–20.
doi:10.1007/s00138-017-0870-2
AUTHORS PROFILE
Ram Chandra Singh is Professor of Physics in School of Basic Sciences and Research, Sharda University, Greater Noida. His area of interest includes study of
phase transitions in molecular liquids using
density-functional theory; Time-series analysis using wavelets and Biometrics.