Abstract: Particle damping technique is first time use for study of vibration suppression in 1 kW wind turbine blade for using change of percentage fill of particles parameter. External container is attached on blade and fills the container using three different percentage changes as 10, 50 and 90 using 3mm spherical ball size. Blade is mounted at root location on electromagnetic shaker and accelerometer is located randomly on blade at 600 mm position from tip of blade. With damping results are compared with without damping and finding out the cases where vibration suppression takes place.
Keywords : wind turbine blade, particle damping, vibration, suppression
I. INTRODUCTION
To fulfil the growing needs of electricity required to increase the capacity of wind turbine blades bring us to think about increase in size of rotor [1] and naturally makes the thickness of blade becomes thin. As flexibility is inversely proportional to stiffness so, decrease the stiffness of blade [2] introduces vibration effects. In wind energy power generation if vibrations of blade is high then it adversely affect on electricity generation [3-4]. For investigating vibrations many scientists works on finding dynamic characteristics using the blade element momentum method (BEM) technique [5,12]. Typhoon wind creates turbulence effect which was investigated [6]. Saranyasoontorn [7] studied the different methods of investigation of extreme wind turbine loads. Due to extreme loading conditions different parts like blades, nacelle cover was damage [8-9]. Structural vibrations can be control by using three different techniques namely active, semi active and passive control [4].
In wind energy power generation, if vibrations of blade is high then it adversely affect on electricity generation [10]. In this paper particle damping technique is used to check the effect of different parameters on 1 kw wind turbine blade for vibration suppression. Two parameters are used such as change in position and change in percentage fill keeping 3 mm ball size as constant. At this moment it is not possible to make pocket inside the blade for inserting balls, but for checking the effect we attach external container on blade. The study contains particle damping method, testing with variable parameters, results, discussion and conclusion.
Revised Manuscript Received on September 06, 2019
Santosh R Sandanshiv, Department of Mechanical Engineering, Genba Sopanrao Moze College of Engineering, Pune, India. Email: santoshsandanshiv@yahoo.com
Umesh S Chavan, Department of Mechanical Engineering, Vishwakarma Institute of Technology, Pune, India. Email: umesh.chavan@vit.edu
II. PARTICLE DAMPING METHOD
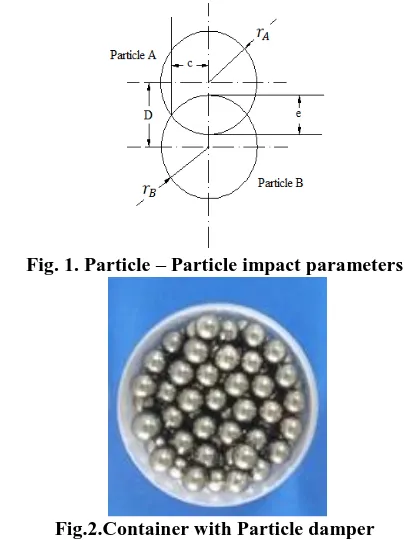
Keeping both materials of particles are same. Fig. 1 shows particle-particle impact parameters. Where KN,KS, CS and CN are stiffness and damping constant at particle wall.
Fig. 1. Particle – Particle impact parameters
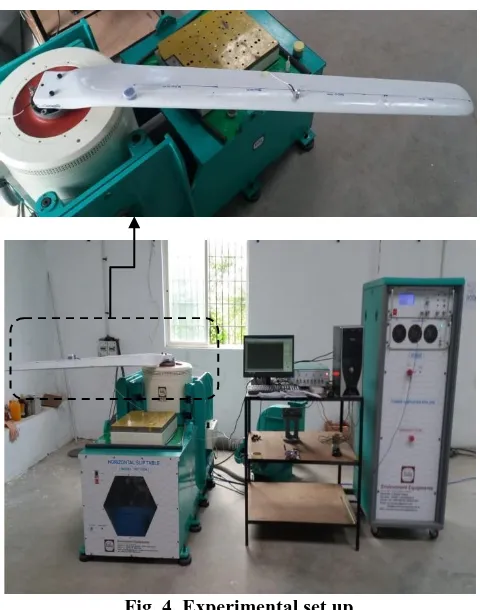
[image:1.595.319.524.233.503.2]Fig.2.Container with Particle damper
Fig.2. shows spherical particles. The use of particle damping method is based on simulation ability of contact interactions using a small number of parameters that capture the most important contact properties. Forces between individual particles and the cavity walls are calculated based on force-displacement relations. Forces created due to particle-particle and particle–cavity impacts is the critical aspect for mathematical model. Let, A and B becomes two spherical particles with radii rA and rB with particle centers separated by a distance D.These two particles interact if their approach e is positive. The approach can be defined as
𝑒 = 𝑟𝐴+ 𝑟𝐵 − 𝐷 Contact forces
f = fn. N n+ fs. N s
Where, fn = Normal force, fs = Shear force, N n = Unit vector in normal direction and N s = unit vector in shear direction.
Effect of Particle Damping Technique on 1 kW
Wind Turbine Blade using 3 mm Balls
III. TESTING WITH VARIABLE PARAMETERS
Fig.3. shows the block diagram of experimental set-up, includes wind turbine blade is mounted on electrodynamic shaker and one accelerometer is mounted on blade and second accelerometer is mounted on electrodynamic shaker. Signals from accelerometers are send to digital vibration controller then to power amplifier. All results are displayed on CPU and display unit. Electrodynamic shaker (EEV 060) having force rating of 600 Kgf is use for generating frequency in the range of 10 Hz to 2000 Hz and acceleration is consider for the first two modes. We consider 1 Kw wind turbine blade for testing which is mounted at the root location
and hermetically sealed type piezo electric accelerometer is mounted at the position of 600 mm randomly considering the
maximum displacement location.
[image:2.595.48.280.263.351.2]Fig. 3. Block diagram of experimental set up
Fig. 4. Experimental set up
Output of accelerometer is connected to single channel digital vibration controller (EESC – 04), generating low electric signals. These electric signals amplify with power amplifier from the vibration controller to a proportionally high voltage and high current output.
to 2000 Hz. Materials and different parameters are explained as follows.
A. Parameters for testing
1) Container position on blade: Total four positions taken for the testing as 300 mm, 600 mm, 900 mm and 1200 mm.
2) Percentage fills of material: It is also important to check for particle percentage fill variation effect for consideration of vibration suppression. 10%, 50 % and 90 % particle fill is considered for recent study.
B. Materials
1) Particle: Testing is done by Wet Method: ALS:SOP:05-TM 503, REST by IS 228:2010 for particle damping having chemical composition of 0.010 % Mo, 0.050% Ni ,0.98 % C, 0.33 % Mn, 0.25 % Si, 0.010 % S, 0.012 % P, 1.40 % Cr.
2) Container: Container is made with Poly-propylene (PP) material, tested by method of ASTM D-792, D-297 and IS 13360.
3) Blade: Glass fiber blade having length of 1525 mm.
Fig. 4 shows the actual experimental set up for testing the effect of vibration suppression. Blade is mounted at root using 10 mm bolts on fixture of electrodynamic shaker. Four positions are marked on blade such as 300 mm, 600mm, 900 mm and 1200 mm respectively. Container is externally connected as shown in fig. 4. Accelerometer is shown in exaggerated view at the position of 600 mm which is randomly chosen. Power amplifier, vibration controller and display unit is as shown in Fig. 2.
IV. RESULT AND DISCUSSION
Table – I shows all results and Fig. 5-8 shows all graphs. Results of without damping and with damping is compared and finding out the difference in acceleration in initial two modes i.e. first mode and second mode. If acceleration is less than without damping then we say that vibration suppression occurs. If acceleration value is more than without damping acceleration then we says that suppression is not possible. Here we focus on effect of vibration suppression by particle damping using 3mm spherical balls. From without damping case, confirming 1st mode at 51.01 Hz at acceleration of 5.223g and 2nd mode at 153.45 Hz frequency and 2.215 g acceleration value. Graph starts from 0.33 g and at 10 Hz frequency up to 16 Hz graph is constant then fluctuates in the acceleration range of 0.2g to 0.42 g. After 30 Hz graph is gradually increases up to 5.223 g (1st mode) acceleration. Here without damping results for 1st mode 5.223 g and for 2nd mode 2.215 g is considered as reference for deciding suppression effect. Below shows the different damping condition results.
A. Case 1: Container at 300 mm position
[image:2.595.49.289.376.681.2](a)
(b)
[image:3.595.334.531.42.696.2](c)
Fig. 5 Ball size 3 mm, 300 mm position (a) 10% fill (b) 50% fill (c) 90 % fill
(a)
(b)
(c)
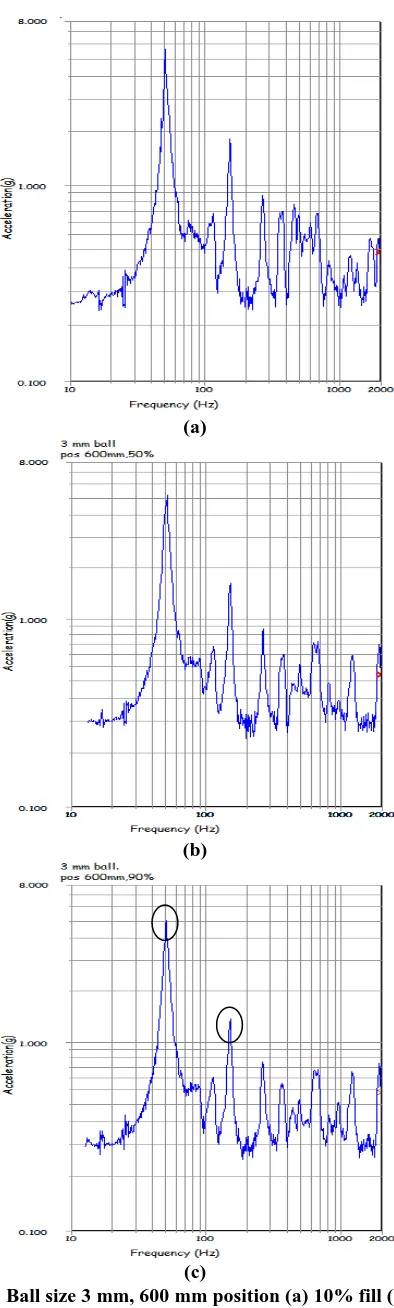
[image:3.595.144.525.43.698.2]B. Case 2: Container at 600 mm position
Fig.6 shows results for damper located at 600 mm position. Out of three cases only one case i.e. at 90 % particle fill gives us better result as compare to without damping condition. Accelerations 5.125 g and 1.474 g at 1st and 2nd modes are fewer values than without damping cases so suppression achieves here.
(a)
(b)
C. Case 3: Container at 900 mm position
Fig. 7 shows 90 % fill in damper gives 3.485 g acceleration at 1st mode and 1.164 g is the 2nd mode acceleration are the less value as compare to all results so this case is the optimum amongst all as compared to without damping.
(a)
(b)
(c)
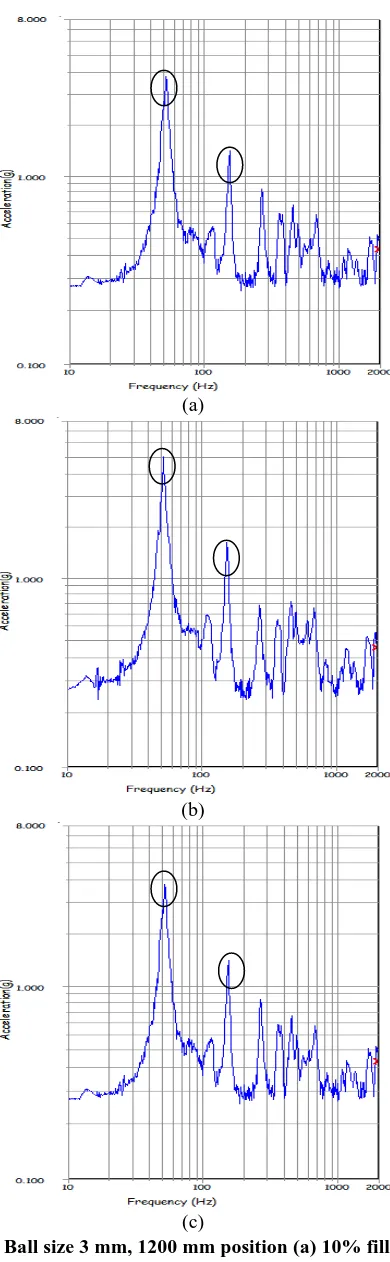
[image:4.595.73.486.127.793.2] [image:4.595.67.289.139.766.2]D. Case 4: Container at 1200 mm position
Fig.8. shows all three conditions as vibration suppression first two modes are highlighted with circles. At 1st mode 3.834g, 5.127g and 3.959g are the acceleration values at 10%, 50% and 90% respectively. At 2nd mode 1.807g, 1.623g and 1.462g are the acceleration values for 10%, 50% and 90% particle fill in damper respectively. All accelerations are below the without damping conditions.
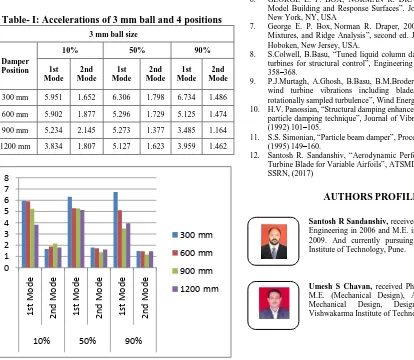
Table- I: Accelerations of 3 mm ball and 4 positions
3 mm ball size
Damper Position
10% 50% 90%
1st Mode 2nd Mode 1st Mode 2nd Mode 1st Mode 2nd Mode
300 mm 5.951 1.652 6.306 1.798 6.734 1.486 600 mm 5.902 1.877 5.296 1.729 5.125 1.474 900 mm 5.234 2.145 5.273 1.377 3.485 1.164 1200 mm 3.834 1.807 5.127 1.623 3.959 1.462
Fig. 9 Combine results for all four positions
V. CONCLUSION
3 mm balls at damper position 1200 mm gives best results at three damping conditions. At 600 mm and 900 mm damper position gives one results each as vibration suppression. In overall comparison at 900 mm damper position gives minimum acceleration value so this case we call as most optimum case for vibration suppression. At 300 mm damper position all results of acceleration gives higher values as compare to without damping so no suppression effect takes place in this condition.
REFERENCES
1. Mina Ghassempour, Giuseppe Failla, “Vibration mitigation in offshore wind turbines via tuned mass damper”, Engineering Structures 183 (2019) 610–636
2. K.Thomsen, J.T.Petersen, E.Nim, S.Øye, B.Petersen, “A method for determination of damping for edgewise blade vibrations”, Wind Energy 3 (4) (2000) 233–246
3. Dapeng Qiu, Jianyun Chen, “Dynamic responses and damage forms analysis of underground large scale frame structures under oblique SV seismic waves”, Soil Dynamics and Earthquake Engineering 117 (2019) 216–220
4. S. Krenk, M.N.Svendsen, J.Høgsberg, “Resonant vibration control of three-bladed wind turbine rotors”, AIAA Journal 50 (1) (2012) 148–161.
5. B. Fitzgerald, B.Basu, S.R.K.Nielsen, “Active tuned mass dampers for control of in-plane vibrations of wind turbine blades”, Structural Control and Health Monitoring 20 (12) (2013) 1377–1396.
6. GEORGE E. P. BOX, NORMAN R. DRAPER, 1987. “Empirical Model Building and Response Surfaces”. John Wiley & Sons, Inc., New York, NY, USA
7. George E. P. Box, Norman R. Draper, 2007. “Response Surfaces, Mixtures, and Ridge Analysis”, second ed. John Wiley & Sons, Inc, Hoboken, New Jersey, USA.
8. S.Colwell, B.Basu, “Tuned liquid column dampers in offshore wind turbines for structural control”, Engineering Structures 31(2) (2009) 358–368.
9. P.J.Murtagh, A.Ghosh, B.Basu, B.M.Broderick, “Passive control of wind turbine vibrations including blade/tower interaction and rotationally sampled turbulence”, Wind Energy 11(4) (2008) 305–317. 10. H.V. Panossian, “Structural damping enhancement via non-obstructive particle damping technique”, Journal of Vibration and Acoustics 114 (1992) 101–105.
11. S.S. Simonian, “Particle beam damper”, Proceedings of the SPIE 2445 (1995) 149–160.
12. Santosh R. Sandanshiv, “Aerodynamic Performance Study of Wind Turbine Blade for Variable Airfoils”, ATSMDE-2017, proceedings on SSRN, (2017)
AUTHORS PROFILE
Santosh R Sandanshiv, received his B.E. in Mechanical Engineering in 2006 and M.E. in Design Engineering in 2009. And currently pursuing PhD at Vishwakarma Institute of Technology, Pune.
Umesh S Chavan, received PhD (Mechanical Design),
M.E. (Mechanical Design), Area of Specialization: Mechanical Design, Designation: Professor at Vishwakarma Institute of Technology, Pune
0 1 2 3 4 5 6 7 8 1s t Mo d e 2n d Mo d e 1s t Mo d e 2n d Mo d e 1s t Mo d e 2n d Mo d e
10% 50% 90%
300 mm
600 mm
900 mm
[image:5.595.55.469.148.508.2]