This is a repository copy of
Visualisation and auralisation for perception-driven decision
supports in planning: A comparative review
.
White Rose Research Online URL for this paper:
http://eprints.whiterose.ac.uk/143285/
Version: Accepted Version
Book Section:
Jiang, L (2018) Visualisation and auralisation for perception-driven decision supports in
planning: A comparative review. In: Handbook of Research on Perception-Driven
Approaches to Urban Assessment and Design. IGI Global , pp. 297-316. ISBN
9781522536376
https://doi.org/10.4018/978-1-5225-3637-6.ch013
[email protected] https://eprints.whiterose.ac.uk/
Reuse
Items deposited in White Rose Research Online are protected by copyright, with all rights reserved unless indicated otherwise. They may be downloaded and/or printed for private study, or other acts as permitted by national copyright laws. The publisher or other rights holders may allow further reproduction and re-use of the full text version. This is indicated by the licence information on the White Rose Research Online record for the item.
Takedown
If you consider content in White Rose Research Online to be in breach of UK law, please notify us by
See discussions, stats, and author profiles for this publication at: https://www.researchgate.net/publication/322743576
Visualisation and Auralisation for Perception-Driven Decision Supports in
Planning: A Comparative Review
Chapter · January 2018 DOI: 10.4018/978-1-5225-3637-6.ch013
CITATIONS 0
READS 177
1 author:
Some of the authors of this publication are also working on these related projects:
Web-based virtual reality tool for evaluation of urban sound environment View project
SONORUS - Urban Sound PlanningView project Like Jiang
University of Leeds
13PUBLICATIONS 42CITATIONS
SEE PROFILE
All content following this page was uploaded by Like Jiang on 17 November 2018.
NOTE:
This is the author’s self
-archived version. For the final published version, please visit:
https://www.igi-global.com/chapter/visualisation-and-auralisation-for-perception-driven-decision-supports-in-planning/198169
Or contact the author.
Visualisation and Auralisation for Perception-Driven Decision
Supports in Planning: A Comparative Review
Like Jiang
Institute for Transport Studies, University of Leeds
[email protected]
ABSTRACT
Visualisation and auralisation are among the essential technologies for perception-driven decision support in landscape planning and soundscape planning, respectively. By making proposed developments and environmental changes visible and audible, they allow decision-makings based on perceptual experience,
providing a “common language” that all the stakeholders are capable of using to communicate and to
INTRODUCTION
Perception-driven evaluation, assessment and design assess the quality of the environment based on human perceptual response to the biophysical features of the environment. Advantage of the perception-driven approaches for landscape planning (Daniel, 2001; Lothian, 1999) and soundscape planning (De Coensel et al., 2009, Ruotolo et al., 2013) is that they highlight human experience in the environment, instead of simply examining measured indicators of the biophysical features. Moreover, perception-driven approaches can help involve the public as equal and capable partners in decision-making in landscape planning (Lange & Hehl-Lange, 2005; Orland, 2015) and soundscape planning (Finne & Fryd, 2016; Stienen & Vorländer, 2015), since it does not require expert knowledge or skills to make perceptual judgements on the environment.
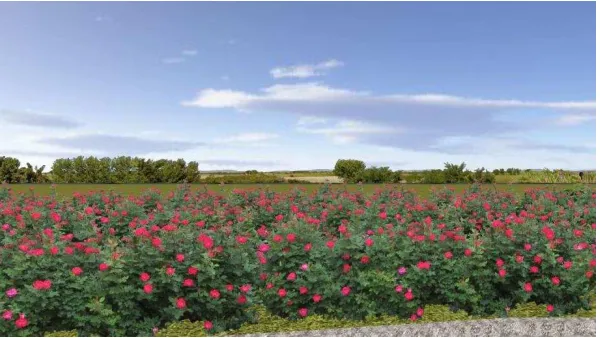
Visualisation and auralisation are among the vital technologies to enable and to improve perception-driven decision-support in landscape planning and soundscape planning respectively. Visualisation in landscape planning is a collection of technologies for graphical representations of proposed developments and/or impacts on landscape (Schroth, Wissen Hayek, Lange, Sheppard, & Schmid 2011; Sheppard, 2001). For the scope of perception-driven decision support, visualisation in this chapter refers specifically to creation of landscape surrogates which are used to portray perspective views of landscapes, rather than visualisation in forms of design plans, mappings or information visualisation. Figure 1 gives an example of the concerned visualization. Visualisation traditionally included drawings and scale models. Since the 1960s, photographs and photomontages have been widely used (Lovett et al., 2015). Examples can be found in Smardon, Palmer, & Felleman. (1986, pp. 193) and Landscape Institute & Institute of
Environmental Management and Assessment (2002, pp. 57). Photo-based visualisations are effective and straightforward solutions for highly detailed and realistic landscape representations. However, in
situations where a larger number of viewpoints or alternative scenarios are needed, they can be quite time-consuming. More recently, computer-based 3D visualisation has enjoyed rapid development and become the most common approach of visualisation today (Lovett, Appleton, Warren-Kretzschmar, & Von Haaren, 2015). Computer-based 3D visualisation has advantageous in links with GIS data (Ode, Fry, Tveit, Messager, & Miller, 2009) and scenario manipulation (Bishop & Miller, 2007). In addition, the real-time rendering capability of computer-based visualisation has increased the interactivity of presented landscape, e.g. free navigation (Appleton & Lovett, 2009) and display control (Salter, Campbell,
[image:4.612.73.373.511.680.2]Journeay, & Sheppard, 2009). However, computer-based visualisation requires abstractions and simplifications due to technology and resource limits, and the achieved levels of realism can be more questionable (Ervin & Hasbrouck, 2001, Lovett et al., 2015).
Analogue to visualisation, auralisation is the creation and reproduction of sound to communicate acoustic phenomena (Vorländer, 2007). Auralisation has long been used for indoor acoustics, and is now receiving increasing investigation and development for outdoor applications (Pieren, Bütler, & Heutschi, 2016a). For the scope of decision support in planning, auralisation in this chapter mainly refers to outdoor auralisation. Auralisation makes it possible to hear new soundscapes as would be resulted by proposed developments in planning. Typically, auralisation process can be separated into three parts: signal generation of individual sound sources, calculation of acoustic wave propagations including all physical effects, and reproduction of a sound field at a virtual receiver position for a user or a group. In such auralisations, sound events are auralised separately and then merged to create the sound environment. Advantages of such auralisations include high degrees of freedom and control in sound scenario manipulation (e.g., Maillard & Kacem, 2016; Manyoky, Wissen Hayek, Heutschi, Pieren, & Grêt-Regamey, 2014), and possibility of high interactivity with real-time rendering (e.g., Ejima, Kashiyama, Tanigawa, & Shimura, 2013; Maillard & Jagla, 2013; Maillard & Martin, 2005). However, challenges may occur from difficulties in acquiring outdoor sound sources (Stienen & Vorländer, 2015), complexity of outdoor ground condition for sound propagation calculation (Viggen, Solvang, Vennerød, & Herold, 2015), and high computational loads in cases of real-time rendering (Stienen & Vorländer, 2015), and solutions to overcome these challenges such as sound source synthesis (Forssén et al., 2013) and scene simplification (Hell, Aspock, & Vorländer, 2016) may require compromises in realism. As comparable with visualisation based on photographs, auralisation can also be made based on recordings of total sound environment, in which sound events are not auralised separately and/or acoustic behavior of the
environment, although adjustable, is already contained in the recordings (e.g., Jiang, Masullo, & Maffei, 2016a; Thomas, Wei, Van Renterghem, & Botteldooren, 2016). Such recording-based auralisations are effective solutions to achieve highly realistic audio reproductions, but the associated shortcoming is constrained sound scenario manipulation.
Visualisation and auralisation have a lot in common in the context of decision support in planning. By making proposed developments and environmental changes visible and audible, they allow
decision-makings based on perceptual experience, providing a “common language” that all the stakeholders are capable to use to communicate and to exchange ideas (Finne & Fryd, 2016; Kwartler, 2005). For this purpose, they should have sufficient validity that they evoke perceptual responses that are similar to those that would be obtained in real-life environment (Bergman, Pieringer, Forssén, & Höstmad, 2015; Bishop & Rohrmann, 2003). For good practices, they should also meet or balance the following criteria: (1) they are based on robust scientific evidence (credibility), (2) they are relevant to the needs of stakeholders, and (3) they are produced and used in unbiased manners (legitimacy) (Cash et al., 2003; Lovett et al., 2015). Apart from the shared function and criteria, the emerging popularisation of virtual reality technology powered with synchronous visual and audio representations (Maffei, Masullo, Pascale, Ruggiero, & Puyana Romero, 2016), and the increasing emphasis on visu-aural interaction in environmental perception (Jiang & Kang, 2016), have further intensified their connections.
Nevertheless, visualisation and auralisation are not in parallel developments, not least as tools for decision support in planning. Visualisation as a technology is more advanced, available and affordable than
auralisation (Lovett, Appleton, & Jones, 2009; Vorländer, 2007). It has long been in planners’ tool box
This chapter comparatively reviews the developments and applications of visualisation and auralisation for perception-driven decision-support in planning, aiming to provide technological and methodological insights into the two interconnected yet somewhat independent subjects, and lead to indications for new developments and optimised applications in the near future. The review addresses three issues: validity, contents to present, and ways to present.
VALIDITY
Validity is a key criterion for visualisation and auralisation to be used with high confidence for
perception-driven decision support in planning, although it is also essential to recognise that visualisation and auralisation are inevitably more or less abstracted representations of the complex reality, exactly the same perceptual responses are hardly possible to achieve. A lot of research has been done to assess the validities of visualisation and auralisation, as well as to explore how to increase their validities.
In visualisation, early attempts were made by investigating if photographs can used as surrogates of the actual environments for landscape quality evaluations. These studies were typically conducted by comparing landscape quality or preference ratings of actuality landscapes and corresponding photograph representations, and high validity of photographs were found (e.g., Daniel & Boster, 1976; Shafer & Richards, 1974; Shuttleworth, 1980). Validity of photomontages was tested in (Oh, 1994) with highly positive results where semantic differential ratings were used to measure perceptual response to simulated landscapes in photomontage as compared to on-site visit post-construction. More studies in recent
decades have focused on the validity of computer-based visualisation. A large number of them addressed this issue by comparing computer-based visualisation to photographs of the same views (e.g., Appleton & Lovett, 2003; Bergen, Ulbricht, Fridley, & Ganter, 1995; Daniel & Meitner, 1997; Lange, 2001), while much fewer of them used on-site visits as references instead of photographs (e.g., Bishop & Rohrmann, 2003; Wergles & Muhar 2009). Apart from ratings of perceived realism and landscape quality, a variety of cognitive and affective responses (e.g., recall of specific items; impression of the areas,) were also examined in some of the studies, which are thought to be important and indicative measures in verifying response equivalence (Bishop & Rohrmann, 2003; Wergles & Muhar 2009). Results of these studies indicated that computer-based visualisation could not yet be used with full confidence to represent actual landscapes, however, generally reliable perceptual responses and judgments could be obtained. It is suggested that using photographic textures (Barbarash, 2012; Lange, 2001) and increasing levels of details, especially these of foreground features (Appleton & Lovett, 2003), can enhance the realism of computer-based visualisation, whereas high geometrical and data accuracy does not necessary contribute to high response equivalence (Wergles & Muhar 2009; Williams, Ford, Bishop, Loiterton, & Hickey, 2007). Nevertheless, sufficient degree of validity is hard to define and would depend on specific context and application (Appleton & Lovett, 2003).
In auralisation, verifications of validity are typically conducted by subjective listening tests where auralised signals are compared against recordings. Comparisons can be made by rating similarity of paired samples of which one is auralised and one is recorded (e.g., Allen, 2012), or by distinguishing the recorded one between the pair (e.g., Bergman et al., 2015; Forssén, Kaczmarek, Lundén, Nilsson, & Alvarsson, 2009), by categorising individually presented samples as recorded or auralised (e.g., Thomas, Van Renterghem, & Botteldooren, 2015; Thomas et al., 2016), or by the mix of above methods (e.g., Rietdijk & Heutschi, 2016). Some listening tests included other measures of perceptual responses, such as perceived pleasantness of the sound, noise annoyance and perceived velocity in cases of vehicle pass-by sounds (e.g., Bergman et al., 2015; Forssén et al., 2009). Much less often aurlisation is tested by
generally showed high degrees of perceptual agreements between auralised signals and recordings. There do not seems to be many studies available in existing literature that have compared auralised signals directly against on-site visits. A close example can be found in Harriet & Murphy (2015). Nevertheless, on-site visits such as sound walks involving different citizen groups have been used to provide helpful information to optimise auralisations for more effective and more efficient representations of perceived sound environments (e.g., Zachos, Forssén, Kropp, & Estévez-Mauriz, 2016b).
Overall, high validities can be found in auralisations and in photo-based visualisations in literature, while validities of the more advanced computer-based visualisations remain open to debate. However, it should be noted that generally all computer-based visualisations visualise entire scenes that are rich in content, while the vast majority of current outdoor auralisations, if not based on recordings of the entire sound environment, only auralise single sound events. At least during the listening tests, usually only a single sound event, such as a vehicle pass-by and an aircraft flyover, was represented in each auralised signal. This might also be one of the reasons why on-site visits are not much considered as references for listening tests, since controlled and isolated sound events are hard to achieve on-site, and even somehow achieved, the benefit of on-site visits of providing a real world context would be impaired to some extent.
It seems neither the validity of real-time visualisation nor that of real-time auralisation has been addressed specifically. For real-time visualisation, Appleton & Lovett (2005) shows that with the same modelling and rendering qualities, real-time models make it easier to imagine the real landscape as compare to still images. But in practice compromises in modelling and rendering qualities are often needed for real-time visualisations (Lovett et al., 2015). It can be assured though that with hardware and software advances today, it is not hard to achieve qualities of real-time models as high as those of the rendered images of computer-based visualisations used in the validity studies more than a decade ago. For real-time auralisation, the development may not have reached the stage to proceed with listening tests for validation. Where listening tests were undertaken for real-time auralisations, they were very restricted, e.g., only rendered source signals were compared against recordings (Maillard & Jagla, 2013), or pre-rendered auralised signals were rated without recordings as references (Maillard & Kacem, 2016). Questions also arise on how listening tests should be designed for real-time auralisation. A possible solution might be first rating the perceived realism, and then asking if it gives a similar overall impression as compared to on-site visit despite the differences in specific sound events. Where the real-time
auralisation resembles the real site at a higher level, more detailed cognitive and affective responses might be compared. A study that is relevant to the above issues is Maffei et al. (2016) which tested the validity of virtual reality (VR), including visualisation and auralisation, by comparing cognitive and affective responses in VR and on-site, and found good levels of congruence. However, in their VR setting,
configured with a head-mounted display and a 5.1 loudspeaker system, free movement was not supported but only free head rotation, since the auralisation was a processed on-site recording sample rather than real-time rendered signals.
Whether high validities are readily achievable or not, for both visualisation and auralisation to be used for decision support in planning, contents and ways to present will need to be decided considering purpose, audience and available resources in specific cases, and thus to meet or balance the criteria of credibility, salience and legitimacy. These will all more or less influence the achieved level of validity of the visualisation or auralisation.
CONTENTS TO PRESENT
In visualisation, landscape elements to be visualised typically include terrain, vegetation, water, meteorological condition, man-made structures, and human or animal inhabitants (Ervin & Hasbrouck, 2001), as well as traffic in urban context. It is suggested that different levels of content details should be applied at different stages of a planning process. In initial stages, it is better to use exploratory and relatively abstract visualisations to reduce costs of production and to provide more open opportunities for discussion (Kwartler & Longo, 2008). While at later stages where specific proposals have been developed and significant alterations are less likely, visualisations with highly detailed contents become affordable and are beneficial for more in-depth and focused decision making (Wissen Hayek, 2011). A similar opinion is that visualisations should be employed at multi-steps, allowing cycles of discussion involving
stakeholders to identify relevant contents and test visualisation styles, before the “final completed
products” are presented to the stakeholders (Lovett et al., 2015; Williams et al., 2007). In this way, better mutual understandings of what the stakeholders want to see and what the producers can visualise can be reached, and legitimacy of the visualisation processes and saliency of the visualisation products can be enhanced (Schroth, Pond, Muir-Owen, Campbell, & Sheppard, 2009; Pond et al., 2010).
More specifically, regarding what can be visualised, it very much depends on available resources, such as data, manpower, time and budget (Walker & Daniels, 2011). In some cases, only geo-typical 3D models are required for computer-based visualisations, or only a few viewpoints and well-defined changes are needed for photomontages, limits in resources are less problematic. In some cases, geo-specific 3D models are required or complex new elements need to be inserted in photomontages, visualisations become quite demanding on resources. Particularly, in terms of data, accuracy are likely to decrease as desired level of details increase. Although exact data accuracy may not be necessary and sometimes revised estimates may even be more beneficial for visualisation validity (Williams et al., 2007), permitting inaccuracies poses dangers on the criterion of credibility (Downes & Lange, 2015), and research is still needed to understand how to best present certain and uncertain contents in visualisation.
In auralisation, sounds to be auralised can include traffic noise, industrial noise, human voice, human steps, bird sound, water sound, residual or background sound, etc. (Aletta, Kang, Astolfi, & Fuda, 2016; Jiang, Masullo, Maffei, Meng, & Vorländer, 2016b; Mailard & Kacem, 2016). Environmental elements that are not sound sources, such as terrain, land cover and meteorological condition, can also be simulated in auralisation, by including their effects in calculations of sound propagation (Pieren et al., 2016a). Although the increasingly recognised concepts of sound planning and soundscape take sounds as
resources rather than wastes in environmental management and place-making (Alves et al., 2016; Kang et al., 2016), most studies in outdoor auralisation are still driven by interests in noise control and focus on simulations of sounds which are normally judged or termed as noises, such as road traffic noise (Pieren et al., 2016a), railway noise (Pieren, Wunderli, Zemp, Sohr, & Heutschi, 2016b), aircraft noise (Rietdijk & Heutschi, 2016) and wind turbine noise (Butera, Burgemeister, Fisher, & Mounter, 2014). This is
probably due to high attentions constantly paid toenvironmental noise and its adverse effects on human
well-being (European Environmental Agency, 2014), but might also be because that source signals of these sounds are difficult to acquire and thus relatively more efforts are needed in auralising these sounds. Where there are more complex scenes to auralise, especially in cases of real-time auralisation, the
contents might be simplified by removing less salient sound sources to reduce computational load while maintaining perceptually similar audio representations (Hell et al., 2016). Overall, due to limits in concepts and technologies, auralisation is still less applied in planning via soundscape approaches, but more in environmental impact assessment via noise control approaches. Thus, contents presented in auralisations are usually less complex as compared to visualisations, and there is also a lack of debate on what contents to present regarding the roles of auralisations at different stages of a planning process.
Botteldooren, 2016; Jiang & Kang, 2016; Joynt & Kang, 2010; Maffei, Masullo, Aletta, & Di Gabriele, 2013), since noise barriers are typical environmental installations that have significant influences on both landscape and soundscape (Kotzen. & English, 1999). Other more general applications can also be found (e.g., Bastürk, Maffei, Perea Pérez, & Ranea Palma, 2011; Jiang et al., 2016b; Smyth, Rice, McDonald, & Gerdelan, 2010). Because visual and audio contents need to be synchronised in visu-auralisation, there are more technological and resource limits in visu-auralisation than in visualisation or auralisation alone in deciding what contents to present.
Overall, in visualisation, there have been substantial discussion and knowledge developed on what contents to present for specific decision making stages and decision support purposes. It is empirical, pragmatic, and approached more from a social science perspective. While in auralisation, efforts have been made to address what can be presented much more than what should be presented throughout a planning process. It is approached more form a science perspective. For both visualisation and
auralisation, it might be helpful to learn from each other regarding what contents to present, to better meet the criteria of credibility, salience and legitimacy for perception-driven decision support in planning.
WAYS TO PRESENT
Both visualisation and auralisation also face the question of how to present, since there are a variety of options available.
Visualisations are commonly displayed as printed copies or on screens in varied sizes. Displays on large screens are particularly beneficial for participatory decision making, by enabling and encouraging multiple participants to see and collaboratively discuss the visualisation simultaneously (Lovett et al., 2015). There are also stereo displays such as CAVEs and 360° cylindrical projection systems that can enhances the immersion of visualisations. However, because such display facilities are expensive and the additional benefits of the provided immersion to decision support in planning are still unclear, their uses have become less common (Lovett et al., 2015). In recent years, with the emerges of more affordable and less cumbersome devices such as Oculus Rift and HTC Vive, head-mounted displays are becoming more and more popular solutions for immersive visualisation. But they are not yet widely used for decision support in planning and they are still expensive and inefficient for group uses.
Regarding interactivity, visualisations can be displayed as pre-rendered still images (e.g., Dockerty, Appleton, & Lovett, 2012; Jiang, Kang, & Schroth, 2015) and dynamic videos (e.g., Bishop & Rohrmann, 2003; Jiang & Kang, 2016), or interactive real-time models (e.g. Appleton & Lovett, 2009; Jiang et al., 2016b). The benefit of interactive displays is that they allow users to explore the visualisations more freely which enhances the levels of salience. The high explorablity is particularly desirable for
visualisations at early stages of a planning process. However, interactive displays can potentially be more expensive, considering larger numbers of actual viewpoints covered and higher demands in real-time rendering. Moreover, higher levels of interactivity may also require higher computer expertise of the users, which can lead to biased participations in decision making (von Haaren & Warren-Kretzschmar, 2006).
issues such as lack of display control, absences of staff supervision, mediation and assistance that need to be considered (Lovett et al., 2015).
In recently years, popular public virtual globe tool sets such as Google Earth have been developed and used for serious online visualisations in participatory planning processes. Virtual globes can benefit from
existing “base models” and provide more accessible online visualisations with spatial and temporal
interactivities (Schroth et al., 2011). However, virtual globes with current technologies may not be suitable as visualisations for highly formal decision makings (Schroth, Pond, & Sheppard, 2015).
A novel type of visualisation displays that has shown high potential for planning decision support is location-based display, whereby virtual landscape is displayed on a mobile device such as a smartphone
or a tablet according to the viewer’s real-time position and direction on the actual site in question. A typical form of such displays is augmented reality (e.g., Olsson, Savisalo, Hakkarinen, & Woodward, 2012; Taigel, Lovett, & Appleton, 2014). With augmented reality, virtual landscape elements, such as proposed developments, can be superimposed on the view of the actual site captured by the camera of the
mobile device. Another form is defined as “on-demand mobile” display by Gill & Lange (2015), which
delivers images of a virtual landscape model to a mobile device, updated with the device position and direction on the corresponding actual site. The most significant benefit of location-based display is the spatial attachment of virtual and actual experiences. However, there are still substantial software, hardware and usability challenges in practice (Bilge, Hehl-Lange, & Lange, 2016). The validity of these novel displays for perceptual landscape evaluations also remains in question.
Auralisations can be reproduced in binaural, stereo, multi-channel, ambisonic and wavefield synthesis formats (Hong, He, Lam, Gupta, & Gan, 2017; Svensson, Reiter, & Behne, 2009). These formats provide sound immersion and localization in varied degrees. For instance, Guastavino, Larcher, Catusseau, & Boussard (2007) shows that binaural and stereo formats provide precise localisation but weak immersion, while ambisonic format provides strong immersion but poor localisation. Stereo, multi-channel,
ambisonic and wavefield synthesis formats are typically played back over loudspeakers in specific
configurations. Binaural format is typically played-back over headphones, although a pair of loudspeakers can also be used with crosstalk cancellation. For public participation in planning, headphones may be a better option than loudspeakers, since they are more available, less demanding on listening room condition, and are convenient for group uses. Disadvantages of headphones include wearing discomfort,
unnatural ear occlusion and unwanted effects such as “in-head localisation” (Vorländer, 2007).
Auralisations can also be presented with varied levels of interactivity. There are auralisations that reproduce sound fields for fixed listener position and head rotation (e.g. Finne & Fryd, 2016; Jiang & Kang, 2016), fixed listener position with free head rotation achieved by multi-channel loudspeaker systems (e.g., Jiang et al., 2016a) or headphones with adaptive filtering (e.g., Aletta, Masullo, Senese, & Ruotolo, 2013), pre-rendered walk-through (e.g., Maillard & Kacem, 2016), pre-rendered walk-through with free head rotation (e.g., Echevarria Sanchez et al., 2016), or free listener movement and head rotation (e.g., Jiang et al., 2016b; Smyth et al., 2010). Interactive auralisations potentially have similar advantages and disadvantages as interactive visualisations, and require necessary considerations when used for participatory decision support in planning. The disadvantage of higher costs might be particularly sharp since real-time audio rendering is not yet as advanced as real-time graphical rendering and the
computational load can be high even for perceptually plausible auralisations (Maffei, 2012).
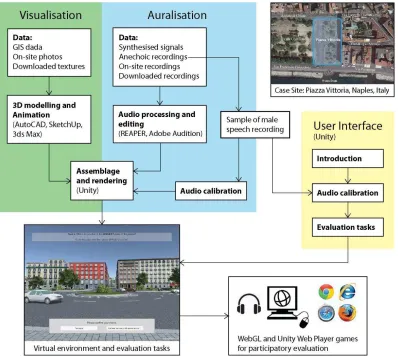
Online presentations are less commonly used for auralisation than for visualisation, especially in the planning context. Examples can be found in Finne & Fryd (2016) where produced auralisations were made available for download online, and in Jiang et al. (2016b) where auralisation was presented in web-based VR. Figure 2 shows the construct of the web-web-based VR tool developed in Jiang et al. (2016b). One
hardware and playback settings. Different audio rendering processes may require different audio
hardware (e.g., loudspeakers V.S. headphones), and playback settings can be critical in some cases (e.g., volume setting for evaluation of traffic noise impact in otherwise quiet areas). In most cases, headphones would be preferred over loudspeakers, since headphones are widely available and commonly used at home or work (Lindquist, 2014), and with the use of headphones, it is easier to expect how the spatialised sound would be played by each individual participant. To control playback volumes, approximate
[image:11.612.75.473.221.578.2]calibrations can be performed by participants using recordings of typical and familiar sounds as references, such as speech recordings at 60 dB(A) (Olsen, 1998). This process was subjective, but a generally acceptable accuracy could be achieved (Pedersen, Antunes, & Rasmussen, 2012). Other benefits and risks of online presentations discussed in visualisation also exist in online auralisations when used for participatory decision support in planning.
Figure 2. Construct of the web-based VR tool developed in Jiang et al. (2016b) for participatory evaluation of urban sound environment
Source: Jiang et al., 2016b
Like online visualisations, it is also possible to develop online auralisations based on virtual globes. Examples can be found in PlanetInAction (2009) where sound sources were geo-located in Google Earth
counterpart visualisations, since there is no existing data of boundary conditions in traditional virtual globes.
As for location-based auralisation, the idea has been demonstrated in Pecino & Climent (2013) where auralisation was presented by smartphones in the form of sonic augmented reality, i.e., sounds were
virtually placed and level attenuation and panning were applied according to the user’s position and
direction on the actual site. It would be interesting to use such auralisations for soundscape evaluation, e.g., evaluating perceived noise impact of proposed wind turbines in a rural area, or evaluating perceived sound quality of an urban street with certain added sound elements. But currently, the potential of
location-based auralisation has not been explored for participatory decision making in planning, and more tests and debates are needed to turn it from a toy to a tool.
Overall, both visualisation and auralisation have various ways to present, with different levels of immersion and interactivity, and with possibilities to be presented online, based on virtual globes, or in location-based formats. Decisions on how to present should consider the purposes of visualisations and auralisations, availabilities of resources, as well as needs, capabilities and preferences of the audiences. Balances should also be made between ways to present and contents to present. For instance, increasing salience by interactivity or increasing legitimacy by online access may compromise content credibility due to resources and/or technological limits. More efforts are needed to develop and test applications of novel presentations, such as virtual-globe-based and location-based presentations, especially of
auralisation, for perception-driven decision support in planning.
CONCLUSION
Both visualisation and auralisation have been recognised as essential tools for perception-driven decision support in planning. While studies on uses of visualisation in planning have focused more on application issues, those of auralisation have so far showed more interests on technical innovations.
Validity is a key criterion for visualisation and auralisation to be used with confidence in planning. In literature, high validities of auralisations and photo-based visualisations have been reported, while validities of computer-based visualisations remain open to debate. However, a limit to the validity of auralisation could be the fact that, while most computer-based visualisations in planning visualise entire scenes that are rich in content, current outdoor auralisations, except those based on recordings of the entire sound environment, quite often only auralise single or simple sound events. In the future, for auralisation to be used in the planning context, validations should be done on a sound field basis, rather than sound event basis. More evidences are also needed for validities of time visualisation and real-time auralisation, since with current technological advances, compromises in qualities are often inevitable for real-time renderings which can lead to lowered validities.
Substantial research has been done on visualisation to answer what should be presented for decision support in planning. It is suggested that different levels of content details should be applied at different stages of a planning process, to allow cycles of discussion and thus to enhance legitimacy of the visualisation processes and saliency of the visualisation products. For auralisation, the question is very
much limited to what can be presented, and there are higher interests in auralising “noise” for noise
Visualisation and auralisation can both be presented in a variety of ways, varied in levels of immersion and interactivity, and with possibilities to be presented online. Decisions on how to present in specific planning events should consider the purposes of visualisation and/or auralisation, availabilities of resources, as well as needs, capabilities and preferences of the audiences. Novel presentations such as presentations based on virtual globes and presentations in location-based formats have also shown high potential. However, efforts are still needed to develop and test such novel presentations especially for auralisation.
With the growing interests in perception-driven approaches to design and public participation in decision-making, it can be envisaged that visualisation and auralisation will play increasingly importantly roles for decision support in planning. It is critical, however, that technological advance and knowledge of
application should be balanced. Sufficient understanding of the strength, weakness, opportunities and challenges of visualisation and auralisation, is the prerequisite to avoid misuse of them and to fully enjoy their benefits.