Version: Accepted Version
Article:
Conway, S.J., Butcher, F.E.G. orcid.org/0000-0002-5392-7286, de Haas, T. et al. (3 more
authors) (2018) Glacial and gully erosion on Mars : a terrestrial perspective.
Geomorphology, 318. pp. 26-57. ISSN 0169-555X
https://doi.org/10.1016/j.geomorph.2018.05.019
Article available under the terms of the CC-BY-NC-ND licence
(https://creativecommons.org/licenses/by-nc-nd/4.0/).
eprints@whiterose.ac.uk https://eprints.whiterose.ac.uk/
Reuse
This article is distributed under the terms of the Creative Commons Attribution-NonCommercial-NoDerivs (CC BY-NC-ND) licence. This licence only allows you to download this work and share it with others as long as you credit the authors, but you can’t change the article in any way or use it commercially. More
information and the full terms of the licence here: https://creativecommons.org/licenses/
Takedown
If you consider content in White Rose Research Online to be in breach of UK law, please notify us by
Glacial and gully erosion on Mars: A terrestrial perspective
Susan J. Conway, Frances E.G. Butcher, Tjalling de Haas, Axel J.
Deijns, Peter M. Grindrod, Joel M. Davis
PII:
S0169-555X(18)30212-5
DOI:
doi:10.1016/j.geomorph.2018.05.019
Reference:
GEOMOR 6406
To appear in:
Geomorphology
Received date:
30 December 2017
Revised date:
22 May 2018
Accepted date:
22 May 2018
Please cite this article as: Susan J. Conway, Frances E.G. Butcher, Tjalling de Haas, Axel J.
Deijns, Peter M. Grindrod, Joel M. Davis , Glacial and gully erosion on Mars: A terrestrial
perspective. The address for the corresponding author was captured as affiliation for all
authors. Please check if appropriate. Geomor(2017), doi:10.1016/j.geomorph.2018.05.019
ACCEPTED MANUSCRIPT
1
Glacial and gully erosion on Mars: A terrestrial perspective
Susan J. Conway1*
Frances E. G. Butcher2
Tjalling de Haas3,4
Axel J. Deijns4
Peter M. Grindrod5
Joel M. Davis5
1. CNRS, UMR 6112 Laboratoire de Planétologie et Géodynamique, Université de Nantes, France
2. School of Physical Sciences, Open University, Milton Keynes, MK7 6AA, UK
3. Department of Geography, Durham University, South Road, Durham DH1 3LE, UK
4. Faculty of Geoscience, Universiteit Utrecht, Heidelberglaan 2, 3584 CS Utrecht, The Netherlands
5. Department of Earth Sciences, The Natural History Museum, Cromwell Road, London SW7 5BD,
UK
ACCEPTED MANUSCRIPT
2
Abstract
The mid- to high latitudes of Mars host assemblages of landforms consistent with a receding glacial
landscape on Earth. These landforms are postulated to have formed >5 Ma under a different climate
M 10° higher than today. Here, we investigate the
spatiotemporal relationship between gullies and glacial landforms, both common in the mid-latitudes.
Gullies are kilometre-scale landforms with a source alcove, transportation channel, and depositional
apron. The glacial landforms comprise (1) extant viscous flow features (VFF) that extend from the base
of crater walls into the interior of crater floors and are widely interpreted as debris-covered glaciers
containing extant ice, and (2) landforms such as arcuate ridges at the base of crater walls that have
been interpreted as relicts of more recent, less extensive glacial advances focussed on crater walls.
We measure headwall retreat associated with glacial landforms and date their host-craters to
constrain minimum headwall retreat rates. We record headwall retreat rates up to ~102 m My-1 for
the youngest suite of glacial landforms, equivalent to erosion rates of wet-based glaciers on Earth and
to headwall retreat rates associated with martian bedrock gully systems. We find extensive evidence
for a single erosional episode dating 5-10 Ma, which postdates emplacement of the majority of VFF
but seems to predate formation of the gullies. We propose that the wet-based glacial episode was
associated with glaciation focussed on the crater walls rather than melting of the glacial ice deposits
on the crater floors (VFF). This is consistent with our observations of crater wall morphologies,
including the presence of arcuate ridges consistent with terrestrial glaciotectonic features that require
liquid water to form, textural alteration of the eroded bedrock surface consistent with ice-segregation
and frost-shattering, and the presence of downslope pasted-on terrain, tentatively interpreted here
as glacial till deposits sourced from glacial erosion of the crater wall. The pasted-on terrain is usually
interpreted as a thicker, latitude-dependant mantle located on sloping terrain formed from airfall of
ice nucleated on dust, but we suggest that it has been reworked by glaciation and is predominantly
ACCEPTED MANUSCRIPT
3
discovery of this wet glacial event does provide evidence for widespread meltwater generation in
M
ACCEPTED MANUSCRIPT
4
1. Introduction
The martian mid-latitudes are host to a suite of landforms that indicate significant geologically
recent (10s 100s Ma) surface-atmosphere exchanges of water ice. This study focuses on two of the
most common landforms: martian gullies and glacier-like forms. We examine the role they have
played in landscape evolution over the last ten to hundreds of millions of years by using statistical
analysis of topographic data. In this introduction, we first present a brief overview of the state of
knowledge concerning the present and past distribution of ice and related landforms on Mars, then
specify how martian gullies fit into this context and finally present the scope of the present study.
1.1. The distribution of water ice on Mars
Water ice is stable and exposed at the surface at the two polar caps of Mars, which each contain a
volume of ice similar to the Greenland ice sheet on Earth ~106 km3 (Plaut et al., 2007; Putzig et al.,
2009; Bamber et al., 2013; Levy et al., 2014). Water vapour is contributed to the atmosphere by
seasonal sublimation of the north polar cap, which has higher summer temperatures than the
southern cap because of its lower altitude and higher atmospheric pressure (e.g., Richardson and
Wilson, 2002). It also has a larger part of the water ice cap exposed at the surface compared to the
south, where the rest of the surface is partially hidden by a perennial, thin, CO2 ice layer and by
surface debris (e.g., Thomas et al., 2000). Water vapour contributed to the atmosphere is
redistributed across the planet and can be deposited as surface frosts down to the mid-latitudes
(Svitek and Murray, 1990). Theoretical modelling predicts that ground ice on Mars should exist in
diffusive equilibrium with the atmospheric water vapour it should be cold trapped into the pores
of the regolith (Mellon and Jakosky, 1993; Fisher, 2005). This idea is supported by observations from
the Neutron and Gamma Ray Spectrometers on Mars Global Surveyor that found abundant
hydrogen in the top metre of the regolith down to ~50° latitude in both hemispheres, which can be
explained by an ice content of 4% to >64% in the regolith (Boynton et al., 2002; Feldman et al., 2004;
ACCEPTED MANUSCRIPT
5
polygonally patterned ground in the same latitudinal band, consistent with thermal contraction
cracks formed in ice-cemented soil over annual timescales (Mellon, 1997; Mangold, 2005; Levy et al.,
2009a; Schon et al., 2012). A trench dug by the Phoenix lander at 68°N found excess and pore ice
centimetres below the surface (as predicted by diffusive equilibrium models; Mellon et al., 2009),
newly formed impact craters have exposed water ice in their ejecta at latitudes down to 39° N
(Byrne et al., 2009; Dundas et al., 2014) and exposures of almost pure ice in eight ~800-m-high
scarps have been found at ~55° latitude (Dundas et al., 2018).
The latitude zone hosting ground ice is also an area that is smooth at scales of a kilometre
(Kreslavsky and Head, 2000), as measured from elevation data from the Mars Orbiter Laser Altimeter
(MOLA). This smoothing is partly attributed to the presence of the latitude-dependant mantle (LDM)
a deposit thought to consist of the remnants of an airfall deposit of ice nucleated on dust, where
the dust forms a sublimation lag protecting the remaining deposits from sublimation. Mustard et al.
(2001) and Milliken et al. (2003) found that the LDM exhibited degraded or pitted textures at
latitudes between 30 and 50° N and S, this change in texture coinciding with the change in surface
roughness found from MOLA data (Kreslavsky and Head, 2000). The surface age of the LDM has been
estimated at ~0.1-5 Ma and decreases in age with increasing latitude (Kostama et al., 2006; Levy et
al., 2009b; Schon et al., 2012; Willmes et al., 2012). The LDM generally consists of alternating
relatively ice- and dust-rich layers, indicating multiple generations of deposits formed under varying
climatic conditions (Schon et al., 2009a). Various surface textures/draping deposits have been
grouped under the term LDM, but we will argue below (see also Soare et al., 2017) that not all of
these necessarily represent airfall dust-ice deposits. In total, LDM deposits cover 23% of the surface
of Mars (Kreslavsky and Head, 2002) and are thought to contain 103-104 km3 of ice (Mustard et al.,
ACCEPTED MANUSCRIPT
6
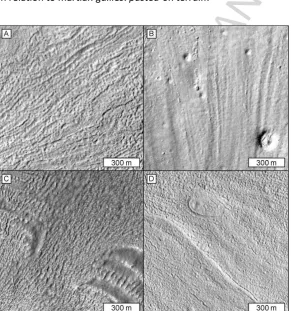
Fig. 1. Viscous flow features on Mars in local sinusoidal projections, north is up in all panels. (A)
Lobate debris apron in Deuteronilus Mensae, CTX image F22_044466_2278. (B) Concentric crater fill
in Utopia Planitia, CTX image P15_007067_2124. (C) Lineated valley fill in the Arabia Terra region,
CTX image F06_038017_2202. (D) Glacier-like form in Protonilus Mensae, CTX image
G03_019358_2225.
Another significant reservoir of ice on Mars are the viscous flow features (VFF) found in the martian
mid-latitudes (e.g., Squyres, 1979; Milliken et al., 2003; Levy et al., 2014). They have a total
estimated volume of 4.2 x 10⁵ km3, which is ~20% of the total volume of the polar caps (Levy et al.,
2014). We will use VFF as an umbrella term for a range of landforms thought to be similar to
debris-covered glaciers on Earth. They include the following (illustrated in Fig. 1):
Lobate debris aprons (LDA) these are smooth aprons that extend from and encompass
mesas. They can extend several to tens of kilometres from their mesa, and orbital radar
observations have confirmed that they can be up to 1 km thick and contain >90% ice (Holt et
[image:8.595.73.434.67.384.2]ACCEPTED MANUSCRIPT
7
Morgan et al., 2009; Baker et al., 2010; Hartmann et al., 2014) to ~1 Ga (e.g., Levy et al.,
2007; Baker and Head, 2015; Berman et al., 2015). The LDAs are the largest reservoir of ice
among the VFFs (Levy et al., 2014).
Crater interior ice deposits, including concentric crater fill (CCF) these deposits fill and
smooth-over the floors of impact craters and are ubiquitous in the mid-latitudes (they
number >9000; Levy et al., 2014). Levy et al. (2014) estimated that ice thicknesses can range
up to 1.7 km. The surface of these fills often expresses lineations either concentric to the
crater walls (in this case they are called CCF) or can instead be oriented in one direction
(Dickson et al., 2012), and these orientations vary with latitude (pole-facing 30-45° and
concentric >45°). They have been dated to be as young as 10 Ma (Levy et al., 2009b) and as
old as 700 Ma (Fassett et al., 2014). Crater interior ice deposits can cover part or all of the
crater floor. Crater interior ice deposits are found in craters 2-72 km in diameter (Dickson et
al., 2012) and represent the second largest reservoir of ice of the VFFs.
Lineated valley fill (LVF) these infill existing valleys, being particularly abundant near the
martian dichotomy boundary. Their longitudinal ridges are thought to represent flow lines or
lateral compression from convergence of LDA on opposite valley walls (e.g., Squyres, 1978,
1979; Carr, 2001). Age estimates for LVF are similar to those for LDA: 100-500 Ma (e.g.,
Morgan et al., 2009). The LVF represents the third largest reservoir of ice among the VFFs.
GLF, glacier-like-forms these landforms are the most similar in scale and form to terrestrial
valley glaciers (Hubbard et al., 2011; Souness and Hubbard, 2012; Souness et al., 2012;
Brough et al., 2016a). They usually originate from large alcoves in escarpments that can be
on crater walls, valley walls, or mesas; are laterally confined to a valley/depression; and can
extend out onto plains. The GLF are on average ~4 km long and ~1 km wide, and the largest
examples are ~35 km long (Souness et al., 2012). We also include in this category lobate
forms, such as those described in Milliken et al. (2003), Berman et al. (2009), and Hartmann
ACCEPTED MANUSCRIPT
8
of superposed craters, these landforms are generally assumed to have an age of 10-100 Ma
and are thus younger than other VFF (Arfstrom and Hartmann, 2005; Berman et al., 2009;
Hartmann et al., 2014; Hepburn et al., 2018).
Apart from occasional radar evidence for water ice under the debris cover of VFFs (Holt et al., 2008;
Plaut et al., 2009), evidence for ice content is indirect and includes the presence of ablation textures
(fractures, pitted surface, inverted/deformed impact craters, including ring mold craters) (Kress and
Head, 2008), lineated surface topography thought to represent flow lines (e.g., Brough et al., 2016b),
and depositional landforms (e.g., terminal moraines) (Head et al., 2010; Brough et al., 2016b) (Fig.
2). The VFFs are believed to behave like cold-based glaciers on Earth, where the ice is frozen to the
bed and the flow is dominated by deformation of mass above by gravity-driven viscous creep
(Mangold and Allemand, 2001; Pierce and Crown, 2003; Li et al., 2005; Karlsson et al., 2015). Only in
two locations have eskers been linked to VFF, providing evidence of basal glacial melting (Gallagher
and Balme, 2015; Butcher et al., 2017). Rare supraglacial valleys have been attributed to transient
supraglacial melting encouraged by focussing of solar radiation onto VFF surfaces from steep
adjacent topography (Fassett et al., 2010).
The ice present in the ground (including LDM) and in VFF is believed to be in diffusive equilibrium
with the atmosphere, yet insufficient water vapour can be mobilised at the present day to explain
the presence of these large ice masses. The formation of VFF and LDM has been attributed to an
increase in average orbital obliquity, leading to transfer of large amounts of ice to the mid-latitudes
(Levrard et al., 2004, 2007; Madeleine et al., 2009). M the Earth (25°), but in the past 5 Ma has oscillated between 15° and 30° (with a periodicity of
~100 ka) and from 5 to 10 Ma between 28° and 45° (Laskar and Robutel, 1993; Laskar et al., 2004).
Seasonal temperature asymmetries increase with obliquity: at high obliquity, polar regions receive
increased insolation and the north polar cap is believed to have been completely destabilised around
ACCEPTED MANUSCRIPT
9
exchange in water ice and CO2 becomes more intense at higher obliquity, and surface ice and ground
ice are predicted to become stable even at equatorial latitudes.
1.2. Gullies and their relation to ice on Mars
The global distribution of martian gullies is spatially correlated with the distribution of water ice
landforms described above. Gullies occur across the same range of latitudes as VFF, but they are less
common where high concentrations of LDA and GLF occur and are only found in 12% of craters with
interior ice deposits (Conway et al., 2018a). They are strongly linked to the presence of LDM (Levy et
al., 2011; e.g., Dickson et al., 2015), although in the case of gullies the textures of this slope-side
surficial deposit, into which they incise, are somewhat different to the LDM found in the plains;
hence in this contribution we will refer to this unit using the term first coined by Christensen (2003)
[image:11.595.74.366.363.675.2]in relation to martian gullies: pasted-on terrain.
Fig. 2. Surface textures of viscous flow features on Mars at scales of 1:15,000. North is up in all
panels and lighting is from the left (east). (A) Surface texture of crater interior ice deposits showing
ACCEPTED MANUSCRIPT
10
image ESP_028651_1370. (B) A ring-mold crater (bottom right) on the surface of a crater interior
ice-deposit together with muted craters and normal craters, also showing surface lineations in HiRISE
image ESP_046308_1425. (C) A lobate debris apron in Deuteronilus Mensae showing typical
contorted raised and pitted surface patterns in HiRISE image ESP_018515_2225. (D) Lineated valley
fill in the Acheron Fossae region with pitted and cracked textures and a deformed impact crater (the
valley is oriented NW-SE) in HiRISE image ESP_016266_2165.
Gullies are typically kilometre-scale landforms found on steep slopes in the mid- to high latitudes of
both hemispheres (~30° to the polar caps; Harrison et al., 2015; Conway et al., 2017). They comprise
a tributary source alcove, transport channel, and depositional apron (Malin and Edgett, 2000). They
are found primarily on pole-facing slopes at latitudes between 30° and 40° and then mostly on
equator-facing slopes poleward of 40° (but they can also occur on pole-facing slopes in this latitude
interval). The relative lack of gullies in regions with no evidence for ground ice (between 30° N and
30° S), and their trends in orientation with latitude have led authors to conclude that changes in
orbital obliquity are required to explain their present-day distribution (e.g., Costard et al., 2002; de
Haas et al., 2015a). However, the process by which gullies form is under strong debate. Present-day
activity in gullies is thought to be brought about via slope instability caused by sublimation of carbon
dioxide (Diniega et al., 2010; Dundas et al., 2010, 2012, 2015, 2017; Raack et al., 2015; Pasquon et
al., 2016), and the distribution of surface carbon dioxide ice is strongly controlled by the presence of
(water) ground ice (Vincendon et al., 2010). However, whether such a process alone can explain the
formation of the whole landform remains uncertain. In particular, equator-facing slopes at the
present-day and in the past are not favourable locations for deposition, and thus sublimation, of CO2
ice (Conway et al., 2018a). Formation by liquid water is consistent with the morphology and
morphometry of gullies (e.g., Malin and Edgett, 2000; Conway and Balme, 2016), yet liquid water is a
poor candidate to explain the present-day activity and can only be invoked under certain specific
ACCEPTED MANUSCRIPT
11
2009). Hence, understanding the interaction of gullies with other landforms in time and space has
the potential to break this impasse.
Our knowledge on the timing of the activity and the overall age of gully systems is relatively limited.
We know that gullies on martian dunes have such frequent and voluminous activity that their
full-extent can be explained on a timescale of hundreds of years (Pasquon et al., 2017). Dundas et al.
(2010, 2012) estimated that mid-latitude gullies (not formed in sand but in other materials, including
bedrock and mantling materials) could be formed within the last few millions of years given the
currently observed magnitude and frequency of their activity. Non-sand gullies also have
morphological evidence for multiple episodes of activity in one case authors have ascertained the
age of part of a gully fan where other parts of the fan pre- and postdate the determined age of ~1.25
Ma (Schon et al., 2009b). Dickson et al. (2015) found common evidence of relict gullies, being
exhumed from and buried by LDM (pasted-on terrain), showing that gully activity must extend into
epochs when this deposit was being formed/removed (estimated to be ~0.1-5 Ma; Kostama et al.,
2006; Willmes et al., 2012) .
De Haas et al. (2015b) found that gully alcoves had a similar size independent of the age of the host
crater, and de Haas et al. (2018) proposed that gullies could have their erosion reset during glacial
epochs. In the youngest craters where gullies are found emanating from well-defined bedrock
alcoves cutback into the crater rim, de Haas et al. (2015b) estimated headwall retreat rates of 10-4 to
10-1 mm y-1, which correspond to the backweathering rates experienced on rockwalls in Arctic,
Nordic, and Alpine environments on Earth. De Haas et al. (2018) classed a crater as glaciated if it
contained one or more of the following morphological features: arcuate ridges and/or spatulate
depressions at the foot of the slope (Fig. 3; Arfstrom and Hartmann, 2005; Berman et al., 2005; Head
et al., 2008; Hubbard et al., 2011; Jawin et al., 2018), floor-filling CCF indicated by concentric ridges
and/or pitted textures within identifiable in-crater deposits (e.g., Levy et al., 2010; Dickson et al.,
ACCEPTED MANUSCRIPT
12
and have longitudinal or transverse ridges and/or pitted textures on their surfaces (Fig. 2; e.g., Baker
et al., 2010; Head et al., 2010). Several authors (e.g., Berman et al., 2005, 2009; Head et al., 2008;
Hauber et al., 2011a; Schon and Head, 2011, 2012; Dickson et al., 2015; de Haas et al., 2018; Jawin et
al., 2018) have suggested that these glacial landforms represent different stages of ice-deposition
and removal (glacial-interglacial cycles) during martian obliquity cycles. The VFFs were able to form
during glacial epochs when average obliquity was higher than today (>5 Ma). Since the last
formation of VFF, LDM (pasted-on terrain) was deposited during smaller ice ages, which occurred
during obliquity peaks in the present, lower-average obliquity regime (e.g., Mellon and Jakosky,
1995; Head et al., 2003; Madeleine et al., 2014). Many gullies that are present on Mars today have
formed into VFF or LDM remnants (e.g., Dickson et al., 2015; de Haas et al., 2018), and thus their
formation is strongly linked to VFF and LDM (pasted-on terrain).
Berman et al. (2005) and Head et al. (2008) noted that the rims of craters with arcuate ridges and
gullies on their pole-facing walls had a lower elevation than equator-facing walls of the same craters.
The model proposed by de Haas et al. (2018) hypothesise that evidence of gully erosion (alcoves and
channels) is removed from crater walls by glacial erosion and/or buried by glacial deposits after
sublimation/melting. Further, Levy et al. (2016) estimated that VFF can be responsible for 10-5-10-4
mm y-1 of erosion. However, no study to date has attempted to directly assess the amount of
ACCEPTED MANUSCRIPT
[image:15.595.70.436.70.300.2]13
Fig. 3. Niquero Crater on Mars, an example with a crater interior ice deposit, arcuate ridges,
pasted-on terrain and gullies. North is up in all panels. (A) Overview of crater in CTX image
P03_002383_1417. Arrows indicate the southernmost extent of the crater interior ice-deposit. (B)
Detail of gullies (labelled as g) and arcuate ridges (labelled as ar) within a spatulate depression
with the presence of pasted-on terrain labelled as po. HiRISE image ESP_030021_1410.
1.3 Objectives and structure
Here we use high resolution topographic data and dating of host craters to assess the amount and
rate of erosion that these small-scale crater wall glaciers may have been responsible for and use
analogy with glacial systems on Earth to assess by what mechanisms this erosion could have
occurred. In our approach we use the consilience and coherence of the landforms and their spatial
and topographic properties and relationships to go beyond analogy using the similarity of
appearance of single landforms (Baker, 2014, 2017). We also compare to erosion rates in gullied
craters without pasted-on terrain to assess whether glaciation is capable of erasing gullies on Mars.
This paper is structured as follows. First, we explore the link between the pasted-on terrain (into
which gullies often incise) and glaciation by undertaking a global survey and highlighting key
ACCEPTED MANUSCRIPT
14
subset of these craters and of gullied craters to ascertain the amount and rate of erosion of their
walls and its link to previous glaciation. Third, we consider the morphological and topographical
evidence gathered on Mars in light of the present knowledge of glacial erosion on Earth in order to
build a coherent picture of the degradation of crater walls on Mars. Finally, we bring together
knowledge from the martian literature to assess the consistency of our new hypothesis within the
context of previous findings.
2 Global distribution and thickness of pasted-on terrain
2.1. Approach
We performed the majority of our morphological observations on NASA Mars Reconnaissance
Orbiter High Resolution Imaging Science Experiment (MRO HiRISE) images at 25-50 cm/pixel taken
up to April 2017. We used the Harrison et al. (2015) gully-distribution database as the basis for our
initial survey, down-selecting to HiRISE images that were in the vicinity of gullies. Within this
database we noted the occurrence of arcuate ridges associated with gully incisions and made
observations on the nature of the pasted-on deposits associated with the gullies. We also searched
for examples of craters without gullies but with pasted-on terrain and/or arcuate ridges by
examining craters <10 km from the Robbins and Hynek (2012) database with (projection corrected)
slopes of >20° derived from the MOLA-gridded data that had overlapping HiRISE images. We
performed a random sample of this data set and many craters that do not have gullies but have
pasted-on terrain and/or arcuate ridges will have been missed. Hence, this data set was not used to
derive any global distribution statistics but to highlight pertinent relationships.
We recognised arcuate ridges in HiRISE images using the following criteria: a sinuous to highly
arcuate ridge located at the foot of the crater wall and somewhat parallel to the crater rim (Figs.
4A-C). We identified pasted-on terrain as being a draping unit that smoothed the appearance of the
crater wall at scales of ~1:25,000 with an upper lobate boundary (Figs. 4D-F). Gullies incised into this
ACCEPTED MANUSCRIPT
15
completely sourced within this unit, having a simple single elongate incision (Fig. 4E; Aston et al.,
2011; Conway and Balme, 2014). It is worth noting that not all gullies have such V-shaped incisions.
We previously performed measurements on HiRISE digital terrain models (DTM) and determined
that the slopes of these incisions were on average 20° and ranged between 15° and 30° (Conway and
Balme, 2014). Assuming a 20° slope, these incisions can be used as an estimate of the minimum
depth of the pasted-on terrain simply by measuring the wall-length of the incision (Conway et al.,
2015). We undertook a systematic survey of the incision wall-lengths in our HiRISE database in order
to assess any trends in the thickness of pasted-on deposits with latitude. For craters hosting multiple
gully systems, we measured the deepest incision because the depth of this incision should be closest
to the total thickness of the pasted-on terrain.
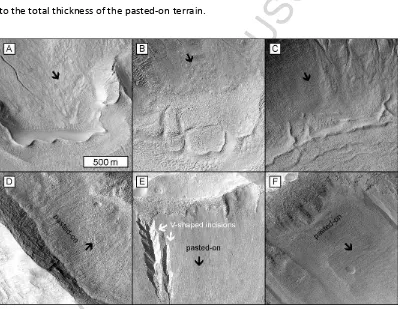
Fig. 4. Recognition of arcuate ridges and pasted-on terrain in HiRISE images at 1:25,000, north is up
in all panels, the downslope-direction is indicated by the black arrows and the scale for all panels is
as indicted in panel (A). (A-C) Arcuate ridges in HiRISE images: ESP_038236_1410, ESP_023809_1415
and ESP_020051_1420. (D-F) Pasted-on terrain in HiRISE images: ESP_027477_2170,
[image:17.595.73.491.310.619.2]V-ACCEPTED MANUSCRIPT
16
shaped incisions to the left of the panel, where the right-hand one of the pair is completely within the
pasted-on terrain.
2.2. Pasted-on terrain
The surface texture of the pasted-on terrain often appears smooth and uniform at scales of
~1:25,000, yet at scales of ~1:5000 or less we were able to identify three principal textures:
downslope lineated (Fig. 5A), smooth (Fig. 5B) and polygonised (Fig. 5C). Polygonal textures were
more often most clearly expressed within the gully incisions, as previously noted in the literature
(Levy et al., 2009c; Soare et al., 2014) (Fig. 5D). As noted by Conway and Balme (2014), the lineations
are cut by the gully incisions (Fig. 5E) and fresh incision walls have no polygonal textures and sharp
breaks in slope, whereas incisions with polygonal textures are shallower and have a more subdued
break in slope (Fig. 5F). We found that the pasted-on terrain is systematically associated with a
change in the appearance of the crater rim compared to the opposite crater rim (Fig. 6F vs. 6I) and
compared to crater rims of fresh equatorial craters (Watters et al., 2015; Tornabene et al., 2018)
(Fig. 6F vs. 6D, G). Bedrock is often exposed in the top few hundred metres of crater walls and is
particularly evident in young impact craters (Figs. 6D, G). It usually appears as a series of sub parallel
relatively massive beds and, particularly in fresh equatorial impact craters, displays a spur-and-gully
morphology with a series of regularly spaced shallow alcoves. The rim crest of these craters remains
relatively linear despite the presence of these alcoves (Figs. 6D, G). In comparison, the crater wall
immediately above the upslope boundary of pasted-on terrain does not have a spur-and-gully
morphology but is rather planar with a distinctive mottled texture (we refer to this as texturally
altered bedrock in the rest of this paper Fig. 6F). The rock exposure is rather patchy with no clear
massive bedrock outcrop, and the surface is often dominated by loose-appearing metre- to
decametre-scale boulders. Discontinuous rim-parallel lineations (Fig. 6F) are sometimes apparent
with no clear relationship to the underlying bedrock structure. Where texturally altered bedrock is
present, the crater rim has very little deviation from circular in planform (Fig. 6C), and sometimes
ACCEPTED MANUSCRIPT
17
has been previously associated with erosion of crater walls (diameter <35 km) by lobate debris
aprons in Alba Mons by Sinha and Vijayan (2017). This contrasts with the appearance of the rims of
craters with gullies and no pasted-on terrain, which maintain the massive bedrock appearance, and
have rim-traces that are crenulated with greatly accentuated spur-and-gully morphology compared
[image:19.595.73.479.209.499.2]to unmodified crater walls as noted in de Haas (de Haas et al., 2015b, 2018) (Figs. 6B,E).
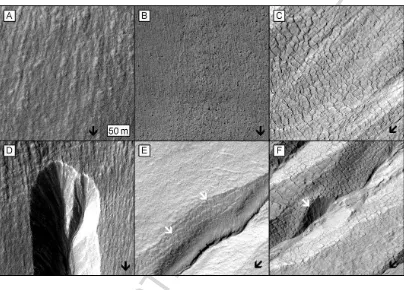
Fig. 5. Examples of pasted-on terrain textures, each image has the same scale as indicated in panel
(A) at 1:5000. Black arrows indicate the downslope direction. (A) Lineated texture of the pasted-on
terrain on the south-facing wall of Bunnik Crater, HiRISE image PSP_002514_1420. (B) Smooth
texture of the pasted-on terrain, with rocks visible at the surface in HiRISE image ESP_033173_1400.
(C) Polygonised texture of the pasted-on terrain in HiRISE image ESP_011672_1395. (D) Lineated
texture of the pasted-on terrain cut by gully incision in Bunnik Crater, where polygons are weakly
visible in the sun-facing wall of the incision, HiRISE image PSP_002514_1420. (E) Polygons visible
inside the gully incision (white arrows) but not on the surrounding pasted-on terrain in HiRISE image
ACCEPTED MANUSCRIPT
18
polygonised pasted-on terrain (white arrow). Polygonal patterns are again present on more gently
[image:20.595.71.503.130.703.2]sloping incisions. HiRISE image ESP_011672_1395.
Fig. 6. Rock exposures in fresh equatorial impact craters (left panels), gullied impact craters (middle
ACCEPTED MANUSCRIPT
19
(A) and is 1:120,000 and the scale in panels (D-I) is given in panel (D) and is 1:15,000. North is up in
all panels. All craters are in the southern hemisphere. Red panels show the pole-facing slopes and
blue panels show the equator-facing slope. (A,D,G) Kenge Crater, a fresh equatorial crater from the
database of Tornabene et al. (2018) in (A) CTX image B07_012315_1635 and (D,G) HiRISE image
ESP_011893_1635. (B,E,H) Galap Crater with gullies eroded into the bedrock in (B) CTX image
B09_012971_1421 and (E,H) HiRISE image PSP_003939_1420. (C,F,I) Nybyen Crater with pasted-on
terrain and gullies in (C) CTX image G09_021563_1427 and (F,I) HiRISE image PSP_006663_1425.
Discontinuous ridges are highlighted by white arrows. (J,K) A crater in the Newton Basin with a
planed-off rim in (J) HiRISE image PSP_ 002620_1410 and (K) elevation profile taken from the
ACCEPTED MANUSCRIPT
[image:22.595.72.520.70.531.2]20
Fig. 7. Configuration of pasted-on terrain within craters on Mars. North is up in all panels. (A)
Pasted-on terrain extending to within ~20-50 m of a crater rim in HiRISE image ESP_034363_1380. (B)
Pasted-on terrain covering only the lower 1/2-1/3 of the inner crater wall in HiRISE image
ESP_038157_1415. (C) Pasted-on terrain as remnants between gully systems (labelled by white r ) in
HiRISE image ESP_011672_1395. (D) Pasted-on terrain on the exteriorwall of an impact crater in
HiRISE image ESP_023809_1415. (E,F) Pasted-on terrain where only some of the bedrock has been
texturally altered above it (extent indicated by arrowed line) and the rest still has alcoves. HiRISE
images ESP_014400_1525 and PSP_009164_2140, respectively. (G,H) Pasted-on terrain extending
ACCEPTED MANUSCRIPT
21
panel (G). HiRISE images PSP_006629_1425 and ESP_033398_1420 respectively. (I) Pasted-on terrain
that appears to emerge from beneath mantle material (marked by m ) with degradation textures as
described by Mustard et al. (2001) and Schon et al. (2009a), HiRISE image ESP_011839_1460.
The pasted-on terrain can be found extending nearly all the way up to the top of the crater rim (Fig.
7A), or only on the lower half of the crater wall (Fig. 7B), or as remnants between extensive gully
systems (Fig. 7C). Pasted-on terrain can be found on the interior (Figs. 7A-C) and exterior crater walls
(Fig. 7D) and is almost exclusively associated with an altered texture of the upslope bedrock. In two
rare circumstances, texturally altered bedrock is found only on part of the wall with pasted-on
terrain (illustrated in Figs. 7F-I). The first of these circumstances involves very young craters (as
attested by few superposing impact craters <1 Ma, Table 1), where pasted-on terrain is found in the
absence of any other evidence of glaciation (e.g., crater interior ice deposits , arcuate ridges, large
lobate tongues, glacial textures) and also occurs without gullies. In the two cases that we found (one
in the northern and one in the southern hemisphere; Figs. 7E, F) alcoves in texturally unaltered
bedrock are present above some of the pasted-on terrain; but where the pasted-on terrain extends
beyond the foot of the crater wall, the alcoves are reduced and textural alteration has occurred. In
the second circumstance, pasted-on terrain can extend upward into wide (hundreds of metres)
alcoves leaving texturally unaltered bedrock on the spurs separating the alcoves, yet texturally
altered bedrock upslope (Fig. 7G). In other places where pasted-on terrain extends into alcoves, the
bedrock on the alcove spurs and on the rim-crest are texturally altered as shown in Fig. 7H. In one
example we found pasted-on terrain coexisting with terrain hosting textures normally associated
with degrading latitude-dependent mantle, namely exposed layers and extensive pitting (e.g.,
Mustard et al., 2001; Schon et al., 2009a). As shown in Fig. 7I, the pasted-on terrain seems to be
emerging from beneath this mantle.
Our global incision survey shows that the thickness of the pasted-on terrain tends to increase with
ACCEPTED MANUSCRIPT
22
increasing scatter at higher latitudes (Fig. 8). The only difference between the hemispheres in Fig. 8
is that incisions are noted at lower latitudes in the southern hemisphere compared to the northern
hemisphere (28°S vs. 32°N). Incision depths are greater in the Argyre Basin than elsewhere (Fig. 9A).
Gullies with incisions follow the same spatial distribution as the gully population as a whole (Fig. 9)
and form a larger percentage of the overall gully population in the northern hemisphere compared
to the southern hemisphere (~100% compared to ~50% respectively; Fig. 9).
The pasted-on terrain, where present with other crater interior ice deposits, gradually transitions in
texture and topography into these other bodies, not presenting a single clean delimitation between
ACCEPTED MANUSCRIPT
23
Fig. 8. Estimated gully incision depth against latitude, top: northern hemisphere and bottom:
southern hemisphere. The solid lines represent mean values for each 5° of latitude. Dashed lines
represent standard deviations for each 5° of latitude. The variable n is the number of data points
[image:25.595.74.505.183.673.2]within the graph.
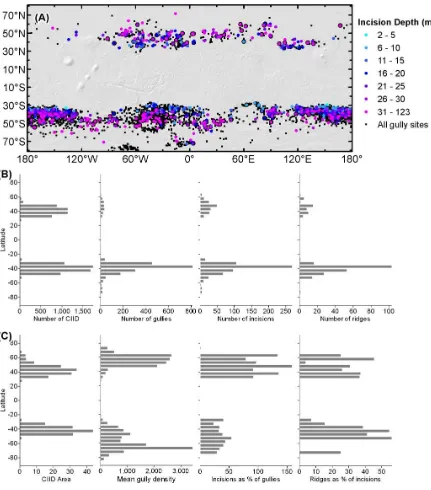
Fig. 9. Global and latitudinal distribution of gullies, gully incisions, crater interior ice deposits, and
arcuate ridges. (A) Map of gullies (Harrison et al., 2015) and depth of incisions measured in this
ACCEPTED MANUSCRIPT
24
Bar charts giving the counts, from left to right, of crater interior ice deposits (CIID), gullies, incisions,
and arcuate ridges per latitude band. Bar graphs were made from supplementary data of Levy et al.
(2014) and Harrison et al. (2015). (B) From left to right: summed crater interior ice-deposit (CIID) area
per 5° latitude bin in 103 km2, mean gully density per latitude from Conway et al. (2018a) that
normalises gully density based on the frequency of steep slopes found at that location, number of
incisions as a percentage of the number of gullies in the same latitude bin, and number of arcuate
ridges as a percent of the number of incisions per latitude bin. Note that the percent of incisions
exceeds 100% because of the nature of the two surveys: Harrison et al. (2015) counted sites (in which
many gullies could be present), and our incision survey counted individual gullies; hence there are
latitude bins where the number of incisions exceeds the number of sites.
2.3. Arcuate ridges and crater interior ice deposits
Fig. 9C shows the latitudinal distribution of the 148 arcuate ridges coexisting with incised gullies.
Where ridges are associated with incised gullies, they tend to occur at higher latitudes a trend
more obvious in the southern hemisphere. We find no difference between with thickness of
pasted-on terrain in the systems with arcuate ridges and those without, even when cpasted-onsidered by latitude
(Fig. 9).
The arcuate ridges are often found in association with crater interior ice deposits (57% found within
5km of the boundary of crater interior ice deposits mapped by Levy et al., 2014), which can form
lobes of material that extend from the pole-facing crater wall beyond the ridges onto the crater floor
(Figs. 3A, 10A-C, I). In both cases the arcuate ridges are commonly outlined by spatulate depressions
that appear to push into the VFF. We found no evidence of arcuate ridges occurring without any kind
of existing crater interior ice deposit. We find that pasted-on terrain always occurs upslope of the
arcuate ridges and, by association, that arcuate ridges always coexist with texturally altered bedrock
ACCEPTED MANUSCRIPT
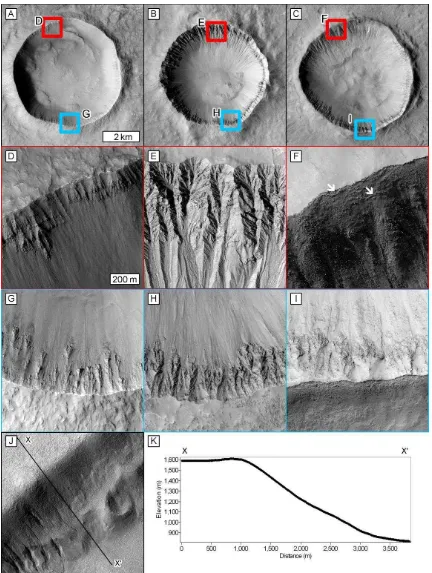
[image:27.595.73.523.68.623.2]25
Fig. 10. Relationship between pasted-on terrain, arcuate ridges, and lobate or crater interior ice
deposits. North is up in all panels. (A) Arcuate ridges within a lobe of crater interior ice deposits
where the lobate margin appears to curve around obstacles. HiRISE images ESP_023809_1415 and
ESP_024943_1415. (B) Arcuate ridges into crater interior ice deposits that extend across the whole
ACCEPTED MANUSCRIPT
26
ESP_016227_1405 and ESP_016438_1405. (C) Arcuate ridges into crater interior ice deposits that
extend across the whole crater floor with no flowlines, yet pitted surface texture similar to other VFF,
in the northern hemisphere. HiRISE images ESP_013277_2155 and ESP_022059_2150. (D) Crater E
overview in CTX image P19_008307_2138 showing the position of the cross-profile in (E). (F-H) Panels
using HiRISE image PSP_009164_2140 at 1:10,000 showing (F) the boundary between the pasted-on
terrain and the crater floor, (G) the transition from the lineated pasted-on terrain texture to glacial
texture midway down the crater wall, and (H) the boundary between the lineated pasted-on terrain
and the texturally altered bedrock. (I) Taltal Crater overview in CTX image G09_021712_1402,
showing the location of the cross-profile in panel (J). (K-M) Panels using HiRISE image
ESP_21712_1400 at 1:10,000 showing (K) the boundary between the pasted-on terrain and the
arcuate ridges, (L) the transition between the polygonised pasted-on texture and VFF surface textures
midway down the crater wall, and (M) the boundary between the polygonised pasted-on terrain and
the texturally altered bedrock.
Although we did not survey for arcuate ridges that do not coexist with gullies (this is ongoing),
Berman et al. (2005) systematically surveyed all the gullies and arcuate ridges in Newton Basin using
Mars Orbiter Camera (MOC) narrow angle images at 1.5 m/pixel and THEMIS (Thermal Emission
Imaging System) visible images. They found 188 craters with gullies, 118 craters with arcuate ridges,
and 104 craters with both, consistent with our finding that up to ~55% of incised gullies also have
associated arcuate ridges (Fig. 9). Berman et al. (2009) found that for craters with diameters >20 km
in Arabia terra, Newton Basin, and Eastern Hellas, arcuate ridges were almost exclusively associated
with gullies. The arcuate ridges had an even stronger preference for pole-facing crater walls than
gullies. Berman et al. (2005) and de Haas et al. (2018) noted a spatial correlation between gully
alcoves and the position of the most arcuate sections of the ridges: inflections between successive
arcuate segments have similar widths to the alcoves located topographically above them; our
observations agree. Moreover, the arcuate ridges below the largest alcoves also protrude farthest
ACCEPTED MANUSCRIPT
27
with patterned floors interpreted as ice-rich crater fill (here termed craterinterior ice deposits) and
mantling materials. These crater interior ice deposits sloped away from the margins of the fill
proximal to the arcuate ridges, the slope direction aligning with the lineations expressed within the
surface of these fills, also noted by Head et al. (2008).
3. Erosion of crater walls
3.1. Approach
In order to assess the magnitude and rate of erosion associated with crater glaciation, we made a
series of topographic measurements and dated host craters via measurement of crater
size-frequency distributions.
The first criteria in our site selection was the existence of either a preexisting digital terrain model
(DTM) or a suitable stereo pair of images for creating a DTM. From these we selected three classes
of craters:
Pristine impact craters in the databases of Watters et al. (2015) and Tornabene et al. (2018),
preferably located in the equatorial latitudes, but otherwise without evidence for any of the
following features: pasted-on terrain, other mantling deposits, arcuate ridges, or gullies.
Craters with gullies, but no evidence of pasted-on terrain, other mantling deposits, or
arcuate ridges; preferably possessing HiRISE elevation data spanning north- and south-facing
walls.
Craters with pasted-on terrain that can have arcuate ridges and/or gullies. Preferably having
HiRISE elevation data spanning north- and south-facing walls.
In all cases we favoured craters with a simple rim morphology, lacking wall terraces and wall collapse
features. This criteria and use of HiRISE images restricted our crater diameters to <20 km. We
ACCEPTED MANUSCRIPT
[image:30.595.72.515.70.380.2]28
Fig. 11. Overview of approach for measuring recession rates of crater walls. (A) Talu Crater with
elevation swath overlain on HiRISE image ESP_011672_1395 (blue colours are high elevations, red
colours low). (B) The swath profile from panel (A) with the mapped bedrock shown in orange. (C)
Overview of the swath profiles measured on the northern rim of Talu Crater with the one in panel (A)
highlighted in red. (D) Elevation data against distance from the rim-crest extracted from the swath
shown in panel (A) with blue shades representing the raw data and black points showing the mean
elevation every 1 m. (E) The same profile as in panel (B) but showing only the crater rim. Grey points
are all the profile datapoints, superposed by red points that are used to perform a linear fit to obtain
the bedrock slope on the inner wall (points 20-400 m from the rim with bedrock outcrop), pink points
are bedrock outcrop lying farther than 400 m from the rim, and green points are those used to
perform a linear fit to obtain the slope of the bedrock on the exterior wall (points 20-100 m from the
rim with bedrock outcrop). Linear fits are shown as black dashed lines. (F) Diagram illustrating the
method by which we calculated the headwall retreat. The black line represents the crater wall for
ACCEPTED MANUSCRIPT
29
slope . The dotted grey line is either a pristine crater wall or an unmodified wall in the same crater
with the blue line representing the linear fit to obtain its slope . The orange distance l is the exposed
length of bedrock as observed from the orthorectified images. The recession r is calculated asl - l
(tan For interpretation of the references to colour in this figure legend, the reader is referred to the web version of this article.
Where existing HiRISE elevation data did not exist we used either the SocetSet ISIS3 workflow (Kirk
et al., 2008) or the freely available Ames Stereo Pipeline (ASP) (Moratto et al., 2010; Shean et al.,
2016) to produce additional elevation data. For both, we followed standard procedures in ISIS3 to
produce single unprojected seamless images from the 9-10 individual HiRISE CCD images. These
mosaicked images were map projected in ISIS3 to improve the point matching in ASP. We used
standard settings to run ASP, with the Bayes EM subpixel mode with a 15 pixel subpixel kernel to
improve results on steep terrain. We used ESA Mars Express High Resolution Stereo Camera
elevation data to coregister and correct any tilting in the resulting point cloud with the routine
pc_align . For the SocetSet workflow we followed the standard USGS procedure, but sometimes
used the low contrast strategy at the DTM creation step, which can produce less noisy results.
In order to estimate the headwall retreat of the crater bedrock we measured the slope of the
bedrock materials found just below the crest of the crater rim. We automatically extracted these
data by taking 300-m-wide swath profiles perpendicular to the rim trace. We used swath profiles in
order to generate data robust to noise in the elevation data and whose slopes would be
independent of the presence or absence of alcoves. We mapped where the bedrock cropped out
within each swath. For each swath profile we created an average profile, by binning the data by
distance every metre from the crater rim and taking the mean of the points within each bin. We
performed a linear fit of the elevation data within bedrock outcrops between 20 and 400 m from the
ACCEPTED MANUSCRIPT
30
100 m on the exterior crater wall. This procedure is illustrated in Fig. 11. We did not measure any
cases where pasted-on terrain extended up to the crater rim because no bedrock is exposed.
We classified the swath profiles into four types depending on their association with identified
landforms within each crater: i) unmodified, ii) gullies present, but no evidence of glacial
modification, iii) gullies present with evidence of glacial modification; and iv) evidence of glacial
modification, but no gullies.
In order to convert the reduction in slope to a headwall retreat rate, we first need to estimate the
amount (length l, Fig. 11) of crater wall that has experienced this reduction in slope and then
combine this recession length with the crater age to obtain a minimum headwall retreat rate for our
studied craters. We measured the mean distance from the crater rim over which bedrock was
exposed to provide a minimum estimate of the horizontal length (l in Fig.11) of the crater wall that
had undergone slope reduction. We calculated two slope-reduction quantities:
(i) the slope reduction with respect to the opposing (unmodified) wall in the same crater (if
available) to give an estimate of the acceleration in erosion over the background rate; and
(ii) the slope reduction with respect to the maximum average wall slope value of pristine
equatorial craters to give the cumulative erosion over the lifetime of the crater.
To estimate the headwall retreat rate under the more likely scenario that periods of enhanced
erosion punctuated the background headwall retreat rate, we followed Levy et al. (2016) and
calculated the retreat rate over a time period of 0.5 Ma based on the slope-reduction given by (i).
Levy et al. (2016) used a time interval of 0.5 Ma based on previous estimates for the duration of the
last glacial epoch by Fassett et al. (2014) and the amount of time required, according to glacial flow
modelling, for a typical LDA to form (Fastook et al., 2014). For these relatively small systems this
ACCEPTED MANUSCRIPT
31
We used Crater Tools and CraterStats extensions for ArcGIS (Michael and Neukum, 2010; Kneissl et
al., 2011) to estimate the ages of those ejecta blankets of our study craters, which did not already
have published ages. In brief: we outlined the continuous impact ejecta on CTX images, which was
then used as our crater count area. We counted all impact craters that had raised rims and were not
covered/infilled by the ejecta. We fitted the Hartmann and Neukum (2001) isochrons to the resulting
cumulative size-frequency distributions to obtain an estimated age and error (Fig. 12). These ages
are taken as maximum values for the age of the features found within the craters because the
features formed after the impact. We were conservative in determining the potential uncertainties
on the crater counting: we manually placed isochrons that bracketed our fitted ages and touched
the error bars and/or points at the oldest and youngest end of the data. In one case no identifiable
primary craters were visible on the ejecta surface at CTX resolution so we calculated a maximum age
by placing one false impact crater in the count area of 55 m diameter the smallest diameter that
ACCEPTED MANUSCRIPT
[image:34.595.77.522.63.611.2]32
Fig. 12. Crater size-frequency distribution for the eight previously undated craters in our study (Table
1). Binning is performed via the pseudo-log method of Neukum (1983) and Hartman and Neukum
(2001). (A) Kilmia Crater where CTX image G22_026861_1557 was used to count the craters. Fitting
was performed between diameters of 200 m and 1.5 km. (B) Jaisalmer Crater where CTX images
ACCEPTED MANUSCRIPT
33
count the craters. Fitting was performed between diameters of 50 m and 1 km. (C) Unnamed crater
Crater A where CTX image G19_025498_2305 was used to count the craters. For this crater no
primary craters could be found, so one crater measuring 55 m in diameter was placed in the count
area to obtain a maximum age. (D) Yelwa Crater where CTX image G06_020539_2114 was used to
count the craters. Fitting was performed between diameters of 130 m and 1 km. (E) Dechu Crater
where CTX images P12_005798_1396, P07_003675_1391, G14_023612_1375, and
D10_031102_1378 were used to count the craters. Fitting was performed between diameters of
300 m and 1.5 km. (F) Unnamed crater Crater B where CTX image G06_020703_1524 was used to
count the craters. Fitting was performed between diameters of 30 m and 1 km. (G) Nybyen Crater
where CTX image B05_011436_1427 was used to count the craters. Fitting was performed between
diameters of 150 m and 1.5 km. (H) Niquero Crater where CTX images F01_036258_1410,
P03_002383_1417, and P11_005284_1419 were used to count the craters. Fitting was performed
between diameters of 330 m and 1.5 km. (I) Unnamed crater Crater C where CTX images
B02_010559_2168 and G22_026910_2168 were used to count the craters. Fitting was performed
between diameters of 50 m and 1 km. (J) Topola crater where CTX image G14_023662_1960 was
used to count the craters. Fitting was performed between diameters of 50 m and 1 km. (K) Kenge
Crater where CTX image F23_044780_1635 was used to count the craters. Fitting was performed
between diameters of 20 m and 1 km.
3.2. Headwall retreat rate of glaciers and gullies
We used a data set comprising three gullied craters, nine craters with arcuate ridges, two craters
with pasted-on terrain yet no arcuate ridges, six fresh craters, and one degraded-looking equatorial
crater with no gullies, pasted-on terrain, or arcuate ridges (Table 1, Fig. 13). These craters have
ACCEPTED MANUSCRIPT
[image:36.595.74.522.68.309.2]34
Fig. 13. Location map of the DTMs used in this study (triangles) and locations of the additional sites
used in the figures (circles) on a MOLA elevation shaded relief base map. The numbers/letters in
brackets identify the relevant figure(s).
We found that the upper wall slopes are ~39° for the two youngest equatorial craters (< =5 Ma,
Zumba and Corinto), and in our oldest equatorial example (Kilmia, 1.1 Ga) the upper wall slope has
reduced to 27° (Table 2 and Figs. 14, 15). In the terrestrial literature we found that a peak in slope
exists at a similar value of ~39° in mountain ranges, which is thought to represent the strength of the
bedrock (e.g., Burbank et al., 1996; Katsube and Oguchi, 1999; Korup, 2008; Lin et al., 2009).
Similarly for the youngest craters in our modified sample (0.5-6.5 Ma craters A, B, C, Istok, Jaisalmer,
Galap) the slopes of the walls unmodified by either gullies or glacial processes have high slope values
with a range of 34-41° (Figs. 14, 15). The unmodified walls of older craters (1.3-1.4 Ga, Niquero,
ACCEPTED MANUSCRIPT
[image:37.595.74.512.80.588.2]35
Fig. 14. Box plots displaying results from our crater wall slope-analysis. Black boxes indicate the
interquartile range, whiskers the maximum and minimum values, horizontal black line the median
value, and black dots outliers (classed as those values farther than 1.5 interquartile-ranges from the
median). (A) Box plots of slope data gathered for the inner crater wall of our studied craters. Dotted
line is arbitrarily located at 38° for reference. (B) Box plots of slope data gathered for the exterior
crater wall of our studied craters. Dotted line is arbitrarily located at 20° for reference. Note:
ACCEPTED MANUSCRIPT
36
whereas glacial refers to areas with pasted-on terrain and textural alteration of the bedrock (Fig.
7F). in the items in the legend refer to different classes of crater: unmodified = unmodified equatorial
craters, gullied = gullied and unglaciated craters, pasted-on = craters with pasted-on terrain but no
arcuate ridges or interior ice deposit, and glaciated = glaciated craters.
The reduction in interior crater wall bedrock slope in the three gullied yet unglaciated craters is 4-5°
compared to their unmodified crater walls and 6-9° compared to slopes in fresh equatorial craters
(Figs. 14, 15; Table 2). The interior walls of craters that have evidence of glaciation are further
reduced: up to 8° (on average 4°) lower compared to conjugate unmodified walls and up to 15° (on
average 11°) compared to fresh equatorial craters. We also found that when pasted-on terrain was
present on exterior crater walls, these bedrock slopes were reduced compared to unmodified
exterior crater walls (Figs. 14, 15; Table 2), although the signal is not as strong as for the inner walls.
This is probably because of a larger initial variation in the slope of exterior crater walls, as shown by
their variability in fresh equatorial craters (a range of 8° to 21° with standard deviations of 3-10°,
Table 2). Finally, for Jaisalmer Crater and Crater B (the youngest glaciated craters) we noted that wall
sectors with pasted-on terrain and texturally altered bedrock had lower slopes than rim portions
with only pasted-on terrain and both were lower than the unmodified portions of the crater wall
(Fig. 14C).
For the gullied craters the bedrock extends on average 120-520 m down the crater wall (Table 2);
therefore, the crater wall has receded by 1-70 m at the top. For Galap this results in an estimated
headwall retreat rate of 92 m My-1 and for Istok 10 m My-1, compared to 4.5 and 75 m My-1
backweathering rates estimated by de Haas et al. (2015b) using an independent method.
The slopes within glaciated craters are partially covered by pasted-on terrain, hence as a
conservative estimate we can assume that only the bedrock that is exposed has been affected by the
slope reduction. The pasted-on terrain is found between 121 and 714 m and on average 368 m
ACCEPTED MANUSCRIPT
37
between 0.04 and 132 m My-1 for unmodified walls of glaciated and gullied craters and overlap with
the values of 0.22 to 7.6 m My-1 for completely unmodified craters. We further find that the
headwall retreat rates of glaciated walls fall between 0.08 and 181 m My-1. When these headwall
retreat rates are plotted against crater age (Fig. 15E), a decreasing trend in headwall retreat rate
against age is observed. Similarly for the glaciated crater walls, the calculated headwall retreat rate
has a similar decrease with crater age but transposed to higher headwall retreat rates than the
unmodified walls. Calculating the headwall retreat rate for the glaciated crater walls over a fixed
time interval of 0.5 Ma (as detailed in section 3.1) and using the slope reduction compared to the
unmodified wall of the same crater (rather than compared to a fresh equatorial crater wall), we find
that headwall retreat rate no longer has a substantial trend with age (Fig. 15F).
We briefly note here that our data do not show that glaciated inner crater walls have significantly
and/or systematically lower elevation than unmodified inner walls in the same crater as observed
previously by Berman et al. (2005) and Head et al. (2008). We posit that this could be because of the
fact that we find erosion on the inner and outer crater walls, hence north- and south-facing walls are
ACCEPTED MANUSCRIPT
[image:40.595.85.528.79.556.2]38
Fig. 15. Wall slopes, reduction in wall slope, and headwall retreat rate for our studied craters. (A) The
slope of exposed bedrock in the unmodified walls of craters in this study, including craters with
neither glacial nor gully features (unmodified), craters with gullies but no glacial features (gullied),
and craters with glacial features (glaciated). (B) The slope difference between glaciated walls and
unmodified walls from the same crater versus the unmodified wall slopes for outer and inner crater
walls. (C-D) The slope difference against unmodified wall slope and age respectively. The legend for
both plots is in panel (C). (E) Estimated headwall retreat rate against age for our craters separated
ACCEPTED MANUSCRIPT
39
comparison are erosion rates from modelled glacial landscapes in New Zealand (Egholm et al., 2012)
and measured glacial erosion from Iceland (Geirsdóttir et al., 2007). Trendlines are added only to
guide the eye. (F) The same plot as in panel (5E), but the headwall retreat rate is calculated over a
fixed 500 ky interval and uses the slope difference compared to the unmodified wall in the same
crater (rather than comparison to an equatorial crater wall slope). NB: The error bars for slope
represent the standard deviation of the slope measurements and age error bars the potential age
range for the host craters (Table 1). The uncertainty in slope difference is calculated by propagation
of errors and the uncertainty in retreat rate is dominated by the length of exposed bedrock, hence
uncertainties are calculated by recalculating the retreat rate using the minimum and maximum
length of the exposed bedrock for that crater.
4. Glacial erosion
4.1. Mechanisms of glacier erosion on Earth
Mechanical erosion by glaciers is dominated by abrasion, quarrying, plucking, and glaciotectonism
(see Benn and Evans, 2010, for an extensive review). Abrasion is the process by which the glacier bed
and entrained clasts are scoured either by debris entrained within basal glacier ice or, less
commonly, by the basal ice itself (e.g., Hallet, 1979). Quarrying is the process by which bed-clast
contact, or overriding of bedrock cavities, generates foci of pressure at the ice-bed interface and
liberates fragments from the bed (e.g., Iverson, 1991; Hallet, 1996; Cohen et al., 2006). Plucking
involves freezing of meltwater within, or deformation of basal ice into, bedrock fractures and
prizing-off of fragments under subsequent glacier motion B ‘
Iken, 1981). Finally, glaciotectonism is the process by which subglacial, submarginal, and/or
proglacial materials deform under stresses induced by glacial ice (e.g., Hart and Boulton, 1991).
Glacier thermal regime exerts a fundamental control upon the efficacy of glacial erosion on Earth.
This arises from its influence on the generation of meltwater, entrainment of erosional tools (i.e.
ACCEPTED MANUSCRIPT
40
The thermal regimes of glaciers are categorised according to their temperature relative to the
pressure melting point of ice and are controlled by complex interactions between climatic,
environmental, and glaciological parameters (Benn and Evans, 2010). Temperate (warm-based)
glaciers H G A “ A G are at the pressure melting point of ice throughout, whereas cold-based glaciers (e.g., Meserve Glacier, Antarctic Dry Valleys;
Holdsworth and Bull, 1970) are entirely below the pressure melting point. Polythermal glaciers (e.g.,
Midre Lovénbreen, Svalbard; Björnsson et al., 1996), where warm ice at the pressure melting point
coexists with cold ice below the pressure melting point, represent an intermediate condition
between temperate and cold-based glaciers.
The efficiency of mechanical erosion by glaciers is greatly enhanced in the presence of meltwater.
Under a wet-based thermal regime, significant basal sliding can occur at an unfrozen ice-bed
interface, promoting efficient abrasion of the bed (e.g., Hallet, 1979) and liberation of rock
fragments via plucking. Sliding over obstacles at the bed also opens lee-side cavities, promoting
quarrying (e.g., Iverson, 1991; Hallet, 1996). Quarrying is particularly effective under wet-based
regimes because meltwater, which is dynamic on shorter timescales than glacial ice, can greatly
enhance pressure fluctuations at the bed (Iverson, 1991; Cohen et al., 2006). Liquid water is thought
to play an important, possibly essential, role in promoting glaciotectonic deformation. Pore water
reduces the yield stress of glacial sediments, making them more susceptible to deformation under
stresses induced by glacial ice (e.g., Bennett, 2001). Despite generally lower meltwater volumes
associated with glaciers in cold-climate or permafrost regions, ground ice and/or frozen glacier
margins may encourage glaciotectonic processes by preventing efficient drainage of meltwater from
aquifers that they confine (e.g., Moran et al., 1979; Fitzsimons, 1996; Boulton et al., 1999; Benn and
Evans, 2010).
The frozen ice-bed interface and absence of meltwater in cold-based glacial systems, it is leads to
ACCEPTED MANUSCRIPT
41
beds, and exert little or no detectable geomorphic influence upon the underlying landscape. Indeed,
coverage by cold-based ice is frequently invoked as a protective mechanism to explain the
preservation of features generated by previous wet-based glaciations (e.g., Dyke, 1993; Smith et al.,
2009). However, theoretical (Shreve, 1984) and field-based (Echelmeyer and Wang, 1987) studies
have noted that sliding rates of cold-based glaciers are, in fact, non-zero when integrated over long
timescales (Cuffey et al., 2000; Waller, 2001). Field observations have also identified evidence for
reworking of cold glacier beds (Cuffey et al., 2000; Atkins et al., 2002; Lloyd Davies et al., 2009), such
that it is becoming increasingly evident that cold-based glaciers can exert significant geomorphic
influence over timescales of glacial advance, although still substantially less than warm-based
glaciers.
In examining isotopic composition of dirty basal ice layers derived from marginal apron overriding at
Meserve glacier in the Antarctic Dry Valleys, Cuffey et al. (2000) suggested that interstitial water
films between ice and immersed solids within dirty basal ice layers of cold-based glaciers may permit
sliding and abrasion down to temperatures of -30°C, an effect that could be particularly important in
the presence of a highly saline substrate. Additionally, Lloyd Davies et al. (2009) proposed a
mechanical model by which abrasion and quarrying can operate beneath cold-based glaciers in the
absence of liquid water, based on field observations in the Allan Hills region of Antarctica.
Ice-marginal aprons comprising collapsed ice blocks commonly accumulate at the foot of steep terminal
ice cliffs of cold-based glaciers. These aprons can be incorporated into basal ice as they are
overridden during glacier advance (Cuffey et al., 2000; Atkins et al., 2002; Lloyd Davies et al., 2009).
Lloyd Davies et al. (2009) suggested that this incorporates a weak, low-density layer into the
submarginal basal ice that focusses stress onto up-glacier bedrock contacts and promotes fracturing
and quarrying of bedrock protuberances. Entrained rocks are then available as tools for abrasion