i
SERUM FERRITIN LEVELS IN GESTATIONAL
DIABETES MELLITUS
DISSERTATION
Submitted to
THE TAMILNADU DR MGR MEDICAL UNIVERSITY
In partial fulfillment for the degree
DOCTOR OF MEDICINE
IN
BIOCHEMISTRY- BRANCH XIII
MAY 2019
DEPARTMENT OF BIOCHEMISTRY
CHRISTIAN MEDICAL COLLEGE
ii
CERTIFICATE
This is to certify that the study entitled ―SERUM FERRITIN LEVELS IN
GESTATIONAL DIABETES MELLITUS‖ is the bona fide work of Dr. Gopinath
M, who conducted it under the guidance and supervision of Dr. Molly Jacob, MD, PhD. The work in this dissertation has not been submitted to any other university for the award of a degree.
Dr. Molly Jacob, MD, PhD
Professor and Head
Department of Biochemistry
Christian Medical College, Vellore
Dr. Anna B. Pulimood, MD
Principal
iii
DECLARATION
I hereby declare that the investigations which form the subject matter of this study were conducted by me under the supervision of Dr. Molly Jacob, Professor of Biochemistry, Christian Medical College, Vellore.
Dr. Gopinath M,
iv
v
ACKNOWLEDGEMENTS
I take this opportunity to express my special thanks and profound gratitude to the following people for their support and encouragement which made this work possible.
Dr. Molly Jacob, my guide and mentor. I am grateful for her patience, valuable time, guidance, encouragement, care and support. I am indebted to her for what she has been to me.
Dr. Jasmine Prasad, Professor, Department of Community Health And Development (CHAD), CMC, Vellore, for guidance, support and help in recruitment of patients.
Dr. Joe Varghese, my co-guide, for his help, guidance, encouragement and valuable opinions
vi Dr. Victoria Job, Dr. Geethanjali F S and Mr. Joseph Dian Bondu, Department of Clinical Biochemistry for their help and support
Dr. Premila Abraham for her constant encouragement and support
Dr. Muthuraman N, Dr. Jagadish R, Dr. Padmanaban V, Dr. Arthi T S, Dr. Anand R., Dr. Prakash S.S, Dr. Monica Peter, Mr. Jithu V James for their assistance, encouragement and cheerful support
Dr. Mathuravalli, Dr. Rosa Mariam, Dr. Logapriya and Dr. Louis Sara James for their cheerfulness and support
Mr. Sridhar, Mr. Issac Newton, Mr. Lalu, Mr Kumerasan for their assistance in laboratory work and cheerful support
Mrs. Punitha M for secretarial help
I thank my parents, teachers and almighty God for being there for me always
vii
TABLE OF CONTENTS
Chapter
Title
Page no.
1
Abstract
1
2
Review of literature
3
3
The study
26
4
Materials
27
5
Methods
28
6
Results
43
7
Discussion
67
8
Conclusion
76
9
Limitations of the study
77
10
Bibliography
78
11
Appendix 1
(IRB approval)
96
12
Appendix 2
(Consent form and information sheet)
99
13
Appendix 3
(Participant’s proforma)
103
14
Appendix 4
(Master data sheet)
1
ABSTRACT
SERUM FERRITIN LEVELS IN GESTATIONAL DIABETES MELLITUS
BACKGROUND:
The precise mechanisms involved in etio-pathogenesis of gestational diabetes mellitus (GDM) are not well understood. Epidemiological data suggest that GDM is associated with increased iron stores in the body. Serum ferritin, often used as an indicator of body iron stores, has been shown to be increased in those with diabetes mellitus. The aim of this study was to determine whether this is so in women with GDM.
MATERIAL AND METHODS:
A case control study was carried out between January 2017 and July 2018 to recruit primigravidae, with and without GDM. Anthropometric data and a fasting blood sample were collected from each subject. The blood sample was used to estimate serum levels of ferritin, hepcidin, iron, total iron binding capacity (TIBC), percentage of transferrin saturation and C–reactive protein (CRP). Clinical data was collected from hospital records.
RESULTS:
2 serum transferrin saturation, and a significant negative correlation with TIBC values. Serum hepcidin level bore significant positive correlation with serum iron, ferritin and transferrin saturation and a significant negative correlation with TIBC values. The gestational ages at delivery, birth weight of the baby, the APGAR score, and length of the babies were similar in both groups.
CONCLUSION:
There were no significant differences in levels of serum ferritin and other iron-related parameters in women with and without GDM. Hence, based on the data in this study, it does not appear that increased serum ferritin levels may be useful as a marker for development of GDM.
3
REVIEW OF LITERATURE
INTRODUCTION
Iron is essential for basic metabolic processes in organisms. It plays a vital role in oxygen transport, mitochondrial respiration, nucleotide synthesis and host defence(Gulec et al., 2014). Iron exists either in ferrous or ferric form. This feature enables it to take part in electron transfer reactions. Hemoglobin, a heme protein which helps in oxygen transport, has iron as its prosthetic group. Heme is found in other proteins as well, which are collectively referred to as heme proteins. However, despite it being essential for life, excessive iron can be harmful. Free iron leads to oxidative damage, via the Haber-Weiss and Fenton reactions that generate free radicals. Hence, levels of iron must be maintained within physiological limits (Gulec et al., 2014).
Iron in the body is obtained either from absorption from the gut or from recycling of iron (from senescent red blood cells) in the reticuloendothelial system. The recycled iron contributes the major proportion of iron for the body’s requirements. Dietary iron,
4
IRON METABOLISM
Absorption of iron from the diet
Iron absorption occurs in the proximal small intestine, mostly in the duodenum (Hentze et al., 2010). The amount absorbed is in the range of 1-2 mg/day, and contributes less than 10% of the body’s requirement for iron. Dietary iron is found in the form of either heme or heme iron. The major proportion of dietary iron is non-heme iron.
A. Absorption of non-heme iron (Figure 1)
Non-heme iron in the diet is usually present in its ferric form. In the alkaline environment of the duodenum, ferric iron forms insoluble complexes (Przybyszewska and Żekanowska, 2014). Duodenal enterocytes cannot take up the ferric form of iron
(Wollenberg and Rummel, 1987). In order to facilitate iron absorption, the ferric form must be converted to its ferrous form. This is accomplished by a brush border ferri-reductase, duodenal cytochrome b (McKie et al., 2000). This is a transmembrane protein that is located on the apical surface of duodenal enterocytes (McKie et al., 2001). It is a member of the cytochrome b561 family of proteins, the expression of which is regulated by iron. Its mRNA and protein levels have been shown to increase in iron-deficiency states and in presence of hypoxia (McKie et al., 2001).
5 (Gunshin et al., 1997). DMT1 belongs to a family of proteins known as natural resistance-associated macrophage proteins (NRAMP). DMT1 is also known as NRAMP2 or DCT1 (divalent cation transporter 1). It is a non-specific transporter that transports other divalent cations such as Zn2+, Cu2+, Mn2+, Co2+, Cd2+ and Ni2+, besides iron (Gunshin et al., 1997). DMT1 is also present in erythrocytes, where it plays a role in pumping iron out of the endosome during the transferrin cycle, explained below (Andrews et al., 1999).
Iron that enters the enterocyte undergoes one of two fates, depending on the body’s
requirements for iron. It is either stored in the cell (as ferritin, which is a storage protein for iron)(Arosio and Levi, 2010)or released into the circulation. Iron inside enterocytes is exported into the circulation, by ferroportin, which is present on the basolateral surface of enterocytes (McKie et al., 2000). It is encoded by the SLC40A1 gene and belongs to the family of metal transport 1 proteins (Abboud and Haile, 2000; McKie et al., 2001). It is also referred to as IREG1 (iron-regulated transporter 1) or MTP1 (metal transport protein 1)(Abboud and Haile, 2000).It is the only known iron exporter identified in mammals (Abboud and Haile, 2000). It is highly expressed in macrophages, duodenal mucosal cells, hepatocytes, Kupffer cells and placental syncytiotrophoblast cells (Abboud and Haile, 2000). Ferroportin knockout mice have been shown to have iron-deficiency anemia, highlighting the importance of ferroportin in iron absorption (Donovan et al., 2005).
6 2007; Vulpe et al., 1999).It is this form that can bind transferrin, which is the protein that transports iron in blood (Schade and Caroline, 1946).
B. Absorption of heme iron
[image:13.595.78.403.410.676.2]Digestive enzymes secreted in the intestine cause proteolytic degradation of heme proteins. This results in separation of heme from the protein. The heme is taken up into enterocytes by a heme transporter, present on the apical surface of the membrane of these cells (Shayeghi et al., 2005). Inside the enterocytes, hemeoxygenase (HO-1) releases ferrous iron from heme(Raffin et al., 1974). The released iron follows the same fate as that of non-heme iron.
7 Source: Rodwell, V., Bender, D., Botham, K.M., Kennelly, P.J., and Weil, P.A. (2015). Harpers Illustrated
Biochemistry 30thEdition (McGraw Hill Professional).
Recycling of iron by macrophages
A major part of iron in the body is present in the form of hemoglobin in red blood cells (RBCs). Senescent RBCs are phagocytosed by macrophages of the reticuloendothelial system, leading to the formation of phagolysosomes. Cytosolic heme oxygenase-1 (HO-1) in the macrophages degrades the heme, releasing ferrous iron in the phagolysosome(Poss and Tonegawa, 1997). This is transported out of the endosome into the cytoplasm by DMT1 (Tabuchi et al., 2000). The ferrous iron then either enters the labile iron pool, from where it is transported out of macrophage by ferroportin(Donovan et al., 2005),or it is stored in the cell as ferritin. Ceruloplasmin, a copper-containing plasma protein in circulation, converts the released ferrous iron to its ferric form, which then binds to transferrin in circulation (Harris et al., 1999).Iron released by macrophages is the major source of iron for the requirements of the body (Zhang and Enns, 2009).
Iron in circulation
8 transferrin are occupied by iron. This represents transferrin saturation, which is a reflection of the iron status of the body, and hence a clinically useful marker(Luck and Mason, 2012). Under physiological conditions, all the iron in circulation is transferrin-bound. When there is an iron overload, the excess amount of circulating iron exceeds the binding capacity of transferrin (Barisani et al., 1995). This results in iron in circulation that is not bound to transferrin. This unbound iron complexes with citrate and albumin in circulation, and is referred to as non-transferrin bound iron (NTBI) (Arezes et al., 2013).
Uptake of iron by tissue
9 the endosome into the cytosol by DMT1(Fleming et al., 1999). Thus, DMT 1 is not only involved in the absorption of ferrous iron from the intestinal lumen, but it is also essential for the transport of ferrous iron from the endosome into the cytosol after erythrophagocytosis(Hentze et al., 2010). The iron is then either utilised by the cell or stored in ferritin. The apo-transferrin and the transferrin receptor are recycled back to the cell surface, where the apo-transferrin dissociates from its receptor and re-enters the circulation (Dautry-Varsat et al., 1983). In physiological states, the uptake of transferrin-bound iron by TfR1-mediated endocytosis is the major route of iron uptake in cells (Hentze et al., 2010). The cytoplasmic labile iron pool (LIP) is used by erythroid cells for synthesis of heme or iron-sulphur clusters, or stored as ferritin in the case of other cells.
In iron-overloaded states, there is an increase in circulating levels of non- transferrin bound iron (NTBI). The exact mechanism by which NTBI is formed is not clearly understood. It has been proposed that it may involve one or more ferri-reductases on the surface of cells (Ji and Kosman, 2015). NTBI is taken up into cells by ZRT/ IRT-like proteins (ZIPs), namely ZIP14 andZIP18 (Jenkitkasemwong et al., 2012; Liuzzi et al., 2006). After uptake, the iron enters the labile iron pool and follows the same fate as iron from the transferrin cycle.
Ferritin
10 hollow space in the centre. The subunits are composed of heavy (H) and light (L) chains. The ferrioxidase activity of H-ferritin enables it to take up ferrous form and store it in its ferric form, which is then attached to the glutamyl group of L-ferritin (Arosio and Levi, 2010). Each ferritin molecule can store up to ~ 4500 iron atoms in the form of non-mineralized ferric hydrate iron (Arosio and Levi, 2010). The transport of iron into ferritin is carried out by ribonucleoproteins known as poly(rC)-binding proteins 1-4 (PCBP 1-4), which act as chaperones (Lane et al., 2015). The iron in ferritin can be mobilized in times of cellular need (Saito, 2014).
Ferritin is found in circulation in small quantities. The source of this is not clear. Ferritin in blood is chiefly made up of L-chains, which are glycated and poor in iron content(Santambrogio et al., 1996). Serum ferritin levels reflect the body’s iron stores (Lipschitz et al., 1974); levels increase in iron-overloaded states. However, serum ferritin is also an acute phase reactant. Its levels are raised in response to inflammation. Hence, serum ferritin is not a reliable marker of iron overload in the presence of inflammation (Lipschitz et al., 1974).
Regulation of intracellular iron homeostasis: IRE/IRP system (Figure 2)
Intracellular iron homeostasis is regulated by processes that involve post-transcriptional changes and by alterations in the stability of mRNA (Hentze et al., 2010). The mRNA for iron-related proteins contains hairpin loop-like domains in the 5’ or 3’untranslated region (UTR). These are known as iron-responsive elements
11 (IRP). There are two types of IRPs- IRP1 and IRP2. They are orthologs, which have the same function but are regulated in different ways. IRPs are RNA-binding proteins. They interact with iron-responsive elements (IREs) in the 5’ or 3’ UTR regions of the target mRNA. On binding, they either stabilize or destabilize the mRNA. This outcome is dependent on the location of IRE on the mRNA (Hentze et al., 2010). If the IRE is on the 5’ end, then the binding of IRP will lead to inhibition of translation.
Studies have shown that ferritin (H and L chain), ferroportin, erythroid ALA synthase
(ALAS2), mitochondrial aconitase and hypoxia-inducible factor-2α (HIF-2α) have IREs in the 5’ end (Anderson et al., 2009; Leibold and Munro, 1988; Rouault, 2005;
Zheng et al., 1994; Pantopoulos, 2004).
If the IRE is on the 3’ end, binding of IRP will result in stabilization of mRNA,
thereby promoting translation. IREs on the mRNA for transferrin receptor1 (TfR1) and DMT1are at its 3’ end (Mackenzie et al., 2008). Binding of IRP to the 3’ end of
mRNA results in increased translation of transferrin TfR1and DMT1.
12
Figure 2: Regulation of intracellular iron levels
Source: Hentze, M.W., Muckenthaler, M.U., Galy, B., and Camaschella, C. (2010). Two to Tango: Regulation
of Mammalian Iron Metabolism. Cell 142, 24–38.
Systemic iron homeostasis
13 α2-macroglobulin(Peslova et al., 2009). It either undergoes excretion via the kidneys
or degradation, along with ferroportin (as described below) (Hentze et al., 2010).
The link between hepcidin and iron metabolism was initially unknown. Many studies have provided much evidence of links between the two. Hepcidin expression was found to be increased in iron-loaded mice (Pigeon et al., 2001). A complete defect in expression of hepcidin and associated tissue iron overload were observed in mice in which upstream regulatory factor (USF) had been knocked out. Severe iron-deficiency anemia was observed in transgenic mice with hepcidin over-expression (Nicolas et al., 2002).
Hepcidin has been shown to bind to ferroportin, present in enterocytes, macrophages and syncytiotrophoblastsin the placenta (Abboud and Haile, 2000; Donovan et al., 2005; McKie et al., 2000). This causes its internalization and subsequent degradation (Nemeth et al., 2004b). Low hepcidin levels have been shown to be associated with increased expression of ferroportin(Viatte et al., 2005).
Regulation of hepcidin synthesis
14 2003). Inflammation causes upregulation of the transcription of hepcidin, via cytokines such as IL-6. This results in decreased iron absorption and promotes sequestration of iron in macrophages (Nemeth et al., 2004).
A. Regulation by iron levels
Two main signalling pathways are involved in regulation of hepcidin synthesis by circulating iron levels.
a. Hfe-TfR2 (HFE-transferrin receptor 2) pathway
b. HJV-BMP (hemojuvelin–bone morphogenic protein) pathway
a.
Hfe-TfR2 signalling15 Hfe is a transmembrane protein expressed in hepatocytes (Zhang et al., 2004). Structurally, it resembles the class I major histocompatibility complex (MHC), with α1, α2 and α3 chains, associated with β2-microglobulin(Li et al., 2016). Transferrin
receptor-1(TfR-1) is present in most cells and enables iron uptake, via holo-transferrin. TfR-1 has binding sites for both Hfe and holo-transferrin; these sites overlap each other. It can only bind either Hfe or holo-transferrin at a time (Feder et al., 1998), with a greater affinity for transferrin. Hence, binding of holo-transferrin to TfR1 results in dissociation of Hfe from TfR-1. In keeping with this, increased concentration of holo-transferrin was found to displace Hfe from TfR1(Gao et al., 2010).TfR-2 is also a transmembrane protein; it is involved in sensing iron levels (Kawabata et al., 1999). Unlike TfR-1, TfR-2 can simultaneously bind Hfe and holo-transferrin (Chen et al., 2007).
In order to study the binding affinity of TfR1 for Hfe, Schmidtt et al., (2008) engineered mouse models with TfR1 mutations. Mutations in TfR1, which produced an increased affinity for Hfe, resulted in decreased hepcidin levels and subsequent iron overload, as seen in hemochromatosis. On the other hand, mutations of TfR1 that produced decreased binding affinity for Hfe resulted in increased hepcidin levels and iron deficiency (Schmidt et al., 2008).
b.
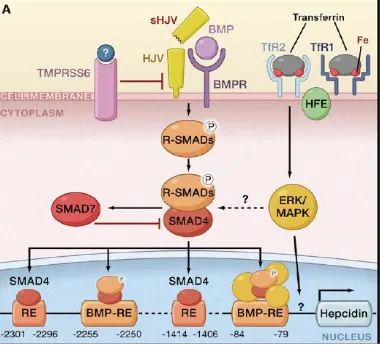
HJV-BMP (hemojuvelin–bone morphogenic protein) pathwayBone morphogenic proteins (BMP) belong to the transforming growth factor β(TGF-β) family. They are involved in cell proliferation, differentiation and cell signalling.
co-16 receptor hemojevulin(HJV). The binding causes dimerization of type I and II BMP receptors (serine/threonine kinase), (Xia et al., 2008). This induces phosphorylation of receptor-regulated R-SMAD. This, in turn, results in R-SMAD forming a complex with SMAD4, which induces the transcription of hepcidin by binding to its promoter (Shi and Massagué, 2003). Many types of BMP proteins have been identified. Of these, BMP-6 is the main ligand for the HJV-BMP pathway in the liver (Enns et al., 2013). Matripase-2,which is a transmembrane serine protease encoded by the TMPRSS6gene, is expressed in the cell membrane of hepatocytes (Velasco et al.,
17
Figure 4: Regulation of hepcidin by systemic iron availability
Source: Adapted from Hentze, M.W., Muckenthaler, M.U., Galy, B., and Camaschella, C. (2010). Two to
18
Figure 5: Regulation of hepcidin by erythroid signalling
Source: Adapted from Hentze, M.W., Muckenthaler, M.U., Galy, B., and Camaschella, C. (2010). Two to
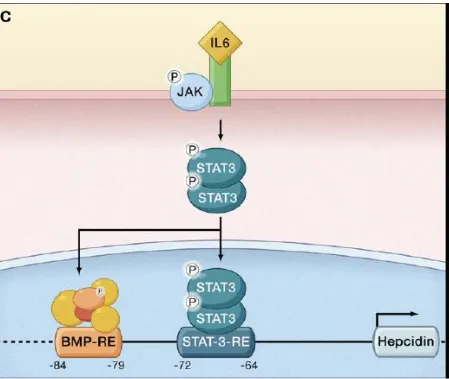
19
Figure 6: Regulation of hepcidin by inflammation
Source: Adapted from Hentze, M.W., Muckenthaler, M.U., Galy, B., andCamaschella, C. (2010). Two to
20
B. Regulation by erythroid signals
Erythropoiesis requires iron. Erythropoietin, produced in the liver and kidneys, is the major hormone involved in the process. Increased erythropoietin levels are seen in anemic and hypoxic states. Studies in healthy volunteers have shown that administration of erythropoietin resulted in decreased hepcidin levels (Robach et al., 2009). Hepcidin expression was found to be suppressed in participants who underwent phlebotomy(which increased erythropoiesis)(Ashby et al., 2010). During erythropoiesis, various erythroid factors are released from the bone marrow. These include growth differentiation factor 15(GDF15), twisted gastrulation factor (TWSG1) and erythroferrone (ERFE). Increased levels of GDF15 have been reported in thalassemic patients (Tanno et al, 2007). In thalassemic mice models, TWSG1 and ERFE were found to be increased (Mirciov et al., 2017).These observations were associated with low hepcidin levels. It has been postulated that these erythroid factors act to downregulatehepcidin synthesis, by inhibiting the HJV/BMP pathway (Tanno and Miller, 2010; Kautz and Nemeth, 2014).
C. Regulation by inflammation
21 been shown to occur between interleukin-mediated upregulation of hepcidin(via theJAK/STAT pathway)and the BMP/HJV/SMAD pathway via SMAD4 (Wang et al., 2005).
PREGNANCY
Pregnancy, a normal physiological process, extends over a period of 280 days or 40 weeks, counting from a woman’s last menstrual period to child birth. The 40-week
period is divided into first, second and third trimesters, with each trimester comprising a period of 13 weeks (Hill and Pickinpaugh, 2008).
Pregnancy and iron metabolism
The body undergoes several physiological changes during pregnancy, in order to meet the needs of the growing fetus(Hill and Pickinpaugh, 2008).The body’s requirement for iron is increased in pregnancy, as it is essential for development of the placenta, the growing fetus, to maintain RBC mass and to compensate for blood loss during delivery (Koenig et al., 2014).
22 to poor immune response, which results in, increased susceptibility to infection causing spontaneous preterm birth (Bhaskaram, 2001).
Placental transfer of iron
In maternal circulation, iron bound to transferrin (Tf) is taken up by the fetusvia TfR1, found in the syncytiotrophoblasts lining the placenta on the maternal side (Kawabata et al., 1999). On binding to its receptor in the placenta, the Tf-TfR1 complex is taken up by endocytosis and a vesicle is formed in the cytosol. Acidification of the vesicle follows. The low pH produced causes dissociation of iron from transferrin (Harris et al., 1999). The iron from the vesicle leaves via DMT1on the endosomal membrane and is used for cellular needs. If in excess of cellular requirements, iron taken up is stored as ferritin or released into the fetal circulation via ferroportin on the basolateral side of the placental syncytiotrophoblast(Abboud and Haile, 2000; Harris, 1992). Ferrous iron thus released is converted to its ferric form by a ferroxidase(Chen et al., 2010).
Hepcidin in pregnancy
23 A meta-analysis on hepcidin and its role in pregnancy included 10 human and 6 animal studies (Koenig et al., 2014). The human studies comprised both cross-sectional and longitudinal studies, mostly involving healthy pregnancies with few complications. Hepcidin levels have been shown to be lower in pregnant women compared to non-pregnant healthywomen(Rehu et al., 2010b). Lowest levels of hepcidin have been reported during the third trimester. This correlates with the high uptake of iron from the maternal to the fetal side (Gyarmati et al., 2011b; Finkenstedt et al., 2012; van Santen et al., 2013b; Dao et al., 2013). Maternal hepcidin levels have been shown to correlate with markers of iron status (Schulze et al., 2008; Rehu et al., 2010c; van Santen et al., 2013b).In uncomplicated pregnancies, it was shown that maternal hepcidin levels during gestation did not correlate with inflammatory markers (Schulze et al., 2008; van Santen et al., 2013b). However, in the setting of obesity(Dao et al., 2013) or preeclampsia (Toldi et al., 2010), serum hepcidin levels were found to correlate with levels of C-reactive protein (CRP), an inflammatory marker.
Gestational diabetes mellitus (GDM)
Defects in insulin production or insulin action or both lead to diabetes mellitus (Alberti and Zimmet, 1998). Globally, about 422 million people are estimated to have diabetes mellitus, with the number predicted to increase to 592 million people by 2030. India has the world’s second largest diabetic population with about 62 million
24 Gestational diabetes mellitus (GDM) is defined as diabetes diagnosed in the second or third trimester of pregnancy that is not clearly either type 1 or type 2 diabetes (ADA, 2016). The prevalence of GDM in India has been estimated to be between 3%-21% (Kaveeshwar and Cornwall, 2014; Zhu and Zhang, 2016). The large variation in these prevalence figures has been suggested to be due to the use of different diagnostic criteria, differences in lifestyles and food habits of the subjects, etc(Rajput et al., 2013). In Tamil Nadu, the prevalence has been estimated to about 13.8% [urban-17.8%; semiurban-13.8%; rural-9.9%] (Anjana et al., 2011).
The screening of GDM is usually done between 24 to 28 weeks of gestation (Sacks et al., 2012). One of the most commonly used criteria to diagnose GDM is InternationalAssociation of the Diabetes and Pregnancy Study Groups (IADPSG)criteria (ADA, 2016); these comprise a fasting plasma glucose levels equal to or greater than 92 mg/dL or a 1-hour (post oral glucose load of 75 g) plasma glucose value equal to or greater than 180 mg/dL or a 2-hour (post oral glucose load) plasma glucose value equal or greater than 153 mg/dL(ADA, 2016).
25 Gestational diabetes mellitus is the most common metabolic disorder during pregnancy (Buchanan et al., 2012). It is associated with maternal and fetal complications. Though the exact mechanism is not known, iron overload has been reported to induce β-cell toxicity and to impair glucose metabolism (Lao et
al.,2001;Ferrannini, 2000). High iron and low insulin levels have been reported in patients with GDM (Kaygusuz et al., 2013). Iron has been reported to be a strong pro-oxidant that can affect insulin synthesis in the pancreas (Rajpathak et al., 2009).
The link between iron homeostasis and diabetes mellitus was first noted in patients with hemochromatosis, who were found to have a high incidence of diabetes mellitus (Fernández-Real et al., 2005; Jiang et al., 2004). Frequent blood donations have been shown to decreased risk of developing diabetes mellitus (Fernández-Real et al., 2005; Jiang et al., 2004; Swaminathan et al., 2007). Treatment of patients with thalassemia, who have iron overload, with iron chelators has decreased the incidence of diabetes mellitus in this group (Gamberini et al., 2008) and also decreased diabetes-related vascular complications (Nitenberg et al., 2004).
26
THE STUDY
HYPOTHESIS
Serum ferritin levels may be increased in Indian women with gestational diabetes mellitus (GDM).
OBJECTIVES OF THE STUDY
a. To estimate serum ferritin in subjects with and without GDM
b. To estimate various iron-related parameters in subjects with and without GDM c. To compare the above parameters in those with and without GDM
27
MATERIALS
EQUIPMENT USED
1. Elix and Milli-Q ultrapure water system (Millipore, USA) 2. -70OC freezer (Thermo Scientific, Massachusetts, USA) 3. Table-top refrigerated centrifuge (MPW R 350, MPW Poland) 4. Micro-plate reader (Model 680, Bio-Rad laboratories, Inc., UK)
CHEMICALS AND REAGENTS USED FOR HEPCIDIN ESTIMATION
These were obtained from Peninsula Laboratories (San Carlos, USA) and consisted of the following:
1. Lyophilized standard, anti-serum against hepcidin, biotinylated peptide
2. Enzyme immune-assay buffer, streptavidin-horseradish peroxidase (HRP), substrate solution (TMB – 3, 3’, 5, 5’–tetramethylbenzidine solution) and stop solution (2N HCl)
OTHER MATERIALS USED
1. Plain red vacutainer tubes for blood collection (BD Biosciences, Plymouth, UK)
28
METHODS
The Institutional Review Board (IRB) at Christian Medical College (CMC), Vellore, India, approved this study (IRB Min No 10423 dated 05.12.2016) (included as Appendix 1).
SUBJECTS
Primigravidae, who attended the antenatal clinic of the Community Health and Development (CHAD) Hospital in CMC, Vellore, and who were referred for an oral glucose tolerance test (OGTT) (75 gm glucose) as part of their routine antenatal check-ups, were recruited for this study. The period of recruitment was from January 2017 to July 2018.The inclusion criteria were as follows:
Inclusion criteria
Primigravidae
a. who gave consent to participate in the study
b. who had a packed cell volume (PCV) equal to or greater than 33.0% or haemoglobin levels equal to or more than 11 g/dL in the first trimester
c. with serum C-reactive protein (CRP) level less than or equal to 12 mg/L (Abbassi-Ghanavati et al., 2009; Nakishbandy and Barawi, 2014)
Exclusion criteria
Primigravidae who
29 b. had PCV less than 33.0% or haemoglobin levels less than 11 g/dL in the first
trimester
c. had serum CRP levels greater than or equal to 12 mg/L d. were known to have diabetes mellitus or hypertension
e. had any pregnancy-related complication, such as chronic infective or inflammatory states or pregnancy-induced hypertension or preeclampsia or multiple gestation
f.
INFORMED CONSENT
When potential participants were identified, based on the inclusion and exclusion criteria listed above, the study was explained to them. They were also provided with an information sheet printed in English or Tamil, depending on their preference. Written informed consent was obtained from each participant. The format for the informed consent form and the information sheet used is included as Appendix 2.
CLINICAL AND DEMOGRAPHIC DATA
Relevant clinical and demographic data were collected, using a proforma (included as Appendix 3). Each participant’s date of last menstrual period was used to calculate gestational age. The haematocrit (Hct) values were obtained from their hospital records.
non-30 stretchable measuring tape, at a point midway between the acromion process of the left scapula and the olecranon process of the ulna on the same side.
All the primigravidae had been prescribed ferrous sulphate (150 mg per day) and folic acid tablets (2.5 mg per day) from the time of their first antenatal visit, as per National Nutritional Anemia Control Programme (NNACP) guidelines (Kumar, 1999). The date when iron and folic acid supplements were prescribed was noted from hospital records. At the time of recruitment into the present study, they were asked whether they had been taking the tablets regularly. Information on outcomes of pregnancy was obtained from hospital records and by contacting the subjects by phone.
CALCULATION OF SAMPLE SIZE
Information from a study by Derbent et al, (2013) was used to calculate sample size. To show a difference of 11.45 units of serum ferritin between women with and without GDM, with 90% power and 5% level of significance, 22 samples were required in each group (standard deviation of 13.37 in women with GDM and 9.66 in women without GDM). The details of this calculation are shown below.
Derbent et al 2013
Standard deviation in women with GDM
13.37
Standard deviation in women without GDM
9.66
31
Effect size 0.9943
Alpha error (%) 5
Power (1- beta) % 90
1 or 2 sided 2
Required sample size per group 22
Formula:
Where,
Zα/2 is 5% level of significance
Z1-β is the 80% power
sd = standard deviation
d = 21.7 (mean change)
SAMPLE COLLECTION
32
PROCESSING AND STORAGE OF SAMPLES
The blood samples obtained were subjected to centrifugation at 2500g for 10 minutes, within 2 hours of sample collection. The serum obtained was divided into multiple aliquots and stored at -70OC till used for analyses. They were thawed on ice, when required for estimations of serum ferritin, iron, CRP and hepcidin.
ESTIMATION OF SERUM FERRITIN
Serum ferritin was measured in Department of Clinical Biochemistry, CMC, Vellore. This is a routine test offered by this laboratory.
Analyzer used
Siemens, ADVIA, Centaur System, XPi, UK
Principle of the method (two-site sandwich immunoassay using direct
chemiluminescence technology)
33
ESTIMATION OF SERUM IRON
Estimation of serum iron was done in the Department of Clinical Biochemistry, CMC, Vellore. This is a routine test offered by this laboratory.
Analyzer used
Roche Cobas C720 modular analyzer from Roche Diagnostics, Gmbh, Mannheim
Principle (colorimetric method)
In the acidic medium provided, ferric iron was released from transferrin. Ascorbate was added to reduce ferric iron into ferrous form. Ferrous iron bound with a dye, ferrozine, to form a purple coloured complex, which was measured at 560 nm. The intensity of the purple colour that developed was directly proportional to the amount of iron in the sample.
ESTIMATION OF TOTAL IRON-BINDING CAPACITY (TIBC)
Estimation of TIBC was done in the Department of Clinical Biochemistry, CMC, Vellore. This is a routine test offered by this laboratory.
Analyzer used
Roche Cobas C720 modular analyser from Roche Diagnostics, Gmbh, Mannheim
Principle (colorimetric method)
34 colour that developed was directly proportional to the amount of unbound iron. The difference between the amount of iron added and the unbound iron was taken to be the unbound iron binding capacity (UIBC). The sum of serum iron and UIBC represented total iron binding capacity (TIBC).
CALCULATION OF TRANSFERRIN SATURATION
Transferrin saturation was calculated as the percentage of the ratio of serum iron to TIBC, as shown in the formula below:
Transferrin saturation (%) = (Serum iron/TIBC) x 100
ESTIMATION OF SERUM C-REACTIVE PROTEIN
Estimations of CRP were done in the Department of Clinical Microbiology, CMC, Vellore. This is a routine test offered by this laboratory.
Analyzer used
BN Prospec, Siemens, Gmbh, Mannheim, Germany
Principle (nephelometry)
35
ESTIMATION OF SERUM HEPCIDIN
ELISA kit and reagents for hepcidin estimation were purchased from Peninsula Laboratories, (San Carlos, USA).
Principle of the method
The estimation of hepcidin was based on a competitive immunoassay. Hepcidin in the sample competed with a biotinylated tracer to bind to the antibody against hepcidin. The amount of biotinylated tracer that bound to the antibody was inversely proportional to the amount of hepcidin in the sample.
Source: Product information sheet of the hepcidin kit (Hepcidin-25 [for serum and plasma samples]) Peninsula
Laboratories (Cat No S-1337)
Components of the kit
1. 96-well plate
36 4. Rabbit antiserum against hepcidin 25(lyophilised powder)
5. Enzyme immunoassay buffer (50mL)
6. Standard diluents (peptide-free human serum) (8mL) 7. Streptavidin horseradish peroxidase (100μL)
8. Substrate solution (TMB 3,3’,5,5’-tetramethyl benzidine)(11mL of TMB and hydrogen peroxide)
9. 2N HCl (hydrochloric acid) (15mL) (stop solution)
As per manufacturer’s instructions, enzyme immunoassay buffer, streptavidin-HRP
substrate and stop solution were stored in a refrigerator (2 to 8oC). The diluents for the standard, lyophilised standard, antiserum and biotinylated peptide were stored at -20oC. The stability of these reagents was 1 year, under conditions listed above.
Preparation of reagents
The unopened kit and reagents were brought to room temperature, before preparation of working reagents and samples.
1. Stock standard: To 1μg of lyophilised standard, 1mL of standard diluent was added and mixed thoroughly, using a vortex mixer.
Standard ng/mL Range : 0.02 to 25ng/mL Stock 1000
S1 25 Added 5μL stock + 195μL diluents
S2 6.25 Added 40μL (S1)+ 40μL diluents
S3 1.56 Added 40μL (S2)+ 40μL diluents
37 S5 0.10 Added 40μL (S4)+ 40μL diluents
S6 0.02 Added 40μL (S5)+ 40μLdiluents
S0 0.00 120μL diluents
2. Samples: The samples in the study were diluted 1 in 10 (12μL of sample + 108 μL of standard diluent). Dilutions were carried out to bring the concentration of the
analyte within the analytical measurement range.
3. Enzyme immunoassay buffer (EIA buffer): EIA buffer (50mL) was diluted to 1000mL, using sterile deionised water (18Mohm).
4. Anti-serum: To the lyophilised anti-serum powder, 5mL of EIA buffer was added and mixed well.
5. Biotinylated tracer (bt tracer): To the lyophilisedBt-tracer powder, 5mL of EIA buffer was added and mixed well.
38
Layout of a 96-well coated micro-well plate for the hepcidin assay
1 2 3 4 5 6 7 8 9 10 11 12
A B B T1 T1 T9 T9 T17 T17 T25 T25 T33 T33
B S1 S1 T2 T2 T10 T10 T18 T18 T26 T26 T34 T34
C S2 S2 T3 T3 T11 T11 T19 T19 T27 T27 T35 T35
D S3 S3 T4 T4 T12 T12 T20 T20 T28 T28 T36 T36
E S4 S4 T5 T5 T13 T13 T21 T21 T29 T29 T37 T37
F S5 S5 T6 T6 T14 T14 T22 T22 T30 T30 T38 T38
G S6 S6 T7 T7 T15 T15 T23 T23 T31 T31 T39 T39
H S0 S0 T8 T8 T16 T16 T24 T24 T32 T32 T40 T40
B- blank, S- standard, T- test samples
Assay procedure
Step 1: 25μL of antiserum was added to each well; 25μL of EIA buffer was added to
the blank well. These were incubated for 1hour at room temperature.
Step 2: 50μL of diluted standard/ sample was added to respective wells. To the blank well, 50μL of diluent was added. The plate was incubated for 2hours at room
temperature.
Step 3: 25μL of reconstituted Bt-tracer was added to each well.
Step 4: Using its acetate plate cover (provided with the kit), the microplate was sealed and incubated overnight, at 4oC in a refrigerator.
39 Step 6: Each well was carefully washed, with 300μL of EIA buffer. This was done 5
times.
Step7: 100μL of streptavidin-HRP solution was added to each well. The plate was
incubated at room temperature for 1hr.
Step 8: At the end of the incubation, each well was washed with 300μL of EIA buffer.
This was done 5 times.
Step 9: 100μL of TMB (substrate solution) was added to each well. The reaction
mixture was incubated at room temperature for 60mins.
Step 10: During development of a blue color that ensued, readings of the wells in the plate were taken at 650 nm,at 15, 30, 45, and 60 minutes after addition of TMB.
Step 11: At the end of 60 minutes, 2N HCl (100μL per well) was added to terminate the reaction.
Step 12: Readings were then taken at 450 nm, at 3, 6, and 10 mins after terminating the reaction.
40
Image of the microtitre plate after termination of the reaction
All standards and samples were estimated in duplicate; the average of the OD readings was used for purposes of calculations. The OD values obtained for the standards were used to plot a standard curve, by 4-parameter logistic regression. A semi-log scale was used (on Microsoft Office Excel 2010). The concentrations of standards (ng/mL) were plotted on the X-axis and the OD readings on Y-axis. Values for serum hepcidin levels were calculated after adjusting for sample dilutions (dilution factor of 10).This was done, using four parameter logistic regression analysis, by the following equation:
41 The values a (maximum value of OD in the standard curve), b (slope), c (point of inflection (IC50)), d (minimum value of OD in the standard curve) in the equation were used to get the standard curve to fit the data, as closely as possible.
Standard curve of hepcidin
The concentration of hepcidin (ng/mL) in each sample was calculated, using the following equation:
42
DATA ANALYSIS
Data were analyzed using the Statistical Package for Social Sciences (SPSS), version 17. The Kolmogorov-Smirnov test was used to check normality of distribution of data. The independent student’s t-test was used to analyze data that was normally
distributed and the Mann-Whitney U test for data that had a skewed distribution. For categorical variables, the difference between two groups was analyzed by chi-square test. Pearson’s and Spearman’s correlation coefficients were used for correlation
43
RESULTS
Eighty two primigravidae were recruited during the period of the study. Of these, 23 were diagnosed to have GDM (28.04%), based on the results of their OGTT. The remaining 59 had normal results for their OGTT (71.95%). Of the 82 recruited, 49 women (59.75%) delivered their babies in CHAD hospital, 26 (31.70%) delivered in other hospitals and 5 (6.07%) delivered in their homes. At the time of analysis, 2 women (2.43%) were yet to deliver. Two of the women had delivered low-birth weight babies (less than 2500 gm); another baby had respiratory distress initially, but recovered soon.
DISTRIBUTION OF DATA
44
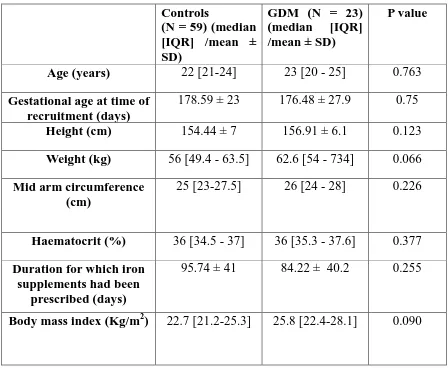
Table 1: Clinical characteristics of subjects in the study
Controls
(N = 59) (median [IQR] /mean ± SD)
GDM (N = 23) (median [IQR] /mean ± SD)
P value
Age (years) 22 [21-24] 23 [20 - 25] 0.763
Gestational age at time of recruitment (days)
178.59 ± 23 176.48 ± 27.9 0.75
Height (cm) 154.44 ± 7 156.91 ± 6.1 0.123
Weight (kg) 56 [49.4 - 63.5] 62.6 [54 - 734] 0.066
Mid arm circumference (cm)
25 [23-27.5] 26 [24 - 28] 0.226
Haematocrit (%) 36 [34.5 - 37] 36 [35.3 - 37.6] 0.377
Duration for which iron supplements had been
prescribed (days)
95.74 ± 41 84.22 ± 40.2 0.255
Body mass index (Kg/m2) 22.7 [21.2-25.3] 25.8 [22.4-28.1] 0.090
Data were analysed by Mann-Whitney U test or Student’s t test, as appropriate.
45
Table 2: OGTT resultsin control and GDM subjects
Controls (N=59) (mean ± SD)
GDM (N = 23) (mean ± SD)
P value
Fasting plasma glucose (mg/dL)
81.93 ± 4.9 92.09 ± 8.4 <0.001
Plasma glucose after 1 hr during OGTT
(mg/dL)
135.39 ± 25.3 171.96 ± 40.1 <0.001
Plasma glucose after 2 hr during OGTT
(mg/dL)
117 ± 18.3 149.22 ± 32.2 <0.001
Data were analysed by Mann-Whitney U test or Student’s t test, as appropriate.
46
Table 3: Family history of diabetes mellitus
3a:
3b:
Group Family history of diabetes mellitus
Both parents
Father Mother No history
Controls (N=59) 7 (11.86%) 19 (32.20%) 6 (10.16%) 27 (45.76%) GDM (N=23) 3 (13.04%) 9 (39.13%) 4 (17.39%) 7 (30.43%)
There was no significant difference between the 2 groups, with regard to a family history of diabetes (as assessed by the Chi-square test).
Group Family history of diabetes mellitus
Absent Present
Controls (N=59)
27 (45.76%) 32 (54.23%)
GDM (N= 23)
47
Figure 1: Haematocrit values in control and GDM groups
Data are shown as box and whisker plots, with median and quartiles.
48
Figure 2: Serum iron levels in the control and GDM groups
Data are shown as box and whisker plots, with median and quartiles.
Serum iron levels in the control and GDM groups were similar in both groups
49
Figure 3: Serum ferritin levels in the control and GDM groups
Data are shown as box and whisker plots, with median and quartiles.
50
Figure 4: Serum hepcidin levels in the control and GDM groups
Data are shown as box and whisker plots, with median and quartiles.
51
Figure 5: Serum TIBC values in the control and GDM groups
Data are shown as mean ± SD.
52
Figure 6: Serum transferrin saturation levels in the control and GDM groups
Data are shown as box and whisker plots, with median and quartiles.
53
Figure 7: Serum CRP levels in the control and GDM groups
Data are shown as box and whisker plots, with median and quartiles.
54
Figure 8: Number of days for which iron was prescribedin the control and GDM
groups
Data are shown as mean ± SD.
55
Figure 9: Correlation analysis of serum levels of ferritin and iron
56
Figure 10: Correlation analysis of serum levels of ferritin and TIBC
57
Figure 11: Correlation analysis of serum ferritin and transferrin saturation
58
Figure 12: Correlation analysis of serum levels of ferritin and CRP
59
Figure 13: Correlation analysis of serum levels of hepcidin and ferritin
60
Figure 14: Correlation analysis of serum levels of hepcidin and iron
61
Figure 15: Correlation analysis of serum levels of hepcidin and TIBC
62
Figure 16: Correlation analysis of serum levels of hepcidin and transferrin
saturation
63
Figure 17: Correlation analysis of serum levels of hepcidin and CRP
64
Table 5: Outcomes of pregnancies of the subjects
Controls
(mean ± SD or median [IQR])
GDM
(mean ± SD or median [IQR])
P value
Gestational ages at delivery (days)
252.64 ± 13.4 258.13 ± 13.1 0.101
Birth weight of baby (kg) 2.81 [2.6 - 3.2] 2.66 [2.49 - 2.96] 0.088
APGAR score (out of 15) 14 [13 - 15] 13 [12.5 - 15] 0.535
Length of the baby (cm) 53 [52 - 56] 54 [52 - 57] 0.389
Data were analysed by Mann-Whitney U test or Student’s t test, as appropriate.
65
Table 6: Mode of delivery
Group Mode of delivery
Normal vaginal delivery
Forceps Suction cup LSCS
Controls (N= 57) 29 (50.87%) 3 (5.26%) 4 (7.01%) 21 (36.84%) GDM (N= 23) 10 (43.47%) 2 (8.69%) 2 (8.69%) 9 (39.13%)
66
SUMMARY OF FINDINGS
1. Primigravidae, with and without GDM, did not differ with regard to values of haematocrit, BMI, serum ferritin, hepcidin, iron, TIBC, transferrin saturation and CRP.
2. Serum ferritin bore a significant positive correlation with serum transferrin saturation, and a significant negative correlation with TIBC values.
3. Serum hepcidin level bore significant positive correlation with serum iron, ferritin and transferrin saturation and a significant negative correlation with TIBC values.
3. The gestational ages at delivery, birth weight of the baby, the APGAR score, and length of the new-borns were similar in both groups.
67
DISCUSSION
In pregnancy, serum ferritin levels have been shown to be lower compared to healthy non-pregnant women, reflecting a state of iron deficiency (Adediran et al., 2011; Alper et al., 2000). It is, therefore, expected that hepcidin expression would be downregulated during pregnancy to meet the additional needs of the growing fetus. Serum ferritin and hepcidin levels have been shown to decline in pregnancy, with levels being lowest in the third trimester (Adediran et al., 2011; Alper et al., 2000; Dao et al., 2013; Finkenstedt et al., 2012; Gyarmati et al., 2011; van Santen et al., 2013). Maternal serum ferritin levels have been shown to peak in the second trimester and decline thereafter (Larsson et al., 2008; Xiao et al., 2002).
cation-68 exchange chromatography. It is difficult to make direct comparison of serum levels of hepcidin levels across these studies, as measurements were carried usingdifferent methods of assay. There is no established reference interval for serum hepcidin across the trimesters of pregnancy. The small number of studies in this area, variations in methods of estimation and lack of an established reference interval make it difficult to directly compare the results of above studies (Koenig et al., 2014).
Studies have shown that serum ferritin and hepcidin levels were elevated in patients with type 2 diabetes mellitus (Altamura et al., 2017; Andrews et al., 2015; Martinelli et al., 2012). Increased serum ferritin levels in pregnant women have been reported to be a significant risk factor for gestational diabetes mellitus (Amiri et al., 2013; Chen et al., 2006; Javadian et al., 2014; Kataria et al., 2018; Lao et al., 2001). The study by Derbent et al. (2013), carried out in a Turkish population, reported significantly elevated serum ferritin, hepcidin and iron levels in women with GDM, compared to women with impaired glucose tolerance (IGT) and pregnant women with normal glucose tolerance.
69
Similarities between the present study and that by Derbent et al (2013)
Feature Present study Study by Derbent et al
(2013)
Gestational agewhenblood
was taken for estimations
of parameters of interest
24-28 weeks 24-28 weeks
Haematocrit values Similar in those with and
without GDM.
Similar in those with and without GDM.
Differences between the present study and that by Derbent et al (2013)
Feature Present study Study by Derbent et al
(2013)
Sample size 82 in total (23 with GDM
and 59 without GDM)
149 in total (30 with GDM, 72 without GDM and 47 with impaired glucose tolerance)
Gravida of subjects
in the study
Subjects with and without GDM were all primigravidae.
70
Feature Present study Study by Derbent et al
(2013)
Ages of subjects in
the study
Ages of women with and without GDM were similar
Women with GDM were significantly older than women without GDM
BMI of subjects in the
study
BMI and mid-arm circumference were found to be similar in both groups of women.
Women with GDM had significantly higher BMI values than women without GDM.
Iron and folic acid
supplements
All subjects were on iron and folic acid supplements
None were on iron or folic acid supplements
Blood sample used for
measurement of serum
levels of ferritin, hepcidin
and marker of iron stores
Fasting blood sample Blood samples collected were in the non-fasting state.
Assay and instrument used
for estimation of serum
ferritin levels
Chemiluminescence assay, Siemens, ADVIA, Centaur System, XPi, UK
Electro-chemiluminescence assay, E170, Roche, Germany
ELISA kit used for
estimation of serum
hepcidn
71
Feature Present study Study by Derbent et al
(2013)
Diagnosis of GDM
made by
OGTT using 75 gm of oral glucose load
Glucose challenge test (GCT) (50 gm of glucose load), followed by anOGTT (100 gm of glucose load), for those who tested positive on the GCT.
Diagnostic criteria
used for GDM
At least 1 abnormal value of plasma glucose for fasting, 1 hour or 2 hours samples, after a 75 gm glucose load, as per criteria of the International
Association of the Diabetes and Pregnancy Study Groups (IADPSG)(ADA, 2016).
At least 2 abnormal values of plasma glucose for fasting, 1 hour, 2 hours and 3 hours samples, after a 100 gm glucose load (modified National Diabetes Data Group [NDDG] criteria) (Carpenter and Coustan, 1982)
Serum ferritin levels Serum ferritin levels were
similar in those with GDM and without GDM.
72 those without GDM.
Feature Present study Study by Derbent et al
(2013)
Serum hepcidin levels Serum hepcidin levels were
similar in those with GDM and without GDM.
Serum hepcidin levels were significantly higher in those with GDM than in those without GDM.
Serum iron levels Serum iron levels were
similar in those with GDM and without GDM.
Serum iron levels were significantly higher in those with GDM than in those without GDM.
Serum CRP levels Serum CRP levels were
similar in those with and without GDM.
Serum CRP levels were significantly higher in those with GDM than in those without GDM.
73 The present study shows that serum ferritin levels were similar in women with and without GDM. It has been reported that increased levels of serum ferritin in pregnant women were associated with increased risk of gestational diabetes mellitus (Chen et al., 2006; Kataria et al., 2018). However, the present study does not show this association. This difference could be due to the fact that in those earlier studies multiparous women were included in the GDM group, different glucose loads were used for the GTT and the BMI were significantly higher in women with GDM.
Maternal serum ferritin levels showed positive correlation with percentage of transferrin saturation and a significant negative correlation with values for TIBC. These findings are in agreement with other studies that showed that maternal serum ferritin levels correlated significantly with percentage of transferrin saturation and TIBC (Amiri et al., 2013; Kataria et al., 2018; Raza et al., 2011).
In the present study, maternal serum hepcidin levels showed a significant positive correlation with serum levels of ferritin, iron, percentage of transferrin saturation and a significant negative correlation with TIBC. These findings are in agreement with other studies that showed that maternal hepcidin levels correlated significantly with markers of maternal iron status (Finkenstedt et al., 2012; Rehu et al., 2010; van Santen et al., 2013).
74 Studies have been used MAC as an indicator of obesity (Fakier et al., 2017; Okereke et al., 2013). The MAC of the subjects in 2 groups in the present study wassimilar. MAC hasalso been reported to be similar in pregnant women, irrespective of their taking iron supplements(Hedengran et al., 2016). This parameter also did not differ between pregnant women with favourable and favourableoutcomesof pregnancy (van Santen et al., 2013; Schulze et al., 2008).
75 Pregnancy is a pro-inflammatory state. Pregnant women have been shown to have elevations in inflammatory markers, compared to healthy non-pregnant women (Nemeth et al., 2003). In the study by Derbent et al (2013), serum C-reactive protein (CRP) levels were significantly higher in women with GDM, than women without GDM. However, the present study has shown that serum CRP levels were similar in 2 groups. Factors that may contribute to this difference include the facts that women with GDM in the study by Derbent et al (2013) were older than the control subjects, were multiparous (while those in the control group wereprimigravidae) and had higher values for BMI than control subjects.
76
CONCLUSION
77
LIMITATIONS OF THE STUDY
1. One of the secondary objectives of the study was to follow up the subjects to determine outcomes of pregnancies. However, some of them were yet to deliver at the time of submission of this thesis. Hence, it has not been possible to document all these outcomes to complete the comparisons between the 2 groups.
78
BIBLIOGRAPHY
Abbassi-Ghanavati, M., Greer, L.G., and Cunningham, F.G. (2009).
Pregnancy and laboratory studies: a reference table for clinicians.
Obstet. Gynecol.
114
, 1326–1331.
Abboud, S., and Haile, D.J. (2000). A novel mammalian
iron-regulated protein involved in intracellular iron metabolism. J. Biol.
Chem.
275
, 19906–19912.
Adediran, A., Gbadegesin, A., Adeyemo, T.A., Akinbami, A.A.,
Akanmu, A.S., Osunkalu, V., Ogbenna, A.A., and Oremosu, A.
(2011). Haemoglobin and ferritin concentrations of pregnant women
at term. Obstet. Med.
4
, 152–155.
Alberti, K. g. m. m., and Zimmet, P. z. (1998). Definition, diagnosis
and classification of diabetes mellitus and its complications. Part 1:
diagnosis and classification of diabetes mellitus. Provisional report of
a WHO Consultation. Diabet. Med.
15
, 539–553.
Alizadeh, L., and Salehi, L. (2016). Is Routine Iron Supplementation
Necessary in Pregnant Women With High Hemoglobin? Iran. Red
Crescent Med. J.
18
.
Allen, L.H. (2000). Anemia and iron deficiency: effects on pregnancy
outcome. Am. J. Clin. Nutr.
71
, 1280S–1284S.
Alper, B.S., Kimber, R., and Reddy, A.K. (2000). Using ferritin levels
to determine iron-deficiency anemia in pregnancy. J. Fam. Pract.
49
,
829–832.
79
Amiri, F.N., Basirat, Z., Omidvar, S., Sharbatdaran, M., Tilaki, K.H.,
and Pouramir, M. (2013). Comparison of the serum iron, ferritin
levels and total iron-binding capacity between pregnant women with
and without gestational diabetes. J. Nat. Sci. Biol. Med.
4
, 302–305.
Anderson, E.J., Lustig, M.E., Boyle, K.E., Woodlief, T.L., Kane,
D.A., Lin, C.-T., Price, J.W., Kang, L., Rabinovitch, P.S., Szeto,
H.H., et al. (2009). Mitochondrial H2O2 emission and cellular redox
state link excess fat intake to insulin resistance in both rodents and
humans. J. Clin. Invest.
119
, 573–581.
Andrews, M., Soto, N., and Arredondo-Olguín, M. (2015).
Association between ferritin and hepcidin levels and inflammatory
status in patients with type 2 diabetes mellitus and obesity. Nutr.
Burbank Los Angel. Cty. Calif
31
, 51–57.
Andrews, N.C., Fleming, M.D., and Gunshin, H. (1999). Iron
transport across biologic membranes. Nutr. Rev.
57
, 114–123.
Anjana, R.M., Pradeepa, R., Deepa, M., Datta, M., Sudha, V.,
Unnikrishnan, R., Nath, L.M., Das, A.K., Madhu, V., Rao, P.V., et al.
(2011). The Indian Council of Medical Research—India Diabetes
(ICMR-INDIAB) Study: Methodological Details. J. Diabetes Sci.
Technol.
5
, 906–914.
Arezes, J., Costa, M., Vieira, I., Dias, V., Kong, X.L., Fernandes, R.,
Vos, M., Carlsson, A., Rikers, Y., Porto, G., et al. (2013).
Non-Transferrin-Bound Iron (NTBI) Uptake by T Lymphocytes: Evidence
for the Selective Acquisition of Oligomeric Ferric Citrate Species.
PLoS ONE
8
.
Arosio, P., and Levi, S. (2010). Cytosolic and mitochondrial ferritins
in the regulation of cellular iron homeostasis and oxidative damage.
Biochim. Biophys. Acta
1800
, 783–792.
80
Association, A.D. (2016). 2. Classification and Diagnosis of Diabetes.
Diabetes Care
39
, S13–S22.
Barisani, D., Berg, C.L., Wessling-Resnick, M., and Gollan, J.L.
(1995). Evidence for a low Km transporter for non-transferrin-bound
iron in isolated rat hepatocytes. Am. J. Physiol.-Gastrointest. Liver
Physiol.
269
, G570–G576.
Bhaskaram, P. (2001). Immunobiology of mild micronutrient
deficiencies. Br. J. Nutr.
85
, S75–S80.
Boriboonhirunsarn, D., Talungjit, P., Sunsaneevithayakul, P., and
Sirisomboon, R. (2006). Adverse pregnancy outcomes in gestational
diabetes mellitus. J. Med. Assoc. Thail. Chotmaihet Thangphaet
89
Suppl 4
, S23-28.
Bowers, K.A., Olsen, S.F., Bao, W., Halldorsson, T.I., Strøm, M., and
Zhang, C. (2016). Plasma Concentrations of Ferritin in Early
Pregnancy Are Associated with Risk of Gestational Diabetes Mellitus
in Women in the Danish National Birth Cohort. J. Nutr.
146
, 1756–
1761.
Bridle, K.R., Frazer, D.M., Wilkins, S.J., Dixon, J.L., Purdie, D.M.,
Crawford, D.H.G., Subramaniam, V.N., Powell, L.W., Anderson,
G.J., and Ramm, G.A. (2003). Disrupted hepcidin regulation in
HFE-associated haemochromatosis and the liver as a regulator of body iron
homoeostasis. Lancet Lond. Engl.
361
, 669–673.
Buchanan, T.A., Xiang, A.H., and Page, K.A. (2012). Gestational
Diabetes Mellitus: Risks and Management during and after
Pregnancy. Nat. Rev. Endocrinol.
8
, 639–649.
Chen, H., Attieh, Z.K., Syed, B.A., Kuo, Y.-M., Stevens, V., Fuqua,
B.K., Andersen, H.S., Naylor, C.E., Evans, R.W., Gambling, L., et al.
(2010). Identification of zyklopen, a new member of the vertebrate
multicopper ferroxidase family, and characterization in rodents and
human cells. J. Nutr.
140
, 1728–1735.
81
Hepatoma Cells via Interactions That Differ from Transferrin
Receptor 1-HFE Interactions. J. Biol. Chem.
282
, 36862–36870.
Chen, X., Scholl, T.O., and Stein, T.P. (2006). Association of
Elevated Serum Ferritin Levels and the Risk of Gestational Diabetes
Mellitus in Pregnant Women. Diabetes Care
29
, 1077–1082.
Dao, M.C., Sen, S., Iyer, C., Klebenov, D., and Meydani, S.N.
(2013a). Obesity during pregnancy and fetal iron status: is Hepcidin
the link? J. Perinatol. Off. J. Calif. Perinat. Assoc.
33
, 177–181.
Dao, M.C., Sen,