This is a repository copy of Time to Reconsider the Role of Relative Blood Volume Monitoring for Fluid Management in Hemodialysis.
White Rose Research Online URL for this paper: http://eprints.whiterose.ac.uk/127858/
Version: Accepted Version
Article:
Keane, DF, Baxter, P orcid.org/0000-0003-2699-3103, Lindley, E et al. (2 more authors) (2018) Time to Reconsider the Role of Relative Blood Volume Monitoring for Fluid Management in Hemodialysis. ASAIO Journal, 64 (6). pp. 812-818. ISSN 1058-2916 https://doi.org/10.1097/MAT.0000000000000795
© 2018 by the American Society for Artificial Internal Organs. This is an author produced version of a paper published in ASAIO Journal. Uploaded in accordance with the
publisher's self-archiving policy.
eprints@whiterose.ac.uk https://eprints.whiterose.ac.uk/
Reuse
Items deposited in White Rose Research Online are protected by copyright, with all rights reserved unless indicated otherwise. They may be downloaded and/or printed for private study, or other acts as permitted by national copyright laws. The publisher or other rights holders may allow further reproduction and re-use of the full text version. This is indicated by the licence information on the White Rose Research Online record for the item.
Takedown
If you consider content in White Rose Research Online to be in breach of UK law, please notify us by
Time to reconsider the role of relative blood volume
monitoring for fluid management in hemodialysis
David Keane1,2,3,4, Paul Baxter4, Elizabeth Lindley1,2,3, Sue Pavitt5, Laura Treadgold4
Departments of1Renal Medicine and2Medical Physics Leeds Teaching Hospitals NHS Trust, 3NIHR Devices for Dignity Healthcare Technology Co-operative;4Leeds Institute for
Abstract
Introduction
Fluid management is one of the principal functions of hemodialysis. Clinical assessment of fluid status has been the basis of deciding how much fluid to remove during each treatment, but it is accepted that this approach is inadequate (1). A number of technologies have been proposed for objective assessment of fluid status, including measurement of relative blood volume (RBV). RBV devices measure changes in intravascular fluid status of the blood passing through the dialysis lines by monitoring the concentration of constituents of whole-blood, such as hemoglobin or hematocrit. These hemoconcentration markers can be measured by a number of techniques, including optical absorbance or transmission, the speed of ultrasound or conductivity but all effectively monitor relative changes in blood water concentration (2). These simple, non-invasive measurements can detect reductions in blood volume in real time, offering the potential for prevention of intradialytic hypotension (IDH) and improved fluid management. However, despite being used in hemodialysis for almost 30 years, there is still no robust evidence as to how the measurements can be used in practice.
There are two major assumptions underpinning the use of RBV in hemodialysis. Firstly, that the hemoconcentration observed in blood passing through the dialysis lines reflects the relative change in the concentration of the whole blood volume. This is valid as long as both the amount of the marker being measured and the distribution of this marker are constant throughout the measurement session (3). Hemolysis, blood leaks or blood transfusions during hemodialysis could affect the total amount of the marker, but these are not common. Because capillaries and the central circulation have different concentrations of red blood cells (known as the F-cell ratio), changes in capillary blood flow during a dialysis session could alter the distribution of the hemoconcentration marker (4).
Secondly, for the technology to be used for fluid management there must be a relationship between RBV changes and fluid status. A constant or increasing RBV is widely interpreted as a sign that the rate of refilling of the vascular space from the interstitium matches or exceeds the rate of fluid removal, indicative of interstitial fluid overload, while reductions in RBV suggest that vascular refilling cannot compensate for fluid removal, indicative of reduced interstitial fluid volumes. When these principles are applied to real-time monitoring of RBV, often as part of a feedback controlled mechanism, reducing ultrafiltration rates in response to RBV reductions can reduce the number of hypotensive episodes (5). When applied to target weight management, RBV values that are relatively constant during a dialysis session are assumed to indicate that the patient is fluid overloaded, typically leading to reductions in target weight until there is an acceptable drop in RBV over a dialysis session (6). However, there are no clear definitions of the different trajectories and good evidence in support of this approach is lacking. The only randomized controlled trial looking at the effect of RBV based fluid management on hard outcomes actually showed increased mortality in the group managed with RBV (7).
Germany) uses a model specifically designed for renal patients (8) to give an estimate of fluid overload, which the device names “overhydration” (OH) (we will use OH to specifically describe the parameter measured by BCM and ‘fluid overload’ to describe the physiological state). BCM-measured OH has been well validated (9) and shown to be directly associated with morbidity and mortality in hemodialysis patients (10). Although experience and clinical judgment is required when interpreting BCM data, it is less subjective than the interpretation of changes in RBV
RBV and BCM are measuring two distinct compartments - relative fluid volumes in the circulation and fluid in the tissue respectively - and they have the potential to be complementary techniques. This study aimed to exploit the greater evidence base underpinning BCM-based fluid management to try to improve our understanding of how RBV can inform fluid management.
Methods
Subjects
This study is a subanalysis of a study analysing the validity of alternative BCM measurement protocols (11) and is exploratory in nature, so no formal sample size calculation was performed. A cohort of 47 stable hemodialysis patients was recruited, being over 18 years old and having no apparent localised fluid accumulations. Hemodialysis prescriptions were for regimes of three sessions of four hours per week, dialysate temperature was 36 C, sodium was 137mmol/L as standard and patients were free to eat and drink as they desired.
Data collection
Bioimpedance measurements with the BCM were made before dialysis according to manufacturer’s instructions. Measurements were checked visually for artefacts, and repeated until the difference in BCM-measured OH was no greater than 0.2 L between readings. Post-dialysis OH was calculated as pre-Post-dialysis OH minus the change in weight of the patient over the dialysis session.
RBV measurements were made using the Crit-Line III Monitor (Hema-metrics, Kaysville, UT, USA). The RBV results from each hemodialysis session were downloaded to allow analysis. Device calibration was checked monthly using a verification filter. Planned and achieved ultrafiltration volumes were recorded.
Data analysis
RBV was defined using the percentage reduction in RBV normalised for time in hours
( RBV/h). Each RBV slope was characterised based on the approach set out by Lopot et al. (6) (fig. 1) using a value of the RBV/h slope cut-off (Scut-off) to distinguish slopes.
B) Late reduction: ‘B’ slopes are characterised by a flat slope over an initial period of the hemodialysis session (with a maximum slope of Scut-offfor at least one hour) followed
by a more rapid reduction in blood volume for the remainder of the session (with a minimum slope of Scut-off).
C) Linear reduction: ‘C’ slopes are characterised by a linear reduction in blood volume throughout the hemodialysis session (with a minimum slope of Scut-off)
D) Early reduction: ‘D’ slopes are the inverse of ‘B’ slopes and are characterised by an initial rapid blood volume slope (with a minimum slope of Scut-off for at least one
hour) followed by a flat slope for the rest of the session (a maximum slope of Scut-off)
Manufacturer’s guidance for distinguishing between slope groups A to D use a value for S cut-off of 3% and this was also the basis of the fluid management strategies in the CLIMB trial
(7). Other ways of distinguishing groups have been used that vary quite significantly from the manufacturer’s proposal, notably the use by Sinha et al. of a conservative value of Scut-off of
1.5% (12).
In addition to using RBV/h as the basis of categorising each treatment session, associations between the value itself and other variables were explored.
Statistical analysis: Pre- and post-dialysis OH, body mass index (BMI), RBV/h and ultrafiltration parameters (UFV, UFV normalised by body weight - specific UFV - and ultrafiltration rate (UFR) normalised to body weight - specific UFR) were compared between the RBV groups by one-way analysis of variance (ANOVA). Because there are numerous criteria for categorising RBV trajectories, sensitivity analysis was undertaken to re-classify all the data based on the a conservative definition of Scutoff as a maximum fall of 1.3% per
hour (12).
The relationship between RBV/h and pre- and post-dialysis OH and UFV were investigated using the Pearson correlation coefficient (r).
Results
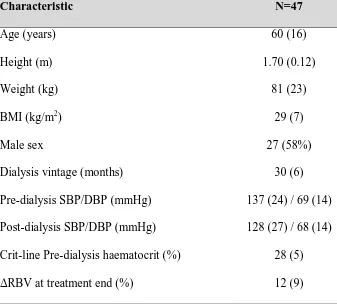
The characteristics of the included subjects can be seen in table 1. Treatment sessions were all completed without any recorded symptoms or interventions. There was only one patient in the ‘B’ group, so for analysis ‘B’ and ‘C’ slope groups were combined as representing blood volume dynamics following classic Guyton physiology (13).
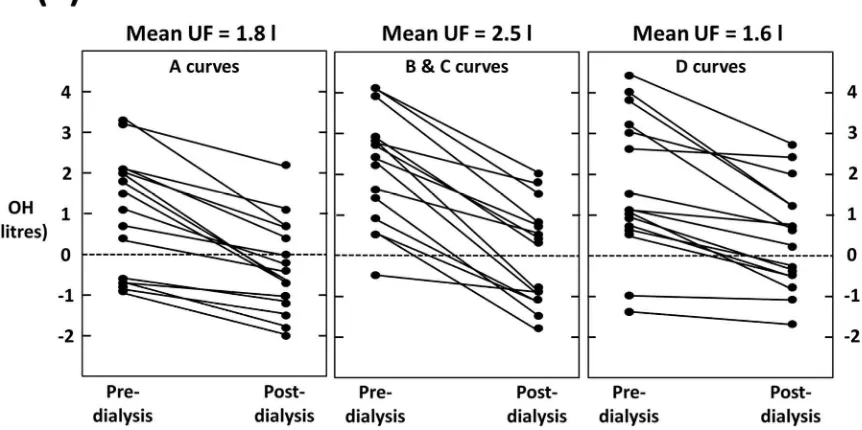
The plots of pre- and post-dialysis BCM-measured OH by RBV category confirm that there is no discernible difference in OH pattern between the groups (fig. 2). Across all categories there were subjects who finish dialysis fluid depleted as measured by BCM.
There was no association between the rate of reduction of the RBV slope ( RBV/h) and either pre- or -post dialysis OH, but the specific UFR was positively associated with RBV/h (r=0.29, p=0.045; figure 3).
Discussion
These results question some commonly-held views on the association between changes in RBV during dialysis and fluid status. Although there is no gold-standard assessment of excess fluid, BCM assessments of fluid status have well described measurement characteristics and reproducibility (14). Furthermore, hemodialysis patients with BCM-measured OH that is too high or too low (15) have reduced survival. Maduell et al. have previously demonstrated a relationship between RBV and BCM-measured OH (16). Here we build on Maduell’s work by evaluating the impact of fluid management strategies based on common approaches to interpreting RBV on fluid status using the BCM.
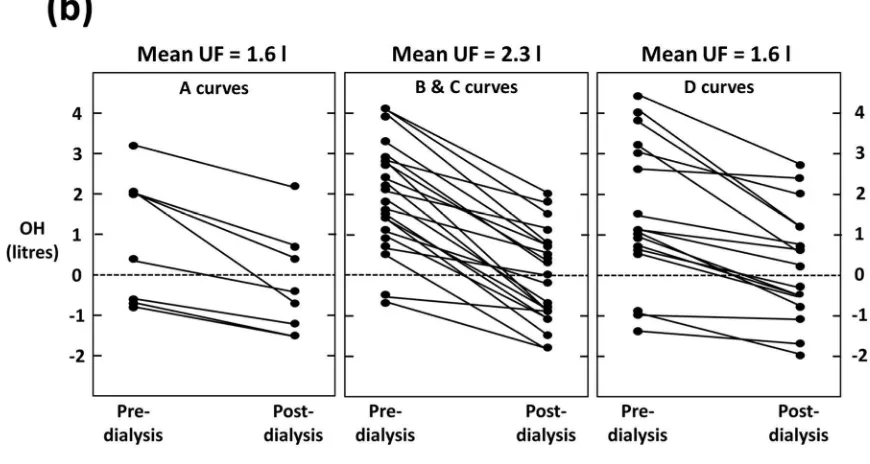
‘A’ slopes (or flat-lines) in response to ultrafiltration are generally assumed to suggest that fluid excess is driving vascular refilling and the maintenance of RBV. Based on this assumption, a reduction in target weight would normally be indicated. The data here suggests that subjects finishing dialysis up to 2 L fluid-depleted, as measured by BCM, were classed as having an ‘A’ shaped curve. Even using conservative definitions of the curves, over half the subjects with an ‘A’ slope finished hemodialysis fluid depleted (fig. 2). Reducing target weight in individuals with ‘A’ slopes would lead to excessive post-dialysis fluid depletion and risk of IDH. There are studies that have demonstrated benefit from reducing target weights in patients with a flat-line (17,18), but the outcomes presented are limited, such as achievement of reduced weight which, in itself, does not necessarily translate to better outcomes. It is possible that fluid management based on these principles is not dissimilar to probing for dry weights.
The ‘A’ slopes in patents finishing dialysis fluid depleted could be explained by a non-constant F-cell ratio. Hemodialysis is associated with fluid shifts from the microcirculation to the macrocirculation to maintain central blood volume (19). Mitra et al. showed that this increases RBV values, in their study by about 8%, and this effect could mask real reductions in absolute blood volume. Postural changes and eating have also been shown to affect the F-cell ratio (3).
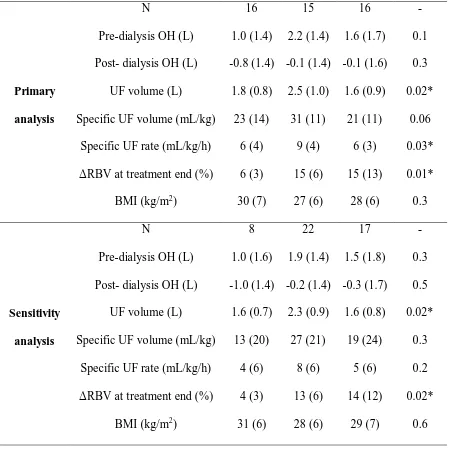
The data from this study underlined this uncertainty. Although the rate of change in RBV is often used to adjust target weight, figure 3 shows there was no significant association between RBV/h and pre- or post-dialysis OH. However, patients in group B&C did have greater UFV and specific UFR than the other groups, and RBV/h was associated with specific UFR suggesting that the rate of fluid removal has a greater influence on RBV than the interstitial fluid volume driving vascular refilling.
‘D’ shaped curves have been associated with increased ultrafiltration volume (22), higher fluid overload (23) and treatments where patients became symptomatic (24). There are conflicting reports about how common these measurements are, from less than 1% in an adult unit (25) to 91% in a paediatric unit (26). The data here demonstrate clearly that these changes cannot always be physiological. Figure 4 shows the RBV data from four subjects in this study with ‘D’ shaped curves. Despite the apparent large reduction in RBV, the treatments was completed without complications and stable blood pressures. In each of these cases, the reduction in RBV over the initial hour would suggest much greater fluid loss from the circulation than was removed by ultrafiltration, using estimated absolute blood volume from anthropometry (27). It is notable that in all these cases, the baseline hematocrit measured by the Crit-line was very low. Although we did not have reference blood samples from the same session for hematocrit comparison, routine, laborartory monthly blood data from sessions preceding and following the sessions monitored by Crit-line suggest all these patients’ hematocrit was stably in the normal range, suggesting a measurement artefact. An artefactually low initial hematocrit would correspond with overestimation of reductions in RBV, as observed here.
A common feature of all of the groups is high variation. Plasma refilling coefficient varies markedly between individual patients undergoing hemodialysis (22, 28), with a removal of 2 L of fluid over 1 hour giving anywhere between 0.7% and 21.9% reduction in RBV (29). It then follows that critical RBV limits will also vary between subjects (30). Removing the inter-subject variability by defining individual critical RBV limits improves the reliability and this has, in one study, been shown to predict IDH events with a variation of less than 5% RBV (31), but there still remains significant intra-individual variation in the RBV response to ultrafiltration (32). Concurrent use of BCM and RBV allows the opportunity to account for some of the variability between different measurement sessions and absolute blood volume (ABV) measurements could further explain intra-subject variation.
for the benefit of using the technology to guide decision making. It is also worth pointing out that dry weight determined from probing can be much lower than the weight at normal fluid status.
RBV measurements can also be used to automatically adjust the ultrafiltration rate using a feedback loop to attempt to avoid IDH. Results from randomised trials using this approach have been mixed. RBV-guided ultrafiltration in hypotensive prone patients has previously been shown to reduce the number of treatments with IDH (33), while more recently Leung et al. demonstrated no benefit from feedback control technology (34). When Antlanger et al. enrolled fluid overloaded patients and applied a rapid dry weight reduction protocol, they observed a lower rate of complications in the study group treated by ultrafiltration regulation and temperature regulation combined than in the conventional dialysis group, while ultrafiltration regulation and conductivity regulation was worst (35).
Measurement of ABV (36) offers the possibility of removing some of the inherent uncertainty in the use of RBV measurements. ABV measurements have been used to demonstrate that vascular refilling is dependent on UFV but not fluid overload, consistent with the results presented here (37), and a small pilot study has demonstrated that use of an ABV threshold to guide target weight management reduces IDH (38).
Our study was exploratory in nature and was not powered for outcomes; the relatively small numbers of participants in each group is a weakness. However, at an individual level, our data show that the commonly held view assumption that a low RBV/h (an ‘A’ slope) is not a reliable indicator of fluid overload. There is a real need for further studies, using well defined approaches to RBV-based fluid management, to evaluate the impact on outcomes.
Conclusions
These data call into question the assumption that patients with a flat-line RBV are fluid overloaded and require a reduction in target weight and that current use of RBV for fluid management could be leaving patients at risk of complications associated with low BCM measured-OH (15, 39). There is a need for further observational studies that use objective and reproducible classifications in the management of RBV. The complimentary nature of BCM, ABV and RBV supports further studies into how the information from both tests can be combined.
Acknowledgments
those of the authors and not necessarily those of the NHS, the National Institute for Health Research or the Department of Health.
This work was supported by the NIHR Healthcare Technology Cooperative Devices for Dignity.
References
1) SCHNEDITZ, D., POGGLITSCH, H., HORINA, J. & BINSWANGER, U. A blood protein monitor for the continuous measurement of blood volume changes during hemodialysis. Kidney Int, 38, 342-346. 1990
2) DASSELAAR, J., HUISMAN, R., DE JONG, P. & FRANSSEN, C. Measurement of relative blood volume changes during haemodialysis: merits and limitations. Nephrol, dialy, transplant, 20, 2043-2049. 2005
3) SCHNEDITZ, D., RIBITSCH, W., SCHILCHER, G., UHLMANN, M., CHAIT, Y. & STADLBAUER, V. Concordance of absolute and relative plasma volume changes and stability of Fcells in routine hemodialysis. Hemodial int. 20, 120-128. 2016
4) SANTOTO, A., MANCINI, E., BASILE, C., et al. Blood volume controlled hemodialysis in
hypotension-prone patients: A randomised, multicentre controlled trial. Kidney Int, 62, 1034-1045. 2002
5) LOPOT, F., NYIOMNAITHAM, V., SVÁROVÁ, POLAKOVIC, V., SVÁRA, F. & SULKOVÁ, S. Continuous blood volume monitoring and "dry weight" assessment. J ren care, 33, 52-58. 2007
6) REDDAN, D., SZCZECH, L. A., HASSELBLAD, V., et al. Intradialytic blood volume monitoring in ambulatory hemodialysis patients: a randomized trial. J Am Soc Nephrol, 16, 2162-2169. 2005
7) CHAMNEY, P., WABEL, P., MOISSL, U., et al. A whole-body model to distinguish excess fluid from the hydration of major body tissues. Am J Clin Nutr. 85, 80-89. 2007
8) WABEL, P., CHAMNEY, P., MOISSL, U. & JIRKA, T. Importance of whole-body bioimpedance spectroscopy for the management of fluid balance. Blood purif, 27, 75-80. 2009 9) WIZEMANN, V., WABEL, P., CHAMNEY, P. et al. The mortality risk of overhydration in
haemodialysis patients. Nephrol, dialy, transplant,, 24, 1574-1579. 2009
10) Keane DF, Baxter P, Lindley E, et al. The Body Composition Monitor: a flexible tool for routine fluid management across the haemodialysis population. Biomed Phys Eng Express. 25, 3. 2017
11) SINHA, A., LIGHT, R. & AGARWAL, R. Relative plasma volume monitoring during hemodialysis AIDS the assessment of dry weight. Hypertension, 55, 305-311. 2010
12) GUYTON, A. & HALL, J. 2006. Textbook of Medical Physiology, Elsevier.
13) WABEL, P., CHAMNEY, P., MOISSL, U. et al. Reproducibility of bioimpedance spectroscopy (BIS) in health and disease (abstract). Nephrol, dialy, transplant, 22(Suppl.6), 137-137. 2007
14) Dekker MJ, Marcelli D, Canaud BJ, et al. Impact of fluid status and inflammation and their interaction on survival: a study in an international hemodialysis patient cohort. Kidney Int. 91:1214-1223. 2017
15) MADUELL, F., Arias, M., Massó, E., et al. Sensitivity of blood volume monitoring for fluid status assessment in hemodialysis patients. Blood Purif. 35:202-8. 2013
17) RODRIGUEZ, H., DOMENICI, R., DIROLL, A. & GOYKHMAN, I. Assessment of dry weight by
monitoring changes in blood volume during hemodialysis using Crit-Line. Kidney Int, 68, 854-861. 2005
18) MITRA, S., CHAMNEY, P., GREENWOOD, R. & FARRINGTON, K. 2004. The relationship between systemic and whole-body hematocrit is not constant during ultrafiltration on hemodialysis. J Am Soc Nephrol, 15, 463-469. 2004.
19) STEUER, R. R., LEYPOLDT, J. K., CHEUNG, A. K., SENEKJIAN, H. O. & CONIS, J. M. Reducing
symptoms during hemodialysis by continuously monitoring the hematocrit.Am J Kidney Dis, 27, 525-532. 1996
20) MITRA, S., CHAMNEY, P., GREENWOOD, R. & FARRINGTON, K. Linear decay of relative blood volume during ultrafiltration predicts hemodynamic instability.Am J Kidney Dis. 40, 556-565. 2002
21) SANTORO, A., MANCINI, E. & ZUCCHELLI, P. Ultrafiltration behaviour with different dialysis schedules. Nephrol, dialy, transplant, 13 (Suppl 6), 55-61. 1998
22) BONELLO, M., HOUSE, A. A., CRUZ, D., et al. Integration of blood volume, blood pressure, heart rate and bioimpedance monitoring for the achievement of optimal dry body weight during chronic hemodialysis. Artif organs, 30, 1098-1108. 2007
23) HOTHI, D., HARVEY, E., GOIA, C. & GEARY, D. Blood-volume monitoring in paediatric haemodialysis. Pediatr nephrol, 23, 813-820. 2008
24) LOPOT, F., NEJEDLÝ, B. & SULKOVÁ, S. Continuous blood volume monitoring and ultrafiltration control. Hemodial int, 4, 8-14. 2000
25) DHEU, C., TERZIC, J., MENOUER, S. & FISCHBACH, M. Importance of the curve shape for
interpretation of blood volume monitor changes during haemodiafiltration. Pediatr nephrol, 24, 1419-1423. 2009.
26) NADLER, S., HIDALGO, J. & BLOCH, T. Prediction of blood volume in normal human adults. Surgery, 51, 224-232. 1962
27) IIMURA, O., TABEI, K., NAGASHIMA, H. & ASANO, Y. A study on regulating factors of plasma refilling during hemodialysis. Nephron, 74, 19-25. 1996
28) KOOMANS, H. A., GEERS, A. B. & MEES, E. J. Plasma volume recovery after ultrafiltration in patients with chronic renal failure. Kidney int, 26, 848-854. 1984
29)ANDRULLI, S., COLZANI, S., MASCIA, F., et al. The role of blood volume reduction in the genesis of intradialytic hypotension. Am J Kidney Dis, 40, 1244-1254. 2002
30) BARTH, C., BOER, W., GARZONI., et al. Characteristics of hypotension-prone haemodialysis patients: is there a critical relative blood volume? Nephrol, dialy, transplant, 18, 1353-1360. 2003
31) KREPEL, H. P., NETTE, R. W., AKÇAHÜSEYIN, E., WEIMAR, W. & ZIETSE, R. 2000. Variability of relative blood volume during haemodialysis. Nephrol, dialy, transplant,, 15, 673-679. 32) GABRIELLI, D., KRYSTAL, B., KATZARSKI, K., et al. Improved intradialytic stability during
haemodialysis with blood volume-controlled ultrafiltration. J nephrol, 22, 232-240. 2009 33) Leung, K.C.W., Quinn, R.R.., Ravani, P., Duff, H., MacRae, J.M. Randomized Crossover Trial of
Blood Volume Monitoring-Guided Ultrafiltration Biofeedback to Reduce Intradialytic Hypotensive Episodes with Hemodialysis. Clin J Am Soc Nephrol. 12:1831-1840. 2017
34) Antlanger M, Josten P, Kammer M., et al. Blood volume-monitored regulation of ultrafiltration to decrease the dry weight in fluid-overloaded hemodialysis patients: a randomized controlled trial. BMC Nephrol. 18:238. 2017
35) Schneditz D, Schilcher G, Ribitsch W, Krisper P, Haditsch B, Kron J. On-line dialysate infusion to estimate absolute blood volume in dialysis patients. ASAIO J. 60:436-42. 2014
37) Kron S, Schneditz D, Czerny J, Leimbach T, Budde K, Kron J. Adjustment of target weight based on absolute blood volume reduces the frequency of intradialytic morbid events. Hemodial Int. 2017
38) HUR, E., USTA, M., TOZ, H., et al. Effect of fluid management guided by bioimpedance spectroscopy on cardiovascular parameters in hemodialysis patients: a randomized controlled trial. Am J Kidney Dis, 61, 957-965. 2013
39) COVIC, A. & ONOFRIESCU, M. 2013. Time to improve fluid management in hemodialysis: should we abandon clinical assessment and routinely use bioimpedance? Clin J Am Soc Nephro, 8, 1474-1475.
[image:12.595.159.442.246.472.2]Figure/table legends
Figure 1:Characteristic trajectories of relative blood volume (RBV) curves
time
RBV
A
B
C
[image:12.595.90.521.530.745.2]Figure 2: (a) Data from the primary analysis and (b) from the sensitivity analysis showing pre and post BCM-measured OH for patients with relative blood volume plots of different
[image:13.595.84.519.88.320.2]Figure 3: Association of the change in relative blood volume per hour ( RBV/h) with (a) pre-and (b) post BCM-measured OH pre-and (c) ultrafiltration volume (Pearson’s r pre-and p-value: 0.22,
Figure 4: Example of a ‘D’ shaped relative blood volume curve with a reduction over the first hour that would be associated with a far greater drop in blood volume than the volume removed
by ultrafiltration
Characteristic N=47
Age (years) 60 (16)
Height (m) 1.70 (0.12)
Weight (kg) 81 (23)
BMI (kg/m2) 29 (7)
Male sex 27 (58%)
Dialysis vintage (months) 30 (6)
Pre-dialysis SBP/DBP (mmHg) 137 (24) / 69 (14)
Post-dialysis SBP/DBP (mmHg) 128 (27) / 68 (14)
Crit-line Pre-dialysis haematocrit (%) 28 (5)
RBV at treatment end (%) 12 (9)
Table 1: Subject demographics. Data are mean (standard deviation) for normal data and number (%) for categorical data. SBP is systolic blood pressure and DBP is diastolic blood
pressure
[image:15.595.131.468.360.666.2]Primary
analysis
N 16 15 16
-Pre-dialysis OH (L) 1.0 (1.4) 2.2 (1.4) 1.6 (1.7) 0.1
Post- dialysis OH (L) -0.8 (1.4) -0.1 (1.4) -0.1 (1.6) 0.3
UF volume (L) 1.8 (0.8) 2.5 (1.0) 1.6 (0.9) 0.02*
Specific UF volume (mL/kg) 23 (14) 31 (11) 21 (11) 0.06
Specific UF rate (mL/kg/h) 6 (4) 9 (4) 6 (3) 0.03*
RBV at treatment end (%) 6 (3) 15 (6) 15 (13) 0.01*
BMI (kg/m2) 30 (7) 27 (6) 28 (6) 0.3
Sensitivity
analysis
N 8 22 17
-Pre-dialysis OH (L) 1.0 (1.6) 1.9 (1.4) 1.5 (1.8) 0.3
Post- dialysis OH (L) -1.0 (1.4) -0.2 (1.4) -0.3 (1.7) 0.5
UF volume (L) 1.6 (0.7) 2.3 (0.9) 1.6 (0.8) 0.02*
Specific UF volume (mL/kg) 13 (20) 27 (21) 19 (24) 0.3
Specific UF rate (mL/kg/h) 4 (6) 8 (6) 5 (6) 0.2
RBV at treatment end (%) 4 (3) 13 (6) 14 (12) 0.02*
[image:16.595.74.525.71.522.2]BMI (kg/m2) 31 (6) 28 (6) 29 (7) 0.6
Table 2: Pre- and post-dialysis BCM-measured OH, ultrafiltration (UF) volume, specific UF volume, specific UF rate and BMI by slope group. Data is mean (standard deviation)
and the p-value relates to differences between the three groups based on ANOVA. * indicates p<0.05 for differences between groups B&C and D only using pairwise testing