R E S E A R C H
Open Access
Left ventricular blood flow kinetic energy
after myocardial infarction - insights from
4D flow cardiovascular magnetic resonance
Pankaj Garg
1*, Saul Crandon
1, Peter P. Swoboda
1, Graham J. Fent
1, James R. J. Foley
1, Pei G. Chew
1,
Louise A. E. Brown
1, Sethumadhavan Vijayan
1, Mariëlla E. C. J. Hassell
2, Robin Nijveldt
2, Malenka Bissell
1,
Mohammed S. M. Elbaz
3, Abdallah Al-Mohammad
4, Jos J. M. Westenberg
3, John P. Greenwood
1,
Rob J. van der Geest
3, Sven Plein
1and Erica Dall
’
Armellina
1Abstract
Background:Myocardial infarction (MI) leads to complex changes in left ventricular (LV) haemodynamics that are linked to clinical outcomes. We hypothesize that LV blood flow kinetic energy (KE) is altered in MI and is associated with LV function and infarct characteristics. This study aimed to investigate the intra-cavity LV blood flow KE in controls and MI patients, using cardiovascular magnetic resonance (CMR) four-dimensional (4D) flow assessment. Methods:Forty-eight patients with MI (acute-22; chronic-26) and 20 age/gender-matched healthy controls underwent CMR which included cines and whole-heart 4D flow. Patients also received late gadolinium enhancement imaging for infarct assessment. LV blood flow KE parameters were indexed to LV end-diastolic volume and include: averaged LV, minimal, systolic, diastolic, peak E-wave and peak A-wave KEiEDV. In addition, we investigated the in-plane proportion of LV KE (%) and the time difference (TD) to peak E-wave KE propagation from base to mid-ventricle was computed. Association of LV blood flow KE parameters to LV function and infarct size were investigated in all groups.
Results:LV KEiEDVwas higher in controls than in MI patients (8.5 ± 3μJ/ml versus 6.5 ± 3μJ/ml,P= 0.02). Additionally, systolic, minimal and diastolic peak E-wave KEiEDVwere lower in MI (P< 0.05). In logistic-regression analysis, systolic KEiEDV(Beta =−0.24,P< 0.01) demonstrated the strongest association with the presence of MI. In multiple-regression analysis, infarct size was most strongly associated with in-plane KE (r= 0.5, Beta = 1.1,P< 0.01). In patients with preserved LV ejection fraction (EF), minimal and in-plane KEiEDVwere reduced (P< 0.05) and time difference to peak E-wave KE propagation during diastole increased (P< 0.05) when compared to controls with normal EF.
Conclusions:Reduction in LV systolic function results in reduction in systolic flow KEiEDV. Infarct size is
independently associated with the proportion of in-plane LV KE. Degree of LV impairment is associated with TD of peak E-wave KE. In patient with preserved EF post MI, LV blood flow KE mapping demonstrated significant changes in the in-plane KE, the minimal KEiEDVand the TD. These three blood flow KE parameters may offer novel methods to identify and describe this patient population.
Keywords:4D flow CMR, Myocardial infarction, Hemodynamics, Flow quantification
* Correspondence:P.Garg@leeds.ac.uk
1Leeds Institute of Cardiovascular and Metabolic Medicine (LICAMM), University of
Leeds, Leeds LS2 9JT, UK
Full list of author information is available at the end of the article
Background
Myocardial infarction (MI) is one of the leading causes of death and disability worldwide. The effects of acute MI on left ventricular (LV) haemodynamics [1] and the prognostic importance of infarct size and LV ejection fraction (EF) following MI are well established [2]. Large infarcts are associated with an increased LV wall stress secondary to increased pre-load on the LV [3, 4]. This and subsequent adverse effects on LV afterload play a crucial role in infarct expansion and dilatation leading to adverse LV remodelling [5]. The assessment of LV haemodynamics and flow provides incremental prognos-tic evaluation in patients with MI [6]. Two-dimensional (2D) Doppler echocardiography is the mainstay for the non-invasive assessment of LV haemodynamics. How-ever, Doppler echocardiography provides unidirectional velocity information and does not inform about three-di-mensional intra-cavity flow [7].
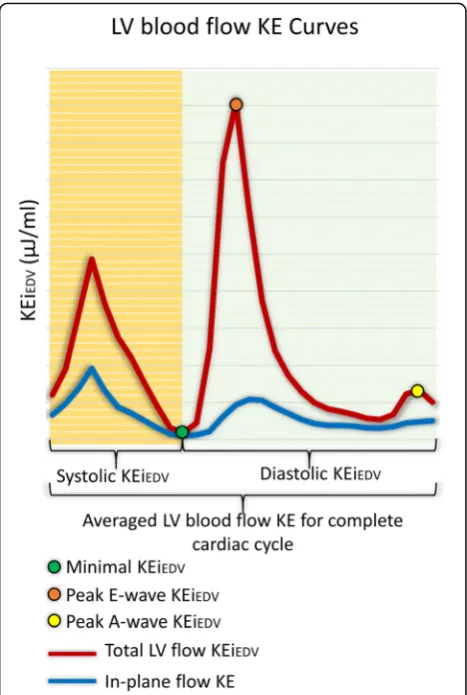
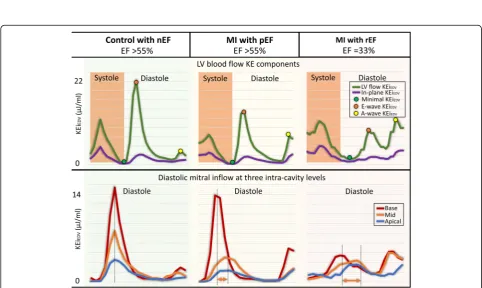
The kinetic energy (KE) of the blood represents a fun-damental component of work performed by the heart which results in the movement of the blood [8]. Four-dimensional flow (4D flow) cardiovascular mag-netic resonance (CMR) imaging allows semi-automatic quantification of intra-cavity LV flow KE parameters in three dimensions (3D) [9–15]. This further allows to compute several parameters of KE at different time points in the cardiac cycle (Fig.1). Previous studies have demonstrated LV systolic average KE is higher in pa-tients with heart failure compared to healthy controls, but lower when indexing to heart size [16]. Another study has shown that the KE of the portion of flow that passes directly through the LV in a single cardiac cycle or‘direct flow’diminishes with progressive LV dilatation [17]. Recently, Wong et al. demonstrated that in healthy individuals, early peak diastolic KE progressively de-creases with age, whereas systolic peaks remain constant [18]. The effects of MI on 3D LV blood flow KE have been described by Kanski et al. in a study which re-cruited MI patients as a sub-group [16]. However, more focused validation studies with larger MI patient popula-tion are needed to investigate if there is associapopula-tion of mechanical function, infarct characteristics and LV blood flow KE. It also remains unclear if significant dif-ferences in LV KE are seen in acute versus chronic MI.
Hence, the aims of this study were as follows: a) quantify dynamic parameters of LV blood flow KE in patients with acute and chronic MI and age and gen-der matched healthy controls; b) investigate the re-producibility of LV blood flow KE parameters; c) investigate if there are significant changes in LV blood flow KE in different sub-groups of left-ventricular ejection fraction; d) investigate the association of LV KE to infarct size and if LV KE is altered in acute versus chronic MI patients.
Methods Study population
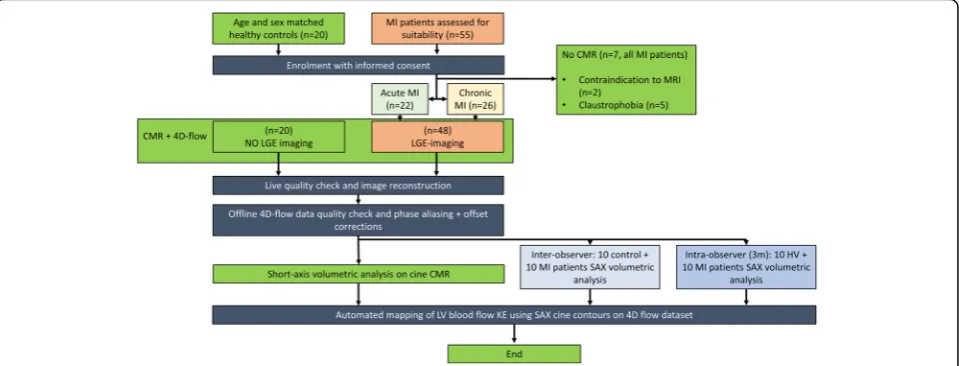
The study design is detailed in Fig. 2. Patients with acute MI patients were prospectively identified follow-ing an admission with ST-elevation myocardial infarc-tion (STEMI) at Leeds. Patients with chronic MI were prospectively identified from the cardiology outpatient clinics in Leeds. Age and gender matched healthy controls were prospectively recruited from two cen-tres: Leeds, UK and Leiden, The Netherlands.
The inclusion criteria for patients with acute MI were: patients with first time acute ST elevation MI (STEMI) treated by primary percutaneous coronary intervention (PPCI) within 12-h of onset of chest pain. Acute STEMI was defined as per the current international guidelines [19]. Acute STEMI patients were scheduled for CMR im-aging within 72-h of indexed presentation. The inclusion criteria for patients with chronic MI were: previous history of MI and the presence of ischaemic scar on late gadolin-ium enhancement (LGE) imaging. Exclusion criteria for all patients included: non-ischaemic cardiomyopathy, severe
[image:2.595.305.539.87.435.2]valvular heart disease, estimated glomerular filtration rate < 30 ml/min/1.73m2, haemodynamic instability (Killip class III/IV requiring on-going intravenous diuretic ther-apy [20]) and contraindications to CMR imaging.
Healthy control subjects had no history or symptoms of cardiovascular disease, were not on cardiovascular or other relevant medication and had no contraindications to CMR.
CMR examination
All healthy control subjects and patients underwent CMR imaging on identical 1.5 T systems at both sites (Ingenia, Philips Healthcare, Best, The Netherlands); with a 28-channel flexible torso coil and digitization of the CMR signal in the receiver coil.
CMR protocol and image acquisition The CMR protocol was as follows:
1. Survey images
2. The following cines were defined using survey: vertical long-axis, horizontal long-axis, 3-chamber (LVoutflow tract-views), and the LV volume con-tiguous short axis stack. All cines were acquired with a balanced steady-state free precession (bSSFP), single-slice breath-hold sequence. Typical parameters for bSSFP cine were as follows: SENSE factor 2, flip angle 60°, echo time (TE) 1.5 millisec-onds, repetition time (TR) 3 millisecmillisec-onds, field of view (FOV) 320–420 mm according to patient size, slice thickness 8 mm, and 30 phases per cardiac cycle.
3. Contrast injection (Magnevist: 0.2 mmol/kg) [only done in the patient population]
4. For whole heart 4D flow, field of view (FOV) was planned in trans-axial plane making sure whole heart was in FOV. 4D flow was done using fast field echo (FFE) pulse sequence (EPI based, 3D) with retrospective electrocardiogram (ECG)-triggering. The acquisition voxel size was kept as close as pos-sible to 3 × 3 × 3 mm3. FOV and number of slices (i.e., the 3D volume) was adapted to the subject’s size. Scan parameters: TE 3.5 ms, TR 10 ms, flip angle 10°, FOV 400 mm, number of signal averages 1. VENC 150 cm/sec. Acceleration was achieved by EPI factor 5. Free breathing was allowed, and no re-spiratory motion compensation was used. Number of slices was 40, temporal resolution used was 40 ms and the number of reconstructed phases was set to 30. EPI sequence is detailed in the Additional file1: Table S1 as previously validated [21].
5. Modified Look-Locker inversion recovery (MOLLI) to determine the T1-inversion time [only done in the patient population]
6. LGE imaging was done at 15-min from gadolinium-based contrast injection in MI patients only. LGE-imaging was done by phase sensitive inversion re-covery (PSIR) spoiled gradient echo (GE) sequence as per previous published methods [22,23]. PSIR sequence details are as follows: SENSE factor 1.7, typical TE/TR of 3.0/6.1 msec, flip angle of 25°, slice thickness of 10 mm and with Look-Locker scout determined T1-inversion time. [only done in the pa-tient population]
4D flow data reconstruction method
4D flow encoding was performed by standard 4-point encoding. Online/offline 4D flow data quality assu
[image:3.595.59.539.89.272.2]rance checks were done as per previous published lit-erature [21].
4D flow error corrections and quality checks
The effects of concomitant gradient terms were compen-sated using Maxwell correction methods by the CMR scanner. Remaining background errors were corrected by the local phase correction (LPC) filter on the CMR scan-ner performed in two-dimensional way- slice by slice. The LPC is a magnitude-weighted spatial low pass filter; pixels that are expected to be part of the static background are used with a higher weight than noisy background pixels or pixels that are expected to contain flow to determine the local phase offset. LPC uses surrounding tissue to deter-mine“static”areas [24,25].
All 3D phase contrast data sets were investigated for phase aliasing artefacts. If present then phase unwrap-ping was performed as per previously published guide-lines on phase-contrast methods [26]. Additionally, any spatial misalignment of 4D flow data to cine imaging was corrected before any flow analysis was performed. This was done by visualizing streamlines in 4-chamber view at peak systole and repositioning them over de-scending aorta. Similar checks were done during diastole in 4-chamber and 2-chamber views for peak mitral in-flow streamlines.
Image analysis
All images were analysed by PG (3-years-experience in ad-vanced CMR techniques, PG did the blinded tissue char-acterisation for infarct location and size for all MI cases), SC (1-year-experience in advanced CMR techniques, SC did the blinded volumetric assessment) and RVDG (> 5 years experience in advanced CMR techniques, RVDG did the blinded LV flow KE mapping). Images were evalu-ated offline using research software (MASS; Version 2016EXP, Leiden University Medical Center, Leiden, The Netherlands). LV volumes, stroke volume, cardiac index, EF and infarct location on LGE imaging were determined according to standard methods. Acute and chronic infarct size were determined by the full-width at half-maximum semi-automated technique [27].
The degree of LV systolic impairment was categorised as follows: normal EF in controls, normal LVEF. In patients with MI, preserved LVEF was≥55%, mildly impaired LVEF 45–54%, moderately impaired LVEF 35–44% and severely impaired LVEF < 35%" In patients with MI.
Kinetic energy mapping
For calculation of LV blood flow KE parameters, the LV volumetric mesh was resliced into short-axis sections of 2 mm thickness and pixel spacing equal to the original reconstructed pixel size of the short-axis cine acquisition (1.0–1.2 mm). This high-resolution LV mesh is construc
ted by representing the mesh in cylinder coordinates. The LV radius for a given angle and LV level is derived by linear interpolation. Correction for translational and rotational misalignment between the short-axis cine and the 4D Flow CMR acquisition was performed using au-tomated image registration as previously described [28].
For each volumetric element (voxel) the KE was com-puted as KE¼12 ρblood:Vvoxel:v2, with ρblood being the
density of blood (1.06 g/cm3), Vvoxel the voxel volume and vthe velocity magnitude. For each phase, the total KE within the LV was obtained by summation of the KE of every voxel. Time-resolved kinetic energy curves were generated to derive physiologically relevant parameters.
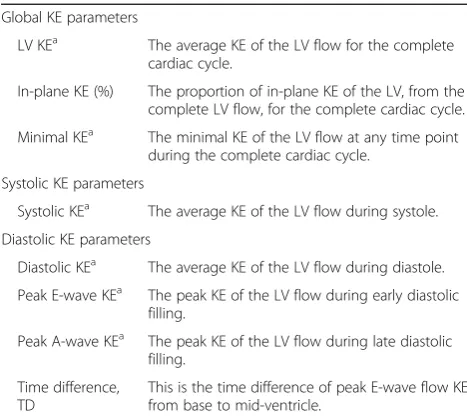
LV blood flow KE parameters which were derived for the complete cardiac cycle are described in Table1/Fig.1.
The novel KE parameters studied in this study are de-tailed below:
In-plane KE
[image:4.595.304.538.513.722.2]We define the in-plane KE as the sum of all kinetic en-ergy in the x-y direction, in the short-axis LV from base to apex. In this study, the in-plane KE is represented as a percentage of the total LV KE, this negates the issue with volume normalisation. Most of the blood flow in the LV should be in the through-plane direction– both in systole (towards aortic valve) and during diastole (to-wards apex from the mitral valve) and an increase in the proportion of in-plane flow may be associated with pathological flow. Hence, in this study, the in-plane KE
Table 1Description of all left ventricular (LV) kinetic energy (KE) flow parameters investigated in this study. In this study all primary KE parameters are indexed to LV end diastolic volume (EDV) and expressed as KEiEDV
Global KE parameters
LV KEa The average KE of the LV flow for the complete cardiac cycle.
In-plane KE (%) The proportion of in-plane KE of the LV, from the complete LV flow, for the complete cardiac cycle.
Minimal KEa The minimal KE of the LV flow at any time point during the complete cardiac cycle.
Systolic KE parameters
Systolic KEa The average KE of the LV flow during systole.
Diastolic KE parameters
Diastolic KEa The average KE of the LV flow during diastole.
Peak E-wave KEa The peak KE of the LV flow during early diastolic filling.
Peak A-wave KEa The peak KE of the LV flow during late diastolic filling.
Time difference, TD
This is the time difference of peak E-wave flow KE from base to mid-ventricle.
a
parameter was computed mainly to better understand the in-plane flow dynamics within the LV cavity.
Time difference (TD)
We also computed the time difference (TD) to peak early mitral inflow velocity (E-wave) from the base of the LV to mid-ventricle. This transit time or TD should be higher if the mitral valve propagation velocity (Vp), as measured by M-Mode echocardiography is lower [29]. Hence, the transit time of the peak KE from base to mid-ventricle, described as the TD in this study, may represent delayed filling.
Minimal KE
This parameter simply represents the minimal KE of the LV flow at any time point during the complete cardiac cycle. We computed this parameter mainly to under-stand how KE is preserved in health versus disease. The minimal KE of the LV is likely to be happen when the haemodynamic forces are minimal, and LV is not mov-ing. A rise in the minimal KE may be influenced by heterogenous haemodynamic forces described in the LV fluid dynamics model secondary to dyssynchronous or late systolic contractility seen in infarcted segments [30].
To allow comparison between patients and healthy subjects, all KE parameters were normalized to the LV end-diastolic volume (EDV) and accordingly reported in μJ/ml. In sub-analysis, we also normalised the KE pa-rameters to the stroke volume to develop insight into KE spent per unit of stroke volume.
Intra-/inter-observer variability
For inter-observer variability, SC and RVDG contoured the short-axis LV cine volumetric stack in 10 ran-dom healthy control subjects and 10 ranran-dom MI patients, blinded to each other’s analysis. Automated KE parame-ters were again generated using the endocardial contours from second observer. For intra-observer variability, SC re-analysed the LV short-axis cines for the same 10 healthy control subjects and 10 MI patients MI after 3 months. Akin to inter-observer variability, automated KE parameters were generated using the new endocar-dial contours by the same observer using the time-resolved methods previously described [31].
Statistical analysis
Statistical analysis was performed using SPSS® Statistics 21.0 (International Business Machines, Armonk, New York, USA). Continuous measurements are presented as mean ± standard deviation. Quantitative flow imaging pa-rameters expected to be non-parametric were presented as median and inter-quartile ranges (IQR). Demographic comparisons were performed with an independent sam-ples t-test. Comparisons between two groups with
non-parametric data were made using Mann–Whitney U test. Intra−/inter-observer reliability tests were done by inter-class correlation coefficient. In different categories of LVEF, post hoc analysis was done by Kruskal-Wallis H test. Association of infarct size to KE parameters was done by Spearman’s rank correlation coefficient test. In multi-variate analysis, a forward-conditional method was used for regression and parameters with statistical significance from one-way analysis (p< 0.05) were chosen for multi-variate analysis. A p-value < 0.05 was considered statistically significant.
Results
Demographic characteristics
Of the 55 patients with acute and chronic MI patients initially identified and recruited, 48 patients completed the full study protocol (Fig. 2). Controls and patients were matched for age, (52 ± 11 years versus 57 ± 11 years,
P= 0.1), gender and body surface area (Table2).
Baseline CMR data
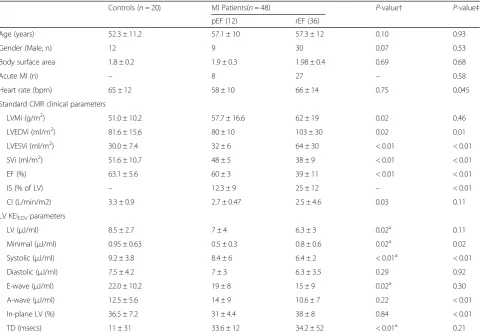
Heart rate was comparable between MI patients and healthy controls (65 ± 12 bpm versus 64 ± 13 bpm, P= 0.75). Most baseline volumetric CMR parameters were significantly higher in MI patients than healthy controls (Table2). Infarct size was similar among patients with acute and chronic MI (24.3 ± 14% vs. 19.6 ± 11%, P= 0.21). The majority of pa-tients had anterior MI (n= 35) versus inferior/posterior MI (n= 13). The 4D flow CMR acquisition time was 8 ± 2 min.
Global LV flow KE in MI
Average LV flow KEiEDVwas significantly higher in healthy
controls than in MI patients (8.5 ± 3 μJ/ml versus 6.5 ± 3μJ/ml,P= 0.02) (Table2) (Fig.3). Similarly, LV flow min-imal KEiEDVwas significantly lower in patients. The
pro-portion of in-plane KE was not significantly different in healthy controls and MI patients. Diastolic peak E-wave KEiEDVwas significantly lower in MI patients compared
to the healthy controls (P< 0.05). Time differences to peak E-wave KEiEDV were significantly higher in MI patients
compared to healthy controls (11 ± 31msecs versus 34 ± 29msecs,P< 0.01) (Fig.4).
In logistic regression analysis of all the significantly different KEiEDVparameters in MI patients (Table2), LV
blood flow systolic KEiEDV demonstrated the strongest
association with the presence of MI (Beta =−0.24, standard error = 0.08,P< 0.01).
Association with cardiac haemodynamic parameters Kinetic energy parameters that were significantly associ-ated with heart rate included the following: LV, minimal and diastolic KEiEDV (P< 0.05) (Table 3). For these
Kinetic energy parameters that were significantly associ-ated with stroke volume included the following: systolic and E-wave KEiEDV, the proportion of in-plane KE and TD (P<
0.05) (Table 3). In sub-group analysis, we did not identify significant association between stroke volume and systolic KEiEDVin the controls (R= 0.31,P= 0.17). This association
was mainly driven by variation of stroke volume in the MI cohort (R= 0.39,P< 0.01). However, KE parameters associ-ated with cardiac index included the following: LV, systolic, diastolic, E-wave KEiEDVand in-plane KE (P< 0.05).
LV systolic impairment and flow KE
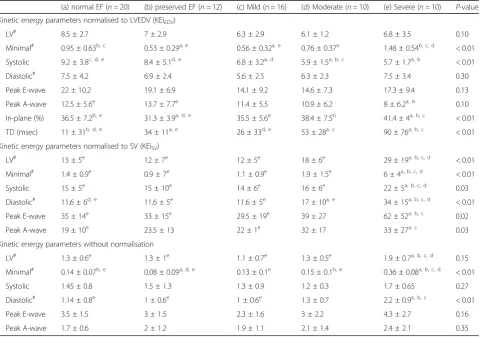
Comparison of LV flow KE parameters (raw, normal-ised to end-diastolic volume and normalnormal-ised to stroke volume) with the degree of LV systolic impair-ment are detailed in Table 4. Several LV flow KEiEDV
parameters demonstrated significant differences be-tween groups of patients, defined by the degree of
LV systolic impairment (P-value< 0.05). These in-cluded: minimal, systolic, in-plane KEiEDV parameters
and TD to peak E-wave KE propagation. The propor-tion of in-plane KE and minimal KEiEDV parameters
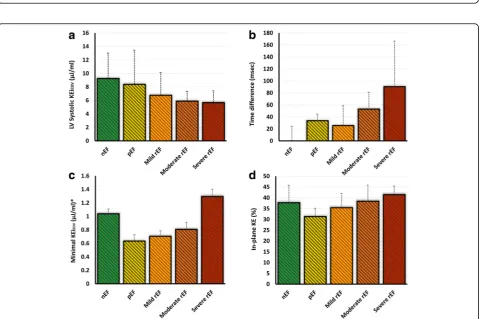
were significantly reduced inpreservedpEF patients when compared to normal EF healthy controls but were increased compared with controls in patients with worsening EF (Figs. 5, 6c and d). In exploratory analysis, there was a modest association between the proportion of in-plane KE and minimal KEiEDV
pa-rameters (R= 0.35, P< 0.01). The systolic KEiEDV
de-creased significantly with worsening EF (Fig. 6a). TD to peak E-wave KE propagation demonstrated a lin-ear increasing trend with worsening EF (P< 0.01).
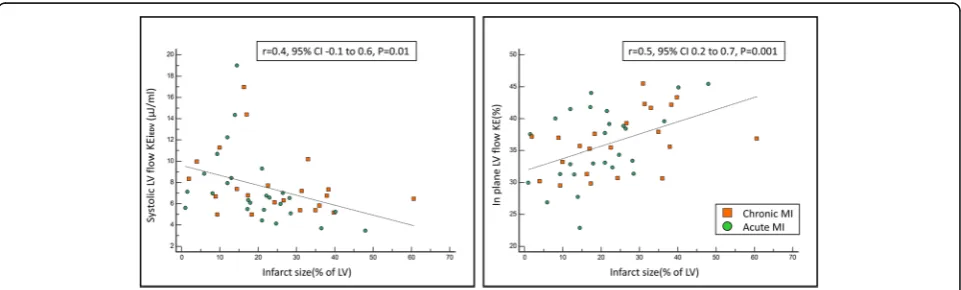
Infarct size and flow KE
[image:6.595.58.543.98.432.2]Infarct size was significantly associated with minimal, systolic and peak A-wave KEiEDV, in-plane KE and the Table 2Demographics and CMR parameters in healthy controls versus MI patients
Controls (n= 20) MI Patients(n= 48) P-value† P-value‡
pEF (12) rEF (36)
Age (years) 52.3 ± 11.2 57.1 ± 10 57.3 ± 12 0.10 0.93
Gender (Male, n) 12 9 30 0.07 0.53
Body surface area 1.8 ± 0.2 1.9 ± 0.3 1.98 ± 0.4 0.69 0.68
Acute MI (n) – 8 27 – 0.58
Heart rate (bpm) 65 ± 12 58 ± 10 66 ± 14 0.75 0.045
Standard CMR clinical parameters
LVMi (g/m2) 51.0 ± 10.2 57.7 ± 16.6 62 ± 19 0.02 0.46
LVEDVi (ml/m2) 81.6 ± 15.6 80 ± 10 103 ± 30 0.02 0.01
LVESVi (ml/m2) 30.0 ± 7.4 32 ± 6 64 ± 30 < 0.01 < 0.01
SVi (ml/m2) 51.6 ± 10.7 48 ± 5 38 ± 9 < 0.01 < 0.01
EF (%) 63.1 ± 5.6 60 ± 3 39 ± 11 < 0.01 < 0.01
IS (% of LV) – 12.3 ± 9 25 ± 12 – < 0.01
CI (L/min/m2) 3.3 ± 0.9 2.7 ± 0.47 2.5 ± 4.6 0.03 0.11
LV KEiEDVparameters
LV (μJ/ml) 8.5 ± 2.7 7 ± 4 6.3 ± 3 0.02a 0.11
Minimal (μJ/ml) 0.95 ± 0.63 0.5 ± 0.3 0.8 ± 0.6 0.02a 0.02
Systolic (μJ/ml) 9.2 ± 3.8 8.4 ± 6 6.4 ± 2 < 0.01a < 0.01
Diastolic (μJ/ml) 7.5 ± 4.2 7 ± 3 6.3 ± 3.5 0.29 0.92
E-wave (μJ/ml) 22.0 ± 10.2 19 ± 8 15 ± 9 0.02a 0.30
A-wave (μJ/ml) 12.5 ± 5.6 14 ± 9 10.6 ± 7 0.22 < 0.01
In-plane LV (%) 36.5 ± 7.2 31 ± 4.4 38 ± 8 0.84 < 0.01
TD (msecs) 11 ± 31 33.6 ± 12 34.2 ± 52 < 0.01a 0.21
Data is presented as mean ± standard deviation (SD) or count (n) for demographics and standard CMR parameters and median ± inter-quartile range (IQR) for KE parameters. LV measurements are indexed to body surface area
All KE values are indexed for LV end-diastolic volume
LVEDViLeft ventricular end diastolic volume (indexed),LVESViLeft ventricular end systolic volume (indexed),LVMileft ventricular mass (indexed),MVmitral valve,
SVistroke volume (indexed) a
Fig. 3Left ventricular (LV) blood flow KE mapping. The short-axis whole LV blood flow KE maps represented here are during peak systole. The KE of blood flow in the out-flow tract is higher in the control versus the myocardial infarction (MI) patient
[image:7.595.57.540.86.315.2] [image:7.595.56.539.385.673.2]TD for peak E-wave KE (Table5). Infarct size was nega-tively associated with systolic KEiEDV (rho =−48, P=
0.01) and positively associated with the proportion of in-plane KE (rho = 0.5, P= 0.001) (Fig. 7). TD of peak E-wave KE propagation had a modest positive association
with MI size (rho = 0.33,P= 0.02). In multiple regression analysis, in-plane KE was independently associated with infarct size (Beta = 1.1,P= 0.001) (Table5).
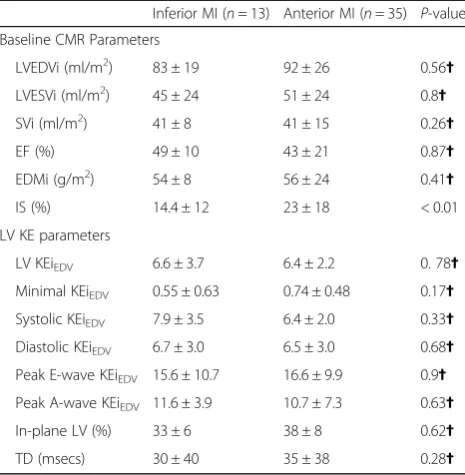
Anterior versus inferior/posterior infarction
Thirty-five patients (73%) had anterior MI and 13 (27%) had inferior/posterior MI. CMR baseline parameters were similar in both infarct locations (Table 6). Infarct size was significantly larger in patients with anterior MI (14.4 ± 12% vs 23 ± 18%;P< 0.01). Controlling for infarct size, no significant differences were noted for the base-line CMR parameters and the different parameters of KEiEDVbetween anterior and inferior/posterior MI.
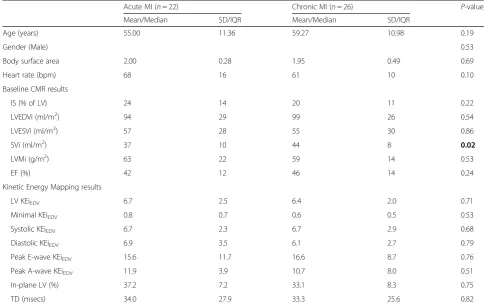
Acute versus chronic MI
Baseline demographics were comparable between pa-tients with either acute or chronic MI (Table 7). From the baseline CMR parameters, only stroke volume was significantly higher in chronic MI versus acute (37 ± 10 ml/m2 versus 44 ± 8 ml/m2, P-value = 0.02). KEiEDV
[image:8.595.57.291.109.249.2]parameters and LV EF were comparable in both groups.
Table 3Association of LV kinetic energy parameters to LV haemodynamic parameters
KE parameters Heart rate Stroke volume Cardiac index
rho P-Value rho P-Value rho P-Value
LV KEiEDV(μJ/ml) 0.31 0.01 0.20 0.11 0.42 < 0.01
Minimal KEiEDV(μJ/ml) 0.43 < 0.01 −0.07 0.58 0.06 0.64
Systolic KEiEDV(μJ/ml) 0.05 0.70 0.45 < 0.01 0.48 < 0.01
Diastolic KEiEDV(μJ/ml) 0.35 < 0.01 0.03 0.83 0.28 0.02
E-wave KEiEDV(μJ/ml) 0.02 0.90 0.31 0.01 0.30 0.01
A-wave KEiEDV(μJ/ml) 0.14 0.24 −0.01 0.92 0.24 0.05
In-plane LV (%) 0.06 0.63 −0.28 0.02 −0.29 0.02
TD (msecs) 0.09 0.45 −0.31 0.01 −0.23 0.06
Bold text = significantP-values
KEkinetic energy,LVleft ventricle,RhoSpearman rank correlation coefficient
Table 4Post-hoc analysis of several LV KE flow parameters in different LV function sub-groups
(a) normal EF (n= 20) (b) preserved EF (n= 12) (c) Mild (n= 16) (d) Moderate (n= 10) (e) Severe (n= 10) P-value
Kinetic energy parameters normalised to LVEDV (KEiEDV)
LV# 8.5 ± 2.7 7 ± 2.9 6.3 ± 2.9 6.1 ± 1.2 6.8 ± 3.5 0.10
Minimal# 0.95 ± 0.63b, c 0.53 ± 0.29a, e 0.56 ± 0.32a, e 0.76 ± 0.37e 1.48 ± 0.54b, c, d < 0.01
Systolic 9.2 ± 3.8c, d, e 8.4 ± 5.1d, e 6.8 ± 3.2a, d 5.9 ± 1.5a, b, c 5.7 ± 1.7a, b < 0.01
Diastolic# 7.5 ± 4.2 6.9 ± 2.4 5.6 ± 2.5 6.3 ± 2.3 7.5 ± 3.4 0.30
Peak E-wave 22 ± 10.2 19.1 ± 6.9 14.1 ± 9.2 14.6 ± 7.3 17.3 ± 9.4 0.13
Peak A-wave 12.5 ± 5.6e 13.7 ± 7.7e 11.4 ± 5.5 10.9 ± 6.2 8 ± 6.2a, b 0.10
In-plane (%) 36.5 ± 7.2b, e 31.3 ± 3.9a, d, e 35.5 ± 5.6e 38.4 ± 7.5b 41.4 ± 4a, b, c < 0.01
TD (msec) 11 ± 31b, d, e 34 ± 11a, e 26 ± 33d, e 53 ± 28a, c 90 ± 76a, b, c < 0.01
Kinetic energy parameters normalised to SV (KEiSV)
LV# 13 ± 5e 12 ± 7e 12 ± 5e 18 ± 6e 29 ± 19a, b, c, d < 0.01
Minimal# 1.4 ± 0.9e 0.9 ± 7e 1.1 ± 0.9e 1.9 ± 1.5e 6 ± 4a, b, c, d < 0.01
Systolic 15 ± 5e 15 ± 10e 14 ± 6e 16 ± 6e 22 ± 5a, b, c, d 0.03
Diastolic# 11.6 ± 6d, e 11.6 ± 5e 11.6 ± 5e 17 ± 10a, e 34 ± 15a, b, c, d < 0.01
Peak E-wave 35 ± 14e 33 ± 15e 29.5 ± 19e 39 ± 27 62 ± 52a, b, c 0.02
Peak A-wave 19 ± 10e 23.5 ± 13 22 ± 1e 32 ± 17 33 ± 27a, c 0.03
Kinetic energy parameters without normalisation
LV# 1.3 ± 0.6e 1.3 ± 1e 1.1 ± 0.7e 1.3 ± 0.5e 1.9 ± 0.7a, b, c, d 0.15
Minimal# 0.14 ± 0.07b, e 0.08 ± 0.09a, d, e 0.13 ± 0.1e 0.15 ± 0.1b, e 0.36 ± 0.08a, b, c, d < 0.01
Systolic 1.45 ± 0.8 1.5 ± 1.3 1.3 ± 0.9 1.2 ± 0.3 1.7 ± 0.65 0.27
Diastolic# 1.14 ± 0.8e 1 ± 0.6e 1 ± 0.6e 1.3 ± 0.7 2.2 ± 0.9a, b, c < 0.01
Peak E-wave 3.5 ± 1.5 3 ± 1.5 2.3 ± 1.6 3 ± 2.2 4.3 ± 2.7 0.16
Peak A-wave 1.7 ± 0.6 2 ± 1.2 1.9 ± 1.1 2.1 ± 1.4 2.4 ± 2.1 0.35
All data is represented as median ± inter-quartile range. Significant differences within groups represented as superscript
nEFnormal ejection fraction in controls with no MI,pEFMI patients with preserved ejection fraction,LVleft ventricle,TDtime difference of peak E-wave KE propagation from base to mid-ventricle
#
[image:8.595.59.540.362.700.2]Fig. 5In-plane velocity streamlines in two case examples from the study demonstrating higher in-plane (xy-axis) flow during diastasis in a patient with myocardial infarction and worse EF (Panelb) versus an MI patient with a smaller infarct and preserved LVEF (Panela). The in-plane KE was computed as the sum of all KE in the x-y direction, in the short-axis left ventricle from base to apex. It is represented as a percentage of the total LV KE. KE = kinetic energy and EF = ejection fraction
[image:9.595.57.540.88.329.2] [image:9.595.59.540.364.683.2]Kinetic energy of blood flow per stroke volume
All KEiSV parameters (LV, minimal, systolic, diastolic,
E-wave and A-wave) demonstrated significant rise be-tween different groups of EF (P< 0.05) (Table 4). We noted that rise in KE in diastole per stroke volume over took systolic KE per stroke volume from the moderately impaired LV group. Hence, in moderately and severely impaired LV, there is more KE per stroke volume in dia-stole than sydia-stole (Fig.8).
Intra-observer and inter-observer variability
Intra-observer and inter-observer variability results for global KE parameters are detailed in the online Additional file1: Table S2. In summary, all global KE pa-rameters demonstrated excellent intra-class correlation coefficient (ICC) (average 0.99, P-value> 0.9). In addition, the mean bias (%) for all KEiEDV parameters
was 2 ± 9% for intra-observer tests and 3 ± 9% for inter-observer tests. TD to peak E-wave flow KE also demonstrated very high intra-class correlation coefficient (ICC = 0.94, 95% CI 0.88 to 0.97).
Discussion
In this study, we mapped different parameters of LV blood flow KE in MI patients and matched healthy control sub-jects. We found that the majority of LV blood flow KEiEDV
parameters are reduced in patients with MI. In addition, decrease in systolic KEiEDVof the LV blood flow is
inde-pendently associated with the presence of MI and the pro-portion of in-plane KE of the LV blood flow is independently associated with the infarct size. Another important finding of this study was that worsening degree of LV systolic function is associated TD of peak E-wave KE propagation. MI patients with preserved EF have sig-nificantly reduced minimal KEiEDV, the proportion of
[image:10.595.55.542.99.238.2]in-plane KE and increased TD of peak E-wave KE propa-gation when compared with healthy controls with nEF. Kinetic energy per stroke volume revealed higher systolic KE versus diastolic KE in normal EF, preserved EF and mildly reduced EF groups. However, patients with moder-ate and severely reduced EF demonstrmoder-ated reversal and had higher diastolic KE per stroke volume than systolic KE. Finally, global LV blood flow KE parameters demon-strated good intra−/inter-observer variability.
Table 5LV flow KEiEDVparameters and their association to the infarct size in patients with MI
Univariate Multivariate
rho Beta 95% CI SE P-value Beta 95% CI SE P-value
LV KEiEDV −0.29 −1.4 −3 to 2 0.8 0.09
Minimal KEiEDV 0.26 0.01 0 to 0.2 0.005 0.04
Systolic KEiEDV −0.48 −0.1 −0.2 to−0.02 0.03 0.01
Diastolic KEiEDV −0.07 −0.02 −0.07 to 0.04 0.03 0.59
Peak E-wave KEiEDV −0.24 −0.14 −0.3 to 0.03 0.08 0.09
Peak A-wave KEiEDV −0.37 −0.14 −0.2 to−0.02 0.05 0.02
In-plane LV (%) 0.5 1.1 0.5 to 1.7 0.3 0.001 1.1 0.5 to 1.7 0.3 0.001
TD (msec) 0.33 1.1 0.2 to 2 0.4 0.02
BoldP-values were selected for multivariate analysis
CIconfidence interval,LVleft ventricle,SEstandard error,rhoSpearman’s rank correlation coefficient
[image:10.595.58.539.559.704.2]Global LV flow KE in MI
In the present study, the global LV flow KEiEDV, which in
essence is the global density of the velocity profile of intra-cavity blood flow, was significantly lower in pa-tients with MI than controls. This is in keeping with re-sults by Kanski et al., who found reduced indexed LV KE in patients with moderate-to-severe heart failure versus controls. (6.3 ± 2.2 μJ/ml vs 8.0 ± 2.1 μJ/ml, p= 0.025) [16]. Even though the diastolic parameter of LV KE was not significantly different in MI patients, the peak E-wave KE was significantly lower in MI patients. This would be consistent with early pre-clinical studies that have demonstrated that any condition that interferes with normal regional systolic function is expected to modify the pattern of the normal early diastolic intra-ventricular pressure gradients. The present study also showed that the presence of MI is most strongly associ-ated with systolic KEiEDVof LV blood flow. As a
conse-quence of MI and regional hypo-contractility, there is reduced regional systolic mechanical force imparted on the intra-cavity blood consequently due to lowered pres-sure gradient between the LV and the aorta, the overall thrust of systolic blood flow is reduced as demonstrated by drop in the systolic blood flow energetics. This is also supported by the finding that LV stroke volume was only
associated to systolic KEiEDV in MI cohort and not in
the controls.
Delayed filling of the LV
During diastolic filling of the LV in health, we already know through M-mode Doppler echocardiography that blood flow into the LV cavity from base to apex happens very fast with a mitral valve flow propagation velocity (Vp) of above 50 cm/sec [32]. Even though in this study we did not measure the Vp, we measured the transit time (or TD in this study) for the peak E-wave to travel from base to mid-ventricle and hence, it is plausible to conclude that if the Vp will decrease, the time delay for the peak inflow will increase. Accordingly, we observed an increase in the time differences for peak E-wave KE propagation in MI patients compared with controls. This delay reflects restrictive LV filling and possible normal-isation of intra-ventricular pressure gradients. Intra-ventricular pressure gradients represent a suction force and have been attributed to energy consuming, ac-tive LV relaxation [33, 34]. The significant increase in TDs in patients with MI and preserved EF versus con-trols with normal EF demonstrates that restrictive filling precedes any detectable systolic impairment. The TDs measured in this study offer physiological insight similar to mitral valve propagation velocity on echocardiog-raphy. Compared with mitral valve propagation velocity, the TDs measured here are semi-automatically com-puted and have low intra−/inter-observer variability. From the clinical perspective, this parameter may offer semi-automated and possible reliable assessment of the degree of LV diastolic impairment and the LV filling pressures. The reliability and the prognostic implications of using TD as a bio-imaging marker needs to be further tested in future studies.
Association of LV flow KE to the degree of systolic impairment
The patterns of changes between these LV flow KE pa-rameters to the degree of LV systolic impairment were different. The systolic KEiEDVhad a more linear trend to
decrease with worsening EF. Decreased LV contractile function leads to impaired emptying and increased pre-load in subsequent cycles. Even if this causes stroke vol-umes to return to normal due to the Frank-Starling mechanism, the increased ventricular dimensions will cause the KEiEDVto decrease.
The TDs for peak E-wave KE propagation demon-strated a more linear trend to increase with worsening EF. The minimal KEiEDVand the proportion of in-plane
[image:11.595.57.290.110.348.2]KE significantly reduced from normal EF in healthy con-trols to MI patients with preserved EF and then had a strong trend to increase with decreasing EF – a finding that at first seems paradoxical.
Table 6Kinetic energy distribution in patients with anterior and inferior infarcts. Units for all KE parameters areμJ/ml
Inferior MI (n= 13) Anterior MI (n= 35) P-value
Baseline CMR Parameters
LVEDVi (ml/m2) 83 ± 19 92 ± 26 0.56✝
LVESVi (ml/m2) 45 ± 24 51 ± 24 0.8✝
SVi (ml/m2) 41 ± 8 41 ± 15 0.26✝
EF (%) 49 ± 10 43 ± 21 0.87✝
EDMi (g/m2) 54 ± 8 56 ± 24 0.41✝
IS (%) 14.4 ± 12 23 ± 18 < 0.01
LV KE parameters
LV KEiEDV 6.6 ± 3.7 6.4 ± 2.2 0. 78✝
Minimal KEiEDV 0.55 ± 0.63 0.74 ± 0.48 0.17✝
Systolic KEiEDV 7.9 ± 3.5 6.4 ± 2.0 0.33✝
Diastolic KEiEDV 6.7 ± 3.0 6.5 ± 3.0 0.68✝
Peak E-wave KEiEDV 15.6 ± 10.7 16.6 ± 9.9 0.9✝
Peak A-wave KEiEDV 11.6 ± 3.9 10.7 ± 7.3 0.63✝
In-plane LV (%) 33 ± 6 38 ± 8 0.62✝
TD (msecs) 30 ± 40 35 ± 38 0.28✝
All data is represented as median ± inter-quartile range
EFleft ventricular ejection fraction,ISinfarct size,LVleft ventricle,LVEDViLeft ventricular end diastolic volume (indexed),LVESViLeft ventricular end systolic volume (indexed),LVMileft ventricular mass (indexed),MRmitral regurgitation,
SVistroke volume (indexed),TDtime difference of peak E-wave KE propagation from base to mid-ventricle
We speculate that the in-plane KE of LV flow is made up of several in-plane blood flow movements during the complete cardiac cycle. These include: the physiological systolic in-plane movement of blood towards the out-flow track during LV contraction, in-plane out-flow within the vortex in early and late diastolic filling. The systolic and vortex associated in-plane flow are plausibly de-creased in MI patients with preserved EF as they have subtle mechanical dysfunction with preserved LV vol-umes. This finding would be consistent with other stud-ies demonstrating alterations in diastolic inflow vortex strength in heart failure patients with preserved EF (HFpEF) [35]. However, progressive LV impairment and dilatation also causes increased sphericity, which will in turn change flow conditions inside the cavity to a ‘meta-stable’state with a large, swirling vortex which en-compasses the majority of the LV [36]. This vortex flow includes transversal thrusts which will show up as in-plane KE and become increasingly prominent as the ventricle remodels further. In addition, given the fact our reference spatial plane is the atrioventricular valve,
the angular differences between the inflow and outflow direction which follows from the non-parallel orienta-tion of the left atrium and aorta may result in significant outflow in-plane component.
As the pattern of changes to the degree of LV impairment was similar for in-plane KE and minimal KEiEDV, we
specu-late that the rise in the proportion of in-plane KE with wors-ening EF is associated with an increase in minimal KEiEDV.
This is possibly explained by the fact that progressive LV im-pairment leads to LV dilatation and reduced filling of the LV causing an overall increase in the in-plane flow, which re-sults in higher minimal KEiEDVfor the LV. This observation
[image:12.595.54.544.99.405.2]is further supported by the analysis of the KE parameters per stroke volume which demonstrate the all blood flow KE parameters rise significantly for each stroke volume with the degree of LV impairment. In addition, once the degree of LV impairment reaches the moderate zone, the systolic KE per stroke volume becomes lesser than the diastolic KE per stroke volume. This perhaps reflect the loss of mechanical push by LV in systole combined with restrictive early filling in diastole associated with high velocities.
Table 7Comparison of study results in acute versus chronic myocardial infarction
Acute MI (n= 22) Chronic MI (n= 26) P-value
Mean/Median SD/IQR Mean/Median SD/IQR
Age (years) 55.00 11.36 59.27 10.98 0.19
Gender (Male) 0.53
Body surface area 2.00 0.28 1.95 0.49 0.69
Heart rate (bpm) 68 16 61 10 0.10
Baseline CMR results
IS (% of LV) 24 14 20 11 0.22
LVEDVi (ml/m2) 94 29 99 26 0.54
LVESVi (ml/m2) 57 28 55 30 0.86
SVi (ml/m2) 37 10 44 8 0.02
LVMi (g/m2) 63 22 59 14 0.53
EF (%) 42 12 46 14 0.24
Kinetic Energy Mapping results
LV KEiEDV 6.7 2.5 6.4 2.0 0.71
Minimal KEiEDV 0.8 0.7 0.6 0.5 0.53
Systolic KEiEDV 6.7 2.3 6.7 2.9 0.68
Diastolic KEiEDV 6.9 3.5 6.1 2.7 0.79
Peak E-wave KEiEDV 15.6 11.7 16.6 8.7 0.76
Peak A-wave KEiEDV 11.9 3.9 10.7 8.0 0.51
In-plane LV (%) 37.2 7.2 33.1 8.3 0.75
TD (msecs) 34.0 27.9 33.3 25.6 0.82
Data is presented as mean ± standard deviation (SD) or count (n) for demographics and standard CMR parameters and median ± inter-quartile range (IQR) for KE parameters. LV measurements are indexed to body surface area
All KE values are indexed for LV end-diastolic volume. Units for all KE parameters areμJ/ml
LVEDViLeft ventricular end diastolic volume (indexed),LVESViLeft ventricular end systolic volume (indexed),LVMileft ventricular mass (indexed),MVmitral valve,
Infarct characteristics and LV flow KE
Results from our study show that an increase in infarct size increases the in-plane KE of LV blood flow. Such pathological rise in the in-plane KE may exert hete rogenous haemodynamic forces on the LV wall, possibly contributing to more dilatation and increase in endothe-lial dysfunction in the endocardium [37–40].
In our study, anterior infarcts were significantly larger than inferior infarcts. When adjusted for MI size, MI loca-tion (anterior versus inferior) was not significantly associated with LV function or blood flow KE parameters. In a previous study done by Kanski et al., in sub-group of patients with MI, multiple stepwise linear regression analysis, averaged LV KE was associated with LV end-diastolic volume and not IS. Similarly, in this study averaged LV KEiEDVwas not
associ-ated with IS (P= 0.09), however, in regression, the in-plane demonstrated independent association to the IS. This would indicate that some components of LV blood flow energetics are more influenced by infarct size than others and its asso-ciated mechanical dysfunction than its location.
Future clinical applications
We have demonstrated that using 4D flow that it is pos-sible to detect subtle changes in cardiac function after MI
even in patients with preserved EF. Longitudinal prospect-ive studies are needed to establish whether LV flow KE has incremental prognostic impact over established markers such as EF, scar burden and microvascular ob-struction. Studies are also needed to establish whether changes in intra-cardiac flow can be altered by medical therapy. After MI, LV remodelling leads to progressive LV cavity dilatation and subsequent heart failure. Using 4D flow it will be possible to investigate these mechanisms and assess the impact of existing and potentially novel pharmacological interventions on these processes.
To compute LV blood flow KE parameters, time-resolved LV volumetric endocardial contours are used [31]. Hence, the main influence on LV energetics variation is mainly sec-ondary to endocardial contour delineation. If this is done consistently and methodically for the complete cardiac cycle as in this study and previous published literature, it results in not only highly reproducible LV volumetric as-sessment but also LV blood flow energetics.
Study limitations
Respiratory navigation was omitted for the 4D flow ac-quisition which could have influenced KE parameters. However, whole-heart 4D flow head-to-head comparison
[image:13.595.58.537.87.395.2]studies have also demonstrated that non-respiratory nav-igated acquisition of 4D flow is comparable to respira-tory navigated acquisition for intra-cardiac KE quan tification [41]. In addition, a recent study validated a non-respiratory navigated 4D Flow EPI acceleration se-quence for clinical use [21]. The temporal resolution of the 4D flow was 40 ms, which may affect the quality of KE and TD assessment. MI patients were prescribed 4D flow post contrast versus healthy controls who didn’t re-ceive any contrast. Post contrast 4D flow improves the signal-noise-ratio and may have introduced some bias when comparing controls versus patients. This study used the start of the cardiac cycle as defined by the scan-ner’s electrocardiogram to calculate TDs. Scanner’s elec-trocardiogram is not always correct, and this may result in less precise TD estimates. We used The LV geometry was defined by LV cine stack which was done using breath-hold technique while the 4D flow was done using free breathing. Hence, although spatial miss-registration was corrected for, other issues still remain including dif-ference in heart rate and physiological conditions. This may have impact on the time-varying flow characteristics which could not be corrected for. Results from this study cannot be applied to patients with significant val-vulopathy, cardiomyopathies and congenital heart disease.
Conclusions
Post MI, reduction in LV function results in reduction in LV blood flow KE and is most strongly associated with the systolic LV blood flow KE. Increase in infarct size re-sults in proportionate increase in the in-plane KE of LV blood flow. Degree of LV impairment is associated with TD of peak E-wave KE. Even in patient with preserved EF post MI, LV blood flow KE mapping demonstrated significant changes in the in-plane KE, the minimal KEiEDVand the TD. Further longitudinal studies are
war-ranted to investigate the long-term clinical significance of mapping LV blood flow KE parameters.
Additional file
Additional file 1:Supplementary Material. (DOCX 30 kb)
Abbreviations
2D:Two-dimensional; 3D: Three-dimensional; 4D: Four-dimensional; bSSFP: Balanced steady state free precession; CMR: Cardiovascular magnetic resonance; ECG: Electrocardiogram; EF: Ejection fraction; EPI: Echo-planar Imaging acceleration; FOV: Field of view; GE: Gradient echo; HFpEF: Heart failure with preserved ejection fraction; ICC: Intra-class correlation coefficient; IQR: Inter-quartile range; KE: Kinetic energy; LGE: Late gadolinium
enhancement; LPC: Local phase correction; LV: Left ventricle/left ventricular; MI : Myocardial infarction; MOLLI: Modified Look Locker inversion recovery; PPCI: Primary percutaneous coronary intervention; PSIR: Phase sensitive inversion recovery; STEMI: ST-elevation myocardial infarction; TD: Time difference; TE: Echo time; TR: Repetition time; VP: Propagation velocity
Acknowledgements
We thank Gavin Bainbridge, Caroline Richmond, Margaret Saysell and Petra Bijsterveld for their assistance in recruiting and collecting data for this study. Dr. Hakan Arheden served as aJCMRGuest Editor for this manuscript.
Funding
This work was supported by the British Heart Foundation [FS/10/62/28409 to S.P.] and Dutch ZonMw [Project Number: 104003001 to J.W].
Availability of data and materials
The datasets used and/or analysed during the current study are available from the corresponding author on reasonable request.
Authors’contributions
PG was involved in recruitment, CMR analysis, statistics and drafted the initial study manuscript. SV assisted in the recruitment and design of study. JJMW, MSME, MB, RN and SP developed the CMR protocol for the study. LAEB, PPS, JRJF, GJF, PGC and MECJH were major contributors in writing the manuscript and provided cross-cover for the study. SC did significant segmentation for the CMR studies and provided administrative support. RJvG contributed sub-stantially in smooth running of the core lab at Leiden (LUMC) and analysis. AAM provided critical insight into heart failure associated mechanisms and how KE may provide mechanistic insight. RN, JPG, provided critical senior re-view of the final drafted manuscript. EDA and SP provided overall supervision for the study. All authors read and approved the final manuscript and agreed to be accountable for all aspects of the work.
Ethics approval and consent to participate
The study protocol was approved by the National Research Ethics Service (12/YH/0169) in the UK and the institutional Medical Ethical Committee (P11.136) in Leiden. The study complied with the Declaration of Helsinki and all controls and patients gave written informed consent.
Consent for publication
All patients gave written informed consent before randomization.
Competing interests
The authors declare that they have no competing interests.
Publisher’s Note
Springer Nature remains neutral with regard to jurisdictional claims in published maps and institutional affiliations.
Author details
1Leeds Institute of Cardiovascular and Metabolic Medicine (LICAMM), University of
Leeds, Leeds LS2 9JT, UK.2Department of Cardiology, Academic Medical Center, University of Amsterdam, Amsterdam, The Netherlands.3Department of Radiology, Leiden University Medical Center, Leiden, The Netherlands.4Sheffield Teaching Hospitals NHS Foundation Trust, Sheffield, UK.
Received: 13 March 2018 Accepted: 20 July 2018
References
1. Yamamoto K, Nishimura RA, Chaliki HP, Appleton CP, Holmes DR, Redfield MM. Determination of left ventricular filling pressure by Doppler echocardiography in patients with coronary artery disease: critical role of left ventricular systolic function. J Am Coll Cardiol. 1997;30:1819–26. 2. Hammermeister KE, DeRouen TA, Dodge HT. Variables predictive of survival
in patients with coronary disease. Selection by univariate and multivariate analyses from the clinical, electrocardiographic, exercise, arteriographic, and quantitative angiographic evaluations. Circulation. 1979;59:421–30. 3. Aikawa Y, Rohde L, Plehn J, Greaves SC, Menapace F, Arnold JMO, et al.
Regional wall stress predicts ventricular remodeling after anteroseptal myocardial infarction in the healing and early afterload reducing trial (HEART): an echocardiography-based structural analysis. Am Heart J. 2001;141:234–42. 4. Alter P, Koczulla AR, Nell C, Figiel JH, Vogelmeier CF, Rominger MB. Wall
stress determines systolic and diastolic function - characteristics of heart failure. Int J Cardiol. 2016;202:685–93.
6. Meta-Analysis Research Group in Echocardiography (MeRGE) AMI Collaborators, Møller JE, Whalley GA, Dini FL, Doughty RN, Gamble GD, et al. Independent Prognostic Importance of a Restrictive Left Ventricular Filling Pattern After Myocardial Infarction: An Individual Patient Meta-Analysis: Meta-Analysis Research Group in Echocardiography Acute Myocardial Infarction. Circulation. 2008;117:2591–8.
7. Pearlman AS, Stevenson JG, Baker DW. Doppler echocardiography: applications, limitations and future directions. Am J Cardiol. 1980;46:1256–62. 8. PREC O, KATZ LN, Sennett L, Rosenman RH, Fishman AP, Hwang W.
Determination of kinetic energy of the heart in man. Am J Phys. 1949;159:483–91. 9. Carlsson M, Töger J, Kanski M, Bloch KM, Ståhlberg F, Heiberg E, et al.
Quantification and visualization of cardiovascular 4D velocity mapping accelerated with parallel imaging or k-t BLAST: head to head comparison and validation at 1.5 T and 3 T. J Cardiovasc Magn Reson. 2011;13:55. 10. Eriksson J, Bolger AF, Ebbers T, Carlhäll C-J. Four-dimensional blood
flow-specific markers of LV dysfunction in dilated cardiomyopathy. Eur Heart J Cardiovasc Imaging. 2013;14:417–24.
11. Eriksson J, Dyverfeldt P, Engvall J, Bolger AF, Ebbers T, Carlhall CJ. Quantification of presystolic blood flow organization and energetics in the human left ventricle. AJP Hear Circ Physiol. 2011;300:H2135–41.
12. Bolger AF, Heiberg E, Karlsson M, Wigström L, Engvall J, Sigfridsson A, et al. Transit of blood flow through the human left ventricle mapped by cardiovascular magnetic resonance. J Cardiovasc Magn Reson. 2007;9:741–7. 13. Crandon S, Elbaz MSM, Westenberg JJM, van der Geest RJ, Plein S, Garg P.
Clinical applications of intra-cardiac four-dimensional flow cardiovascular magnetic resonance: a systematic review. Int J Cardiol. 2017;249:486–93. 14. Eriksson J, Carlhäll CJ, Dyverfeldt P, Engvall J, Bolger AF, Ebbers T. Semi-automatic quantification of 4D left ventricular blood flow. J Cardiovasc Magn Reson. 2010;12:9.
15. Carlsson M, Heiberg E, Toger J, Arheden H. Quantification of left and right ventricular kinetic energy using four-dimensional intracardiac magnetic resonance imaging flow measurements. AJP Hear Circ Physiol. 2012;302:H893–900.
16. Kanski M, Arvidsson PM, Töger J, Borgquist R, Heiberg E, Carlsson M, et al. Left ventricular fluid kinetic energy time curves in heart failure from cardiovascular magnetic resonance 4D flow data. J Cardiovasc Magn Reson. 2015;17:111. 17. Svalbring E, Fredriksson A, Eriksson J, Dyverfeldt P, Ebbers T, Bolger AF, et al.
Altered Diastolic Flow Patterns and Kinetic Energy in Subtle Left Ventricular Remodeling and Dysfunction Detected by 4D Flow MRI. Aliseda A, editor. PLoS One. 2016;11:e0161391.
18. Wong J, Chabiniok R, deVecchi A, Dedieu N, Sammut E, Schaeffter T, et al. Age-related changes in intraventricular kinetic energy: a physiological or pathological adaptation? Am J Physiol Hear Circ Physiol. 2016;310:H747 LP–H755.
19. Thygesen K, Alpert JS, Jaffe AS, Simoons ML, Chaitman BR, White HD, et al. Third universal definition of myocardial infarction. J Am Coll Cardiol. 2012;60:1581–98.
20. Killip T, Kimball J. Treatment of myocardial infarction in a coronary care unit. A two year experience with 250 patients. Am J Cardiol. 1967;20:457–64. 21. Garg P, Westenberg JJM, van den Boogaard PJ, Swoboda PP, Aziz R, Foley
JRJ, et al. Comparison of fast acquisition strategies in whole-heart four-dimensional flow cardiac MR: two-center, 1.5 tesla, phantom and in vivo validation study. J Magn Reson Imaging. 2017;47:272–81.
22. Garg P, Kidambi A, Foley JRJ, Al MT, Ripley DP, Swoboda PP, et al. Ventricular longitudinal function is associated with microvascular obstruction and intramyocardial haemorrhage. Open Hear. 2016;3:e000337. 23. Garg P, Kidambi A, Swoboda PP, Foley JRJ, Musa TA, Ripley DP, et al. The role of left ventricular deformation in the assessment of microvascular obstruction and intramyocardial haemorrhage. Int J Cardiovasc Imaging. 2017;33:361–70. 24. Walker PG, Cranney GB, Scheidegger MB, Waseleski G, Pohost GM,
Yoganathan AP. Semiautomated method for noise reduction and background phase error correction in MR phase velocity data. J Magn Reson Imaging. 1993;3:521–30.
25. MacDonald ME, Forkert ND, Pike GB, Frayne R, Drangova M, Fenster A. Phase Error Correction in Time-Averaged 3D Phase Contrast Magnetic Resonance Imaging of the Cerebral Vasculature. Zhang H, editor. PLoS One. 2016;11:e0149930. 26. Lotz J, Meier C, Leppert A, Galanski M. Cardiovascular flow measurement
with phase-contrast MR imaging: basic facts and implementation. Radiographics. 2002;22:651–71.
27. Garg P, Broadbent DA, Swoboda PP, Foley JRJ, Fent GJ, Musa TA, et al. Acute infarct extracellular volume mapping to quantify myocardial area at
risk and chronic infarct size on cardiovascular magnetic resonance imaging. Circ Cardiovasc Imaging. 2017;10:e006182.
28. Elbaz MSM, van der Geest RJ, Calkoen EE, de Roos A, Lelieveldt BPF, Roest AAW, et al. Assessment of viscous energy loss and the association with three-dimensional vortex ring formation in left ventricular inflow: in vivo evaluation using four-dimensional flow MRI. Magn Reson Med. 2017;77(2): 794-805.
29. Brun P, Tribouilloy C, Duval AM, Iserin L, Meguira A, Pelle G, et al. Left ventricular flow propagation during early filling is related to wall relaxation: a color M-mode Doppler analysis. J Am Coll Cardiol. 1992;20:420–32. 30. Domenichini F, Pedrizzetti G. Hemodynamic forces in a model left ventricle.
Phys Rev Fluids. 2016;1:083201.
31. Hussaini SF, Rutkowski DR, Roldán-Alzate A, François CJ. Left and right ventricular kinetic energy using time-resolved versus time-average ventricular volumes. J Magn Reson Imaging. 2017;45:821–8.
32. De Boeck BWL, Oh JK, Vandervoort PM, Vierendeels JA, van der Aa RPLM, Cramer M-JM. Colour M-mode velocity propagation: a glance at intra-ventricular pressure gradients and early diastolic intra-ventricular performance. Eur J Heart Fail. 2005;7:19–28.
33. Greenberg NL, Vandervoort PM, Firstenberg MS, Garcia MJ, Thomas JD. Estimation of diastolic intraventricular pressure gradients by Doppler M-mode echocardiography. Am J Physiol Heart Circ Physiol. 2001;280:H2507–15. 34. Yotti R, Bermejo J, Antoranz JC, Desco MM, Cortina C, Rojo-Alvarez JL, et al.
A noninvasive method for assessing impaired diastolic suction in patients with dilated cardiomyopathy. Circulation. 2005;112:2921–9.
35. Abe H, Caracciolo G, Kheradvar A, Pedrizzetti G, Khandheria BK, Narula J, et al. Contrast echocardiography for assessing left ventricular vortex strength in heart failure: a prospective cohort study. Eur Heart J Cardiovasc Imaging. 2013;14:1049–60.
36. Pedrizzetti G, La Canna G, Alfieri O, Tonti G. The vortex--an early predictor of cardiovascular outcome? Nat Rev Cardiol. Nature Publishing Group, a division of Macmillan Publishers Limited. All Rights Reserved. 2014;11:545–53. 37. Eriksson J, Zajac J, Alehagen U, Bolger AF, Ebbers T, Carlhäll C-J. Left
ventricular hemodynamic forces as a marker of mechanical dyssynchrony in heart failure patients with left bundle branch block. Sci Rep. 2017;7:2971. 38. Eriksson J, Bolger AF, Ebbers T, Carlhall C-J. Assessment of left ventricular
hemodynamic forces in healthy subjects and patients with dilated cardiomyopathy using 4D flow MRI. Physiol Rep. 2016;4(3). 39. Arvidsson PM, Töger J, Carlsson M, Steding-Ehrenborg K, Pedrizzetti G,
Heiberg E, et al. Left and right ventricular hemodynamic forces in healthy volunteers and elite athletes assessed with 4D flow magnetic resonance imaging. Am J Physiol Circ Physiol. 2017;312:H314–28.
40. Pedrizzetti G, Arvidsson PM, Töger J, Borgquist R, Domenichini F, Arheden H, et al. On estimating intraventricular hemodynamic forces from endocardial dynamics: a comparative study with 4D flow MRI. J Biomech. 2017;60:203–10.