Int. J. Electrochem. Sci., 6 (2011) 3607 - 3630
International Journal of
ELECTROCHEMICAL
SCIENCE
www.electrochemsci.org
Electrochemical Behavior of the Super Antioxidant, α-Lipoic
Acid
C. V. Krishnan1,2,* and M. Garnett1
1
Garnett McKeen Lab, Inc., 7 Shirley Street, Bohemia, NY 11716-1735, USA
2
Department of Chemistry, Stony Brook University, Stony Brook, NY11794-3400, USA
*
E-mail: ckrishnan@notes.cc.sunysb.edu
Received: 2 June 2011 / Accepted: 7 July 2011 / Published: 1 August 2011
We have investigated the complex cyclic voltammetric behaviour of the sodium salt of α-lipoic acid in the absence and presence of the background electrolytes, sodium chloride and phosphate buffer. Absorption data indicated deviations from Beer’s law above 10 mM suggesting strong solute-solute interactions at higher concentrations. By scanning in a wide range of potentials, +2.0 to -2.0V, and using 1 mM α-lipoic acid (sodium salt), it was possible to identify the irreversible formation of thiolsulfonate, reversible formation lipoic acid S-oxide, reversible formation of dihydrolipoic acid, and reversible formation of dimers of lipoic acid. The oxidation of dihydrolipoic acid and the dimers of lipoic acid were influenced by the concentration of lipoic acid as well as the scan rate. Evidence is presented for the formation of S-oxides of lipoic acid dimers or higher polymers that are different from lipoic acid S-oxide. In the active region, the cathodic current produced depended on the concentration of α-lipoic acid. The reduction of α-lipoic acid to dihydrolipoic acid was unaffected by the starting anodic potential. The oxidation of dihydrolipoic acid was complicated by the formation of polymers of lipoic acid. With increasing concentrations of lipoic acid, the rate of increase in cathodic current due to reduction of lipoic acid was much higher than that of the reduction of lipoic acid S-oxide. Cathodic current oscillations were observed in the presence of counter ions and 10 mM α-lipoic acid. Higher pH produced less reduction currents of α-lipoic acid. Both the phosphate buffer and sodium chloride produced anodic shifts in the reduction peak of α-lipoic acid. Phosphate buffer gave a higher anodic shift in the reduction peak than sodium chloride. The cathodic peak current was higher with increasing concentrations of sodium chloride. It was possible to restrict the interference from different species on some redox processes, such as the redox process of lipoic acid S-oxide formation and reversible oxidation of dihydrolipoic acid, by restricting the range of the scanning potential and the concentration of lipoic acid. These cyclic voltammetry data suggested the need to investigate the electrochemical behaviour of molecules without any background electrolytes, whenever possible, to gain information on interactions near the double layer. This is contrary to the accepted practice in electrochemistry. Finally caution is suggested in deciding the oral dosage of lipoic acid supplements because of its tendency to polymerize under reducing biological conditions.
1. INTRODUCTION
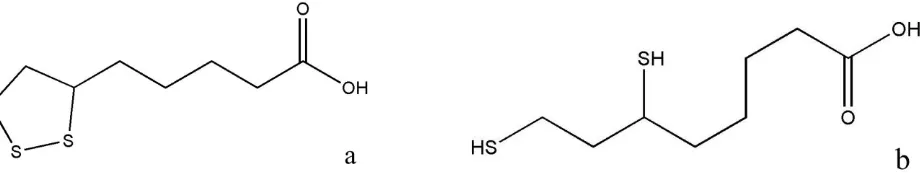
Alpha lipoic acid ((±)-α-lipoic acid or DL- α-lipoic acid, DL-6, 8-thioctic acid, (±)-1, 2-dithiolane-3-pentanoic acid, 6, 8-dithiooctanoic acid, Protogen-A), shown in Fig. 1a, is a very unique biological molecule. It occurs naturally as a coenzyme in both prokaryotic and eukaryotic cells, as well as in plants, and animals including humans [1]. In the intracellular environment, two or more enzymes reduce the exogenous lipoic acid. The reduced form, (±)-dihydrolipoic acid or (±)-6, 8-dimercaptooctanoic acid is shown in Figure 1b. Lipoic acid has a carboxylic acid (pKa 4.7), which is
ionized at biological pH, and it has a cyclic disulfide or dithiolane ring [1, 2]. The reversible reduction to dihydrolipoic acid is favored by the presence of the ring strain in the 1, 2-dithiolane ring of about 15-25 kJmol-1 [2]. α-Lipoic acid exits as R(+)-and S(-)- enantiomers due to the presence of an asymmetric carbon. The biologically active enantiomer is mostly the former one. Since its first isolation in 1951 from liver residue, numerous investigations have been carried out to decipher the uniqueness of this simple but elegant molecule [1, 3-5].
The dihydrolipoic acid can regenerate or recycle the antioxidants CoQ (ubiquinol), vitamins C and E, and glutathione. Both lipoic acid and its reduced form are known to scavenge reactive oxygen and nitrogen species such as H2O2, HO., singlet oxygen, hypochlorous acid (HOCl), and peroxynitrite
(ONOO.-) [1, 6].
[image:2.596.56.517.397.487.2]
Figure 1. Alpha lipoic acid in it’s a) oxidized and b) reduced forms
Disulfide bonds in proteins are formed between the thiol groups of cysteine residues. The other sulfur-containing amino acid, methionine, cannot form disulfide bonds. More aggressive oxidants convert cysteine to the corresponding sulfinic acid and sulfonic acid. A variety of oxidants promote this reaction including air and hydrogen peroxide. Such reactions are thought to proceed via sulfenic acid intermediates.
The biological effects of lipoic acid can be mostly accounted for in terms of its redox property, antioxidant capacity and fatty acid properties. Lipoic acid can cross the blood-brain barrier.
The α-lipoic acid/dihydrolipoic acid couple is called a “universal antioxidant” because it fulfills several criteria used to evaluate the antioxidant potential as well as preventive or therapeutic applications of a compound such as specificity of free radical quenching, metal chelating ability, interaction with other antioxidants, effects on gene expression, absorption and bioavailability, concentration in tissues, cells, and extracellular fluid, and location (in aqueous or membrane domains or in both) [6].
The reduction potential for the α-lipoic acid/dihydrolipoic acid couple of -320 mV [4] or -290 mV [7] and the GSSG (glutathione disulfide)/GSH couple of -240 mV indicate that dihydrolipoic acid can react with glutathione disulfide and regenerate glutathione [6]. Thus lipoic acid helps to maintain GSH/GSSG ratio in cells [1].
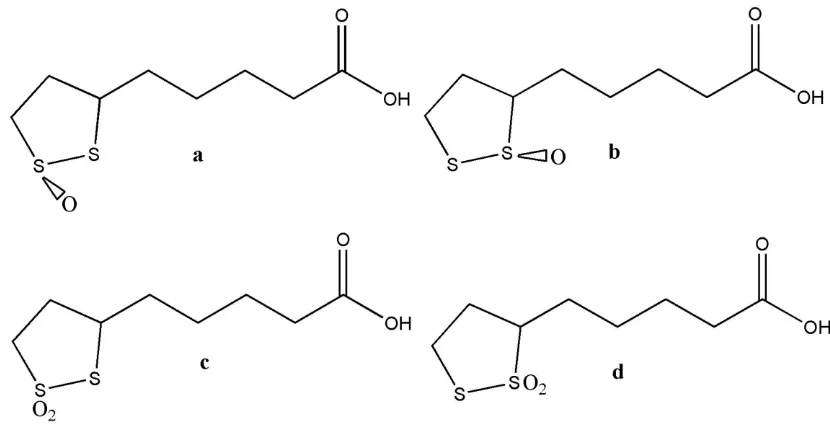
[image:3.596.88.503.401.617.2]The oxidized form α-lipoic acid can undergo further oxidation at sulfur or get reduced. This property, which is somewhat similar to an intermediate oxidation state in a transition metal or a nonmetal, makes this molecule very unique compared to other biological molecules. The oxidized forms are shown in Figure 2. A biological oxidation product of α-lipoic acid (lipoic acid S-oxide or a thiolsulfinate), shown in Figure 2a and 2b, is known as β-lipoic acid or Protogen-B [2, 5]. Even though structure given in Figure 2a is favored, it has not been possible to conclusively prove which sulfur is oxidized [7]. Chemical oxidation studies of α-lipoic acid have included products shown in Figure 2 c and 2d (the thiolsulfonates) along with thiolsulfinates [7].
Figure 2. Oxidation products of α-lipoic acid
Therapeutic and energy production applications of this powerful antioxidant have also been explored extensively [1].
group transfer take place in the oxidative decarboxylation of α-ketoacids with the aid of α-lipoic acid. The reversible redox reaction between α-lipoic acid and dihydrolipoic acid is thus a very important biochemical reaction.
Voltammetry of α-lipoic acid has been carried out using glassy carbon electrode modified with carbon nanotubes, glassy carbon, highly oriented pyrrolytic graphite, platinum, tungsten, zinc, mercury on gold, and lipoate sensitive sensor based on mercury lipoate ion-pair [9-14]. The oxidation of α-lipoic acid was found to be a one-electron charge transfer process, pH independent, and an irreversible process [9]. A mercury lipoate complex, Hg(Lip)(OH)2, has been reported [2, 15]. Despite the fact that
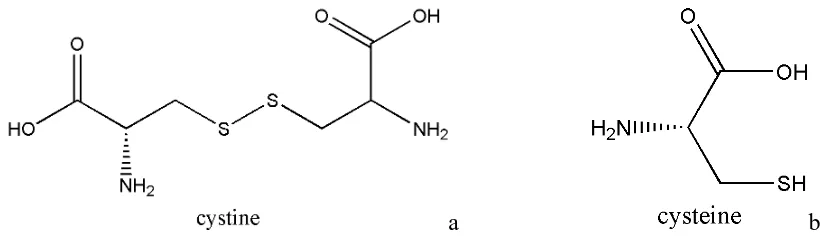
molecules containing the disulfide bond (-S-S-) adsorb strongly at the mercury electrode, the electrochemical characteristics of cysteine that forms the disulfide cystine have been studied thoroughly using the mercury electrode [16-21]. We have also investigated cysteine and cysteine in the presence of sodium molybdate using the mercury electrode [22-23]. Most voltammetric studies were centered on the oxidation of α-lipoic acid and studies related to its reduction to dihydrolipoic acid were limited [13]. To understand the electrochemical behavior of α-lipoic acid, we have explored potential regions beyond the normal range of the mercury electrode, both on the cathodic side as well as on the anodic side. The advantage in using the mercury electrode is the ease with which we can obtain a fresh consistent surface and drop. We have not observed (visually) any passivation of mercury on the anodic side when lipoic acid was present without any background electrolyte. We have investigated the cathodic side in much greater detail. These studies provide an opportunity to compare with the other system, cysteine/cystine, shown in Figure 3. At biological pH, they will be in their zwitterionic forms. Other similar systems such as unithiol (sodium 2, 3-dimercaptopropane sulfonate) and dimercaptosuccinic acid (disodium salt) will be reported in our later studies.
[image:4.596.91.507.468.588.2]a b Figure 3. The a) oxidized (cystine) and the b) reduced (cysteine) forms of an amino acid
2. EXPERIMENTAL PART
the background electrolyte. Phosphate buffer, pH 7.23, (0.059 M PO43-, 0.059 M K+ and 0.041 M Na+)
was prepared using analytical grade KH2PO4 and NaOH. Electrochemical measurements were carried
out with no background electrolyte, in NaCl and in phosphate buffer. The solutions were purged with N2 for about 10 minutes before the experiment.
3. EXPERIMENTAL RESULTS 3.1. Absorption Spectra
The absorption spectra of 0.20 M solutions of sodium lipoate, prepared by neutralization of α-lipoic acid from different manufacturers, are shown in Figure 4. The slight differences in the absorption at the λmax may be due to the slight differences in concentrations. Since Amresco α-lipoic
acid was ultra pure and its spectra and the spectra for Crystalgen α-lipoic acid were almost identical, most of the other experiments were carried out using Crystalgen α-lipoic acid. Our numerous experiments using all the four samples have indicated no significant differences between the different experiments to warrant a caution in the interpretation of the results.
Figure 4. Spectra of 0.20 M α-lipoic acid (sodium salt) from different manufacturers, 1) Amresco 2) Crystalgen 3) M.P. Biochemical 4) MTC Chemical; 1mm cell.
[image:5.596.124.453.386.650.2]
manufacturers. Deviations from linearity are observed above 0.01 M indicating strong solute-solute interactions at higher concentrations. Beer’s law is reported to obey up to 1mM [24].
The absorption spectrum observed here is consistent with the reported λmax of 333 nm [5, 25].
The reported molar extinction coefficients or molar absorptions are ~170 [5] at 333 nm and 127 at 330 nm [24].
Figure 5. a. Spectra of 1, 0.02; 2, 0.04; 3, 0.08; 4, 0.12; 5, 0.16; 6, 0.20 M α-lipoic acid (sodium salt), 1mm cell; b. Beer’s Law for α-lipoic acid (sodium salt); λ, 333 nm.
3.2. Cyclic Voltammetry
3.2.1. Cyclic voltammetry of 1mM α-lipoic acid (sodium salt)
A series of cyclic voltammetric measurements were carried out using 1 mM α-lipoic acid (sodium salt). This concentration was chosen to minimize solute-solute interactions. Spectrophotometric data suggested practically no solute-solute interaction below 1 mM. Also the concentrations are sufficient enough to produce a measurable amount of current in the absence of common background electrolytes or buffers. In the absence of any background electrolytes the lipoic acid will be competing only with water for the surface of mercury at a given applied potential.
[image:6.596.84.496.194.362.2]
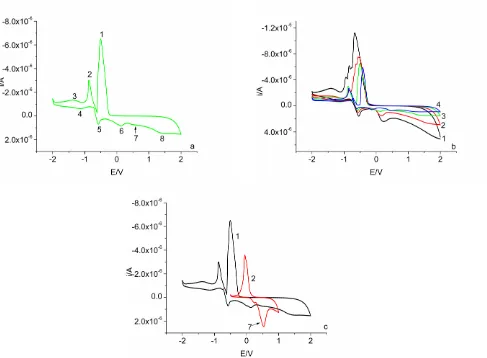
of lipoic acid dimers or higher polymers (peak 6). However, when the formation of lipoic acid dimers or higher polymers is minimized by restricting the scan to less cathodic potentials (to -0.5 V instead of -2.0 V) the formation of S-oxide of lipoic acid dimers or higher polymers is minimized and thus allowing the formation of lipoic acid S-oxide (peak 7) as shown in Figure 6c curve 2. This is exemplified further in our cyclic voltammograms using 4 mM lipoic acid (sodium salt) and discussed in a later section.
Figure 6. Cyclic voltammogram of 1 mM α-lipoic acid (sodium salt), pH 7.2, scan 2.0 to -2.0 V and back, scan 3, scan rate a and c, 100mV/sec; b. scan rates 1) 400 2) 200 3) 100 4) 50 mV/sec; c. 1) scan 2.0 to -2.0 V and back, 2) scan 1.0 to -0.5V and back; peak 7 same as peak 7 in a.
[image:7.596.56.543.189.547.2]
cathodic shift of peak 2 with increasing scan rates. The peak corresponding to the dimerization or polymerization process became more conspicuous at the highest scan rates. A noticeable (but not assigned peak 4) broad oxidation peak is seen at high scan rates corresponding to the oxidation of species of peak 3. At higher scan rates the oxidation peak of the dihydrolipoic acid (peak 5) became easily observable. The formation of the oxidized lipoic acid S-oxide peak (peak 6) of dimers or higher polymers also became more clear with increasing scan rates. However the formation of the thiolsulfonates (peak 8) became less clear at the higher scan rates. The formation of dimers or higher polymers masks the formation of lipoic acid S-oxide peak 7. At the lowest scan rate two small peaks were observed for the formation of lipoic acid S-oxide (peak 6). It is not clear at this time whether it was a pre- or post-adsorption peak and the oxidation peak or the formation of two different lipoic acid S-oxides (shown in Figure 2a and 2b).
Figure 7 gives the influence of repeated scans at slow (50 mV/sec) and at high (400 mV/sec) scan rates. At slow scan rate, scans 2 and 3 gave nearly the same results with a slight cathodic shift from scan 1 for the peak corresponding to the reduction of lipoic acid S-oxide (peak 1, Figure 6a). There was also a slight increase in the current for scans 2 and 3. The redox process of peak 3, Figure 6a became more clear at the higher scan rates in Figure 7b. The pre- or post-adsorption peak and oxidation peak for the formation of lipoic acid oxide or the formation of two kinds of lipoic acid S-oxides were observed only at the lowest scan rate.
[image:8.596.59.545.393.570.2]
Figure 7. Cyclic voltammogram of 1 mM α-lipoic acid (sodium salt), pH 7.2, 1) scan 1 2) scan 2 3) scan 3, scan 2.0 to -2.0 V and back, scan rate a. 50 mV/sec b. 400 mV/sec
Since a number of redox species were involved in the wide range of scanning potentials, it was decided to measure cyclic voltammograms in a limited range of potentials each time. This allowed restriction of the influence of other species, if any, on the redox process taking place in the measured potential range. These results are shown in Figure 8.
[image:9.596.53.545.65.652.2]
The complications arising from the formation of dimers or higher polymers were minimized by not extending the scan to -2.0V and thus avoiding the formation of species corresponding to peak 3 in Figure 6a and the corresponding oxidized species. Similar anodic current spikes have been observed for cysteine on mercury electrodes [16, 22]. The behavior was the same irrespective of repeated scans.
The scanning range in Figure 8c corresponds to the reduction of lipoic acid S-oxide (peak 1, Figure 6a). There was practically no change for scans 1, 2, and 3. Also a preadsorption peak before the formation of lipoic acid S-oxide was more clearly observed. These curves tend to rule out the possibility of the formation of two different species of lipoic acid S-oxides that we had suggested earlier. Another very important feature observed here is that both the cathodic and anodic peaks were somewhat symmetrical. In Figures 6 and 7, the anodic peak current corresponding to peak 6 in Figure 6a was much less than the peak current corresponding to peak 1 of Figure 6a. It implies that either the polymerized species obtained by scanning in highly negative potentials were interfering with the formation of lipoic acid S-oxide or the current due to the reduction of lipoic acid S-oxide is influenced by the starting potential of the anodic scan.
Most of the curves in Figure 6a was reconstructed using the curves in Figure 8 a, b, and c and shown in Figure 8d. The curve in Figure 6a was also included in the reconstructed Figure 8e. These reconstructed graphs suggested the following. 1) the peak corresponding to the reduction of α-lipoic acid (sodium salt) is not affected by the starting potential of the scan (peak 2, Figure 6a). 2) The anodic current spike is more vividly seen by restricting the scanning potential of the reduction process to about -1.0 V, that is, by restricting the formation of dimer or higher polymers. 3) The potential as well as the current for the formation of the lipoic acid S-oxide and its reduction were affected by the range of the scanning potential. When this was avoided by restricting the scan from 0.5 V to -0.5 V and back, a more symmetric redox process of the formation of lipoic acid S-oxide and its reduction were observed. This was more clear by observing the peak current of peak 6 in Figure 6a shown in Figure 8e and comparing to that of Figure 8c. Also the peak 1 in Figure 6a was shifted more cathodic compared to that in Figure 8c. The anodic peak 6 in Figure 6a is also shifted more cathodic compared to that in Figure 8c. 4) By scanning to extreme cathodic and anodic positions, the formation of lipoic acid dimers and the formation of thiolsulfonates were more easily observed.
The data in Figures 6-8 suggest the need for control of scan rate, number of scans, and scanning potential range in order to decipher some of the components involved in the complex redox processes of α-lipoic acid (sodium salt).
3.2.2. Concentration dependence of the cyclic voltammetry of α-lipoic acid (sodium salt)
the reduction of lipoic acid S-oxide at low concentrations increased at a higher rate than the current due to lipoic acid S-oxide reduction (Figure 9a).
Figure 9. Cyclic voltammogram of α-lipoic acid (sodium salt), scan 3, 2.0 to -2.0 V and back; a. concentration, mM, 1, 1; 2, 2; 3, 3; 4, 4; b. concentration, mM,1, 4; 2, 5; 3, 6; 4, 10; scan rate 100 mV/sec
[image:11.596.68.533.125.299.2]
Figure 10. Cyclic voltammogram of α-lipoic acid (sodium salt), scan 3 and scan rate 100 mV/sec for all; a. 2.0 to 1.5V and back, 1, 10; 2, 20; 3, 40; 4, 60 mM; For curve 5, 60 mM (scan 2.0 to -2.0V and back); b. 0.5 to -0.5 V and back; 1, 10; 2, 20; 3, 40; 4, 60 mM; c. 1.0 to -0.5 V and back; 1, 10; 2, 20; 3, 40; 4, 60 mM; d. 10 mM 1, 0.5 to -0.5 V and back; 2, 1.0 to -0.5 V and back; e. 60 mM 1, 0.5 to -0.5 V and back; 2, 1.0 to -0.5 V and back
At concentrations greater than 4 mM, the current for the reduction of lipoic acid was greater than the current for the reduction of lipoic acid S-oxide (Figure 9b).
There was no shift in the anodic peak due to the formation of lipoic acid S-oxide with changes in the concentration of lipoic acid. There was a slight increase in the anodic current with increasing concentrations of lipoic acid. As pointed out earlier, the current for the oxidation of lipoic acid to form lipoic acid S-oxide was much less than the current for the reduction of lipoic acid S-oxide. This was attributed to the interference from either the lipoic acid polymers or due to higher currents for the reduction of lipoic acid S-oxides when the starting anodic potential is high. At higher concentrations while there was a small cathodic shift in the reduction of lipoic acid there was a small anodic shift in the reduction of lipoic acid S-oxide. A cathodic shift in the formation of thiolsulfonates was also observed with increasing concentration of lipoic acid. The anodic current spike increased with increasing concentration of lipoic acid. Also the cathodic peak 3 shown in Figure 6a corresponding to the formation of probable dimers was not clearly visible above 10 mM concentration. We suspect this was due to the formation of higher polymers at higher concentrations of lipoic acid. We attribute the sharp decrease in reduction current (corresponding to the peak 2 in Figure 6a) after the peak formation exhibited at higher concentrations and shown in Figure 10a as due to formation of higher polymers instead of dimers (curves 1, 2 in comparison with curves 3, 4 in Figure 10 a).
The cyclic voltammograms for 0.01 and 0.20 M α-lipoic acid at different scan rates are shown in Figures 11 and 12. The scanning range of potentials was from 0.3 V to -0.5 V and back for Figure 11 and +1.0V to -0.5 V and back for Figure 12. While scan 1 was slightly different, the differences between scan 2 and scan 3 were insignificant in both the scan ranges. The two reduction processes observed at concentrations 10-60 mM in Figures 10 b, d, and e were observed here also at 0.01 and 0.20 M when the starting anodic potential was changed from +0.5 to +0.3 V. The dual maxima became single peak when the starting anodic potential was changed to +1.0V. While scans 2 and 3 shifted slightly anodic at 0.01 M, there was a slight cathodic shift at 0.20 M.
Figure 11. Cyclic voltammogram of α-lipoic acid (sodium salt), scan 1, 2, 3; 0.3 to -0.5 V and back; a. 0.01M; b. 0.20 M
Figure 12. Cyclic voltammogram of α-lipoic acid (sodium salt), scan 1, 2, 3; 1 to -0.5 V and back; a. 0.01M; b. 0.20 M
[image:13.596.72.494.244.405.2] [image:13.596.80.495.489.647.2]
starting anodic potential. The anodic current spike was also unaffected. The sharp reduction in the cathodic current after the peak was similar to that observed before and was probably due to the formation of higher polymers of lipoic acid. The reduction peak of lipoic acid S-oxide was masked by the high current of the reduction of lipoic acid. This is shown separately in Figure 13 b by scanning from +1.0 to -0.5 V and back.
[image:14.596.63.513.176.350.2]
Figure 13. Cyclic voltammogram of 0.20 M α-lipoic acid (sodium salt), scan 3, a. Different starting potentials of scan; b. scan from 1.0 to -0.5 V to observe the reduction of lipoic acid S-oxide which was masked by the higher current in Figure 13a.
The influence of the scan rates on the reduction of lipoic acid at 0.01 and 0.10 M are shown in Figure 14. These may be compared with that in Figure 6 b for 1 mM lipoic acid (sodium salt). The peak was shifted cathodic with increasing scan rates. The reduction in the current after the peaks became sharper at the highest concentration.
[image:14.596.66.533.526.696.2]
The dimer formation was masked at these higher concentrations. The reduction in the current after the peak became less sharp with increasing scan rates for 0.01 M lipoic acid. This sharpness was unaffected by the scan rate for 0.10 M lipoic acid (sodium salt).
3.2.3. Cyclic voltammetry of 4 mM α-lipoic acid (sodium salt)
We have selected an intermedicate concentration of 4 mM α-lipoic acid (sodium salt) so that the solute-solute interaction is not considerable. Also the solute-solvent interaction is not severely restricted and possibilities exist for considerable overlap of solvation cospheres. Also an intermediate concentration may limit the formation of higher polymers and increase the possibility of dimer formation.
[image:15.596.64.528.287.670.2]
The cyclic voltammograms for 4 mM α-lipoic acid (sodium salt) are shown in Figure 15. The results shown in Figure 15a illustrate the role of the range of the cathodic potential. When the cathodic scan is changed from –0.5 to –2.0 V keeping a constant starting potential of +0.5 V for the start of the scan, the peak a in curve 1 of Figure 15a corresponding to the reduction of lipoic acid S-oxide shifts cathodic. Also two reduction peaks (peak b in Figure 15a) were observed. This clearly indicates the presence of more than one type of lipoic acid-S oxide and confirms the results we had observed with 1 mM lipoic acid. It is further exemplified in Figure 15 c. In order to have similar currents as peak a, curve 1 of Figure 15a and to avoid masking of the peaks due to high current at higher cathodic potentials only part of the cathodic scan is shown for curves 2 and 3 in Figure 15c.
Figure 15b curves 1-4 indicate the role of changing anodic potential from +0.5 to +1.0 V keeping a constant cathodic potential of –0.5 V. For comparison the scan for the range –2.0 to +2.0 V is included in curve 5 of Figure 15 b. This clearly demonstrated the existence of at least two lipoic acid S-oxides, shown by peaks c and d in Figure 15 a. and more clearly indicated in Figure 15 b.
3.2.4. Cyclic voltammetry of 1mM α-lipoic acid (sodium salt) in the presence of air, NaCl and buffer
The accepted practice in electrochemistry is to carry out cyclic voltammetry experiments of the active materials in the presence of electrolytes or buffers. In the case of active materials that are electrolytes we had reported [22] that there was no need to have additional electrolytes or buffers. Also the presence of electrolytes or buffers interferes with the interaction of the active materials with water and thus masks the effect of important solute-solvent interactions where the solute is the active material. Since all the previous α-lipoic acid electrochemistry experiments were in the presence of electrolytes and with much lower concentrations, we have repeated some experiments to evaluate the influence of electrolytes and buffer.
To investigate the influence of air in the oxidation of α-lipoic acid, cyclic voltammograms were carried out without removing the dissolved air from the sample and then repeated again after de-aeration with nitrogen. These results are given in Figure 16a. The first cathodic peak is that of the reduction of the α-lipoic S-oxide and the second small peak that of the reduction of the α-lipoic acid. The presence of dissolved air produced more anodic current corresponding to the oxidation of α-lipoic acid. The broad anodic peak around +1.5 V that we have assumed to be that of the sulfonate formation was not affected by the presence of dissolved air in the sample.
All other experiments shown in Figures 16b, 16c, 16d, and 16e are after de-aeration. The influence of the range of potential scan on the cyclic voltammogram is shown in Figure 16b. The reduction current of the α-lipoic acid was nearly the same when the starting potential of the scan was 0.0 or +2.0 V. However the first cathodic reduction peak corresponding to the reduction of the oxidized form of α-lipoic acid (which we have assigned as that of the lipoic acid S-oxide) was extremely small when the starting potential of the scan was 0.0 V.
concentration of NaCl was increased from 0.05 M to 0.5 M NaCl the reduction current increased further with a very slight anodic shift in the reduction peak (Figure 16d, curve 2).
[image:17.596.58.537.117.655.2]
When the pH of 10 mL solution containing 1 mM sodium lipoate and 0.50 M NaCl was raised from pH 6.32 to pH 10.0 by the addition of 5 μL of 1.0 M NaOH, the reduction current was considerably reduced (curve 3, Figure 16d). But there was no shift in the cathodic reduction peak potential.
The influence of a buffer, (0.059 M phosphate, 0.059 M K+ and 0.041 M Na+) pH 7.23, is shown in Figure 16d and 16e. The sensitivity of the α- lipoic acid reduction is exemplified here. The reduction peak is further shifted anodic compared to that of 0.50 M NaCl.
A careful examination of the curves in Figure 16a through 16e also revealed that the reduction of α-lipoic acid to dihydrolipoic acid is somewhat reversible. This has not been observed in previous studies. This reversibility is somewhat lost by the presence of NaCl or phosphate buffer.
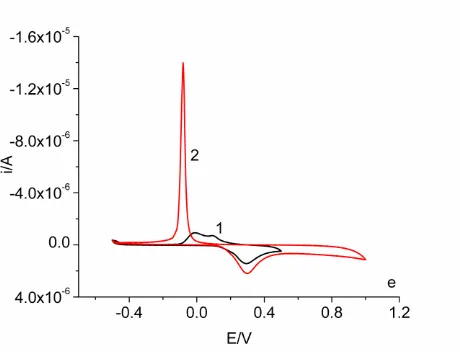
3.2.5. Cyclic voltammetry of α-lipoic acid in the presence of 0. 1M NaCl
[image:18.596.68.533.402.574.2]Cyclic voltammograms for 10 mM α-lipoic acid (sodium salt) in 0.10 M NaCl with different starting potentials for scan are shown in Figure 17 a. Current oscillations during the reduction process of lipoic acid were observed here. Also a fairly big spike in current was observed during the anodic scan. These observations were confirmed when the end of the cathodic scanning potential was changed from -1.5 to –1.0 V (Figure 17 b).
Figure 17. Cyclic voltammogram of 10 mM α-lipoic acid (sodium salt) in 0.10 M NaCl, scan 3; a. 1) 0.5 to 1.5 V 2) 0.0 to 1.5 V 3) 0.5 to 1.5 V; b. 1) 0.5 to 1.5 V 2) 0.5 to 1.0V 3) 0.0 to -1.0V
Figure 18. Cyclic voltammogram of 100 mM α-lipoic acid (sodium salt) scan 3; 1) -0.5 to -2.0 V, no NaCl 2) -0.5 to -1.5 V, no NaCl; 3) -0.5 to -2.0 V, 0.10 M NaCl 4) -0.5 to -1.5V, 0.10 M NaCl
Figure 19. Cyclic voltammogram of α-lipoic acid (sodium salt), -0.5 to -1.5 V, scan 3; a. 0.01M lipoate 1) in 0.10 M NaCl 2) no NaCl; b. 0.10 M lipoate 1) in 0.10 M NaCl 2) no NaCl
The influence of NaCl at two different concentrations, 10 mM and 100 mM, of α-lipoic acid (sodium salt) shown in Figure 19 clearly demonstrated the need to control the lipoic acid as well the electrolyte concentration in obtaining a variety of information on the electrochemical characteristics of this compound. The current oscillations observed were sensitive to the concentration of α-lipoic acid (sodium salt) as well as the electrolyte.
4. DISCUSSION
[image:19.596.183.414.71.248.2] [image:19.596.67.534.315.487.2]
differing concentrations of α-lipoic acid (sodium salt) in the presence and absence of the electrolyte, NaCl, or a phosphate buffer. We have chosen a wide range of reduction potentials to understand the dimerization and higher polymer formation processes. Even though mercury electrode is not normally utilized at anodic potentials due to its passivation, we have utilized anodic potentials also to gain some insight into the formation of lipoic acid S-oxides. Since the interaction of mercury with sulfur is well known with molecules such as cysteine and cystine, we had selected this system of electrode for comparison purposes.
A molecule that is less complicated than α-lipoic acid is cystine. Its reduction is characterized by an adsorption “prewave” and a later diffusion controlled reduction wave [16-22]. The prewave is attributed to the rapid or kinetically controlled reaction of the disulfide with mercury, leading to the breakage of the disulfide bond and subsequent formation of mercury cysteinate. Mercury cysteinate is then reduced. Later studies have attributed the reduction of the adsorbed cystine at the prewave and diffusion controlled reduction at more negative potentials [16].
One electron reduction of many dilsulfides including lipoic acid and the decay kinetics of the resulting radicals have been examined in detail [26].
A preadsorption wave at a high pH 11.44 and a post adsorption wave at low pH 4.15 were observed in the early polarographic studies of α-lipoic acid [27]. The single step observed was attributed to the two electron reduction:
LipS2 (lipoic acid) + 2H+ + 2 e- → Lip(SH)2 (dihydrolipoic acid)
A double wave was also observed in unbuffered supporting electrolytes where the second wave was attributed to the local increase in pH at the electrode surface.
Experiments with lipoic acid using platinum or glassy carbon electrode in phosphate buffer at pH 7.25 or 0.5 M HCl showed an irreducible oxidation reaction above + 1.1 V versus saturated calomel electrode (s.c.e) [13]. No reduction reaction was observed on cathodic polarization to –1.0 V. Also lipoic acid was inactive at potentials between +2.0V and –2.0 V versus s.c.e. with tungsten or zinc working electrode. With mercury on gold electrode, the current plateau at -0.95 V versus s.c.e. was directly proportional to the concentration of lipoic acid. This electrode was found to be not stable to anodic polarization and the reoxidation of the reduction product was investigated using a platinum electrode [13].
[image:21.596.55.547.71.291.2]
Figure 20. One electron reduction of lipoic acid, a, b, c; and lipoic acid diradical
It has been suggested that the radicals shown in Figure 20 b and 20 c can interact and produce the dimers shown in Figure 21 a, b, and c. It has also been suggested that the radicals shown in Figure 20b and c may react with lipoic acid within the oriented layer near mercury which may dimerize itself to form a tetramer at the highest surface coverages [13]. The suggested products on Hg/Au electrode, zinc amalgam, magnesium metal, and zinc metal were the tetramer, dimer (Figure 21 a), dimer (Figure 21 b), and dimer (Figure 21 c) respectively.
[image:21.596.59.543.468.753.2]
Figure 22. Polymerized lipoic acid
We have observed a small coating of the polymerized product on the platinum counter electrode at the end of several cyclic voltammetry or impedance measurements at lipoic acid concentrations greater than about 20 mM and at high cathodic polarizations.
Pulse radiolysis studies had demonstrated that the radicals, shown in Figure 20 a (LipS2.-),
derived from either oxidation of dihydrolipoic acid or reduction of lipoic acid are the same [24]. The reported pKa of lipoic acid radical of 5.85 [26] in comparison with that of lipoic acid of 4.7 suggests
that the negative charge in the radical is located in a sulfur atom [24]. These studies had also ruled out an interaction between the radical and its parent compound, dihydrolipoic acid to form a complex. It was also shown that the radical shown in Figure 20 a (LipS2.-) disappeared, in the absence of other
reactants, by second order kinetics.
2LipS2.- + 2 H+ → lipoic acid + dihydrolipoic acid
The anodic oxidation of α-lipoic acid at a glassy carbon electrode was found to be a one electron charge transfer, an irreversible process, and pH independent. The irreversible anodic peak observed at pH 6.9 in 0.1 M phosphate buffer and 100 μM α-lipoic acid at a scan rate of 25 mVs-1
was at +0.8V versus Ag/AgCl (saturated KCl). A decrease of the oxidation peak current was also observed for subsequent scans.
The formation of a diradical, thiyl free radical (shown in Figure 20d), by dissociation of the disulfide bond is suggested as a possible primary quantum conversion act of photosynthesis [25].
6. CONCLUSIONS
We have investigated the cyclic voltammetric behavior of the sodium salt of α-lipoic acid in the absence and presence of the background electrolytes, sodium chloride and phosphate buffer. Absorption data indicate deviations from Beer’s law above 10 mM suggesting strong solute-solute interactions at higher concentrations. In the active region, the cathodic current produced depends on the concentration of α-lipoic acid. The reduction of α-lipoic acid to dihydrolipoic acid was unaffected by the starting anodic potential. On the other hand, the current and potential for the reduction of lipoic acid S-oxide depended on the starting point of the anodic potential for the scan. The oxidation of dihydrolipoic acid is complicated by the formation of polymers of lipoic acid. The complete voltammogram in the potential range +2.0 to –2.0 V suggested the formation of thiolsulinates, and probably thiolsulfonates and dihydrolipoic acid. The dihydrolipoic acid (in dilute solutions) and the lipoic acid S-oxide produced reversible voltammograms. While scans 2 and 3 gave nearly the same current, scan 1 generally gave higher cathodic current especially in the presence of counter ions. At low concentrations, the cathodic current for the reduction of lipoic acid was much less than the current for the reduction of lipoic acid S-oxide. This trend is reversed with increasing concentrations of lipoic acid (sodium salt). The formation of dimers is suggested at low concentrations and higher polymers at higher concentrations of lipoic acid. Cathodic current oscillations are observed in the presence of counter ions and 10 mM α-lipoic acid. Higher pH produced less reduction currents. Both the phosphate buffer and sodium chloride produced anodic shifts in the reduction peak. Phosphate buffer gave a higher anodic shift in the reduction peak than sodium chloride. The cathodic peak current was higher with increasing concentrations of sodium chloride. Complications arise in the cyclic voltammetric behavior of this important molecule because of its tendency to form a variety of dimers and higher polymers as well as its tendency to form lipoic acid S-oxides of different types. These cyclic voltammetry data suggest the need to investigate the electrochemical behaviour of molecules without any background electrolytes, whenever possible, to gain information on solute-solvent interactions near the double layer. This is contrary to the accepted practice in electrochemistry. Finally caution is suggested in deciding on the dosage of oral supplements of lipoic acid because of its tendency to polymerize under reducing biological conditions.
References
1. M. S. Patel and L. Packer, “Lipoic Acid: Energy production, Antioxidant Activity and Health Effects”, CRC Press, Taylor & Francis Group, New York, (2008)
2. M. R. Baumgartner, H. Schmalle, and E. Dubler, Inorg. Chim. Acta., 252 (1996) 319 3. L. J. Reed, J. Biol. Chem., 276 (2001) 38329
4. L. J. Reed, B. G. DeBusk, I. C. Gunsalus, and C. S. Hornberger, Jr., Science, 114 (1951) 93
5. L. J. Reed, I. C. Gunsalus, G. H. F. Schnakenberg, Q. F. Soper, H. E. Boaz, S. F. Kernan, and T. V. Parke, J. Am. Chem. Soc., 75 (1953) 1267
6. L. Packer, E. H. Witt, and H. J. Tritschler, Free Radical Biology & Medicine, 19 (1995) 227 7. F. E. Stary, S. L. Jindal, and R. W. Murray, J. Org. Chem., 40 (1975) 58
10. O. Corduneanu, M. Garnett, and A. M. O. Brett, Anal. Letters, 40 (2007) 1763 11. M. N. Abbas and A. A. Radwan, Talanta, 74 (2008) 1113
12. S. Chevion, M. Hofmann, R. Ziegler, M. Chevion, and P. P. Nawroth, Biochemistry and Molecular Biology International, 41 (1997) 317
13. G. T. Rogers and D. N. Mallett, Bioelectrochem. and Bioenergetics, 10 (1983) 269 14. G. K. Ziyatdinova, L. V. Grigor’eva, and K. G. Budnikov, J. Anal. Chem., 64 (2009) 185 15. P. R. Brown and J. O. Edwards, J. Inorg. Nucl. Chem., 32 (1970) 2671
16. M.T. Stankovich and A.J. Bard, J. Electroanal. Chem., 75, 487 (1977)
17. I.R. Miller and J. Teva, J. Electroanal. Chem. and Interfacial Electrochem., 36 (1972) 157 18. W. Stricks and I.M. Kolthoff, J. Am. Chem. Soc., 75 (1953) 5673
19. I. M. Kolthoff and C. Barnum, J. Am. Chem. Soc., 62 (1940) 3061 20. I. M. Kolthoff and C. Barnum, J. Am. Chem. Soc., 63 (1941) 520
21. I. M. Kolthoff, W. Stricks, and N. Tanaka, J. Am. Chem. Soc., 77 (1955) 4739 22. C.V. Krishnan, M. Garnett, and B. Chu, Int. J. Electrochem. Sci., 3 (2008) 854 23. C.V. Krishnan, M. Garnett, and B. Chu, Int. J. Electrochem. Sci., 3 (2008) 873
24. W. C. Chan, P. C. Chan, and B. H. J. Bielski, Biochimica et Biophysica Acta, 338 (1974) 213 25. M. Calvin and J. A. Barltrop, J. Am. Chem. Soc., 74 (1952) 6153
26. M. Z. Hoffman and E. Hayon, J. Am. Chem. Soc., 94 (1972) 7950 27. B. Ke, Biochimica et Biophysica Acta, 25 (1957) 650
28. J. Šponar and M. Jirsa, Biochimica et Biophysica Acta, 29 (1958) 434
29. L. J. Reed, B. G. De Busk, I. C. Gunsalus, and G. H. F. Schnakenberg, J. Am. Chem. Soc., 73 (1951) 5920
30. L. J. Reed, Q. F. Soper, G. H. F. Schnakenberg, S. F. Kern, H. Boaz, and I. C. Gunsalus, J. Am. Chem. Soc., 74 (1952) 2383