Int. J. Electrochem. Sci., 7 (2012) 6580 - 6598
International Journal of
ELECTROCHEMICAL
SCIENCE
www.electrochemsci.org
Electrocatalytic Oxidation of Hydrazine Based on NiHCF@TiO
2Core- Shell Nanoparticles Modified GCE
S. Jancy Sophia, S. Devi and K. Pandian*
Department of Inorganic Chemistry, University of Madras, Guindy Campus, Chennai-600 025, India
*
E-mail: [email protected]
Received: 8 June 2012 / Accepted: 12 July 2012 / Published: 1 August 2012
A thin film of nickel hexacyanoferrate incorporated titanium oxide modified electrode has been successfully synthesized by depositing NiHCF in TiO2 nanoparticles which was synthesized by sol-gel
method. The DRS-UV, FT-IR, SEM, EDAX and XRD techniques were adopted to characterize the structure and properties of the nanocomposite (NiHCF @TiO2 NP). The NiHCF@TiO2 NPs modified
GCE shows an excellent electrocatalytic activity towards the oxidation of hydrazine in PBS. A calibration plot was constructed for quantitative detection of hydrazine using DPV technique with the concentration ranges from 0.2µM to 1µM. The detection limit (3σ) for hydrazine was found to be 1.1×10⁻⁷
M.
Keywords: Nickel hexacyanoferrate, TiO2 nanoparticles, Electrocatalysis, Detection of hydrazine.
1. INTRODUCTION
instant perm selective polymer coating technique was adopted to protect the metal hexacyanoferrate film against the loss.
It has been proposed that porous templates like mesoporous silica and porous carbon support can be used to stabilize the metal hexacyanoferrates. Recently metal hexacyanoferrate modified nanostructured materials have been reported as solid support to immobilize metal hexacyanoferrates. For examples nanosize metal oxides NiO [11], Fe2O3 [12], SiO2 [13], TiO2 [14] have been exploited as
scaffold to stabilize metal hexacyanoferrate and that can be used for the electrocatalytic oxidation and reduction applications. In the present investigation we employed titanium oxide nanoparticles as solid support to stabilize metal hexacyanoferrates. The metal hexacyanoferrate modified TiO2 electrodes
have been tested for the electrocatalytic oxidation of hydrazine. The deposition of metal hexacyanoferrate by various methods including photochemical deposition [14], sequential deposition [15] and electrochemical deposition method [16] has been reported in the past. For the first time we proposed to use the NiHCF modified titanium oxide modified GCE for the electrocatalytic oxidation of hydrazine. TiO2 is a promising material for such studies by virtue of its optical transparency, good
biocompatibility, environmental safety and reasonable electrical conductivity. Nano-TiO2 has been
widely used as a promoter for the investigation of the direct electrochemistry of redox proteins, or as a substrate for the preparation of enzyme electrodes or biosensors [17-19].
Hydrazine is a strong reducing agent used as an oxygen scavenger for corrosion control in boilers and hot-water heating systems [20]. The hydrazine has adverse health effect such as brain [21], DNA damage [22] and creation of blood abnormalities and irreversible deterioration of nervous system [23]. The maximum recommended level of hydrazine in trade effluent is 3.1 ×10⁻⁵M [24]. Because of hydrazine’s industrial and pharmacological significance, a sensitive method is required for its reliable measurement. Methods for the determination of hydrazine which have been reported in the literature are spectrophotometric [25, 26], potentiometric [27] and fluorimetric [28]. Moreover various chemically modified electrodes have been applied in the determination of hydrazine, including cobalt phthalocyanine modified carbon paste electrodes [29], inorganic mixed valent Prussian blue film-coated electrode [30], and a cobalt hexacyanoferrate modified glassy carbon electrode [31], NiHCF modified graphite electrode [32] and CCEs modified by NiHCF [33] have also been applied for the determination of hydrazine.
Metal hexacyanoferrate modified titanium oxide nanocomposite film can be used for photochromic applications. The deposition of metal hexacyanoferrate can be achieved by a variety of methods [23]. Owing to the potential application of the PB –TiO2, the other metal hexacyanoferrates
modified titanium oxide is in great deal of use in recent days. The schematic diagram for the surface modification of titanium oxide with nickel hexacyanoferrate is shown below;
The present system explains about the incorporation of metal hexacyanoferrate on the surface of titanium oxide nanoparticles by sol- gel method and also includes a study on its application in electrocatalytic oxidation of hydrazine. The NiHCF-TiO2 nanocomposite can be utilized for the
2. EXPERIMENTAL SECTION 2.1. Chemicals
Titanium (IV) tertrabutoxide was purchased from Sigma Aldrich chemicals Pvt. Ltd, USA. Hydrazine hydrochloride, nickel chloride and K3Fe(CN)6 were received from commercial sources. All
other chemicals used were obtained from commercial sources.
2.2. Instrumental methods
2.2.1. UV-Visible spectrophotometer
Diffuse reflectance spectra were recorded on a Lambda 35 spectrophotometer (Perkin
Elmer, USA) equipped with 5 cm diameter integrating sphere. Spectrally pure barium sulphate was used as a reference and a matrix for sample dilution.
2.2.2. FT-IR Spectroscopy
2.2.3. Powder X-ray diffraction analysis
The crystallographic information of the obtained NiHCF@TiO2NPs was investigated by XRD.
The XRD patterns with diffraction intensity versus 2θ were recorded in a JSO Debye Flex 2002 Seifert diffractometer with Cu Kα radiation (λ=1.5406 Å) from 25 to 80° at a scanning speed of 1° min-1
. X-ray tube voltage and current were set at 40 kV and 40 mA, respectively.
2.2.4. Scanning Electron Microscopy
Morphological and structural investigations were carried out with field emission JEOL-JSM-6360 instrument, USA. In a typical measurement, a small amount of sample powder was adhered onto a copper stub using double-sided carbon tape. The sample was then sputtered with platinum to reduce charging effect.
2.2.5. Cyclic voltammeter
The CV experiment was carried out using CHI 660A electrochemical instrument, USA and Gamry model 330, USA. A three electrodes system with a single compartment cell system was used for the electrochemical studies. A platinum wire and a glassy carbon electrode (3 mm dia) were used as counter and working electrode respectively. A silver wire is used as quasi-reference electrode whose potential was calibrated against Ag/AgCl (satd KCl). All potentials were measured against Ag wire reference electrode. All solutions were degassed using nitrogen gas before doing all experiments.
2.3. Preparation of TiO2 nanoparticles
Titanium (IV) butoxide (7 ml) was added drop wise into 20 ml of distilled water with magnetic stirring at room temperature for 30 minutes. The white precipitate was washed several times with distilled water and then dried at 100ºC for 10 hours. The resulting white powder was calcined in an electrical furnace at 450ºC for an hour to get the TiO2 nanoparticles [34].
2.4. Synthesis of NiHCF@ TiO2 NPs
25ml of 4mM K4Fe(CN)6 was added to 25ml 4mM NiCl2.6H2O (pH 1.0) solution under
vigorous stirring. A yellowish brown precipitate of NiHCF was formed immediately. NiHCF was collected and centrifuged two times by washing with water to remove the dissolved salts and other impurities. A known amount of powdered TiO2 nanoparticles were dispersed in the above solution and
2.4. Preparation of NiHCF@ TiO2 NPs Modified GCE
The glassy carbon (GCE) surface was polished to a mirror-like smoothness with emery paper and then sonicated in ethanol and distilled water for 5 minutes. Followed by drying with a stream of high purity of nitrogen gas, the GC substrate was modified with the paste of NiHCF@ TiO2 NPs
suspension and then dried. A NiHCF@ TiO2 NPs coated GC electrode was thus prepared for
measurements.
3. RESULTS AND DISCUSSION
3. 1. Morphological study of NiHCF and TiO2 nanoparticles
A B
C D
[image:5.596.58.537.279.693.2]
A B
C D
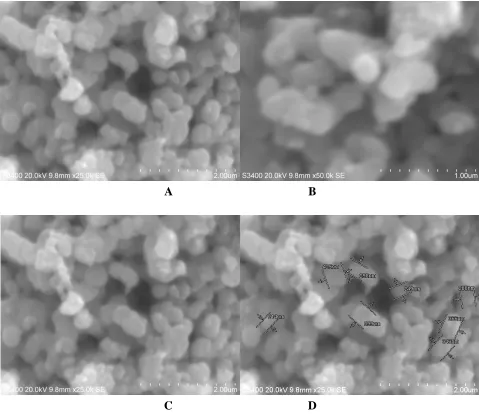
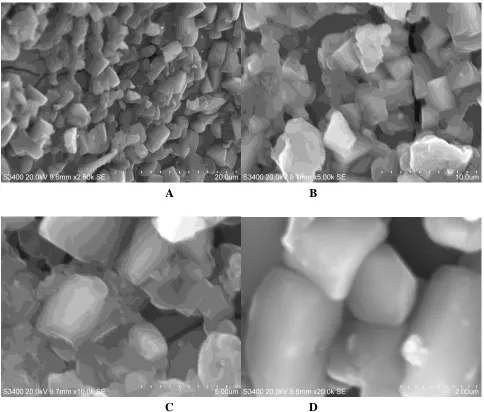
Figure 2. SEM morphologies of NiHCF@TiO2 with different magnifications(a - d)
The SEM images of TiO2 nanoparticles and NiHCF modified titanium oxide are shown in Fig
(1, 2). The TiO2 particles are spherical in shape with size ranging from 100 to 200 nm. The size
distribution is random in nature because of the aggregation of titanium oxide nanoparticles. Fig. 2 shows the SEM images of NiHCF modified TiO2 nanoparticles with different size magnifications. The
particles of NiHCF were grown over the curved surfaces of TiO2 and then later form a new dimension
of cubic structured NiHCF@ TiO2 NPs. EDAX mapping studies were carried out to study the
distribution of each element present in the titanium oxide nanoparticles matrix. The average composition of each element present in the system can also be obtained from analysis. The resulting EDAX images and EDAX graph are shown in Fig.S1 and S2. On certain selected areas of TiO2
[image:6.596.57.541.68.480.2]
oxide nanoparticles is given in the table. From the graph, percentage composition of each elemental composition can be calculated.
A B
C D
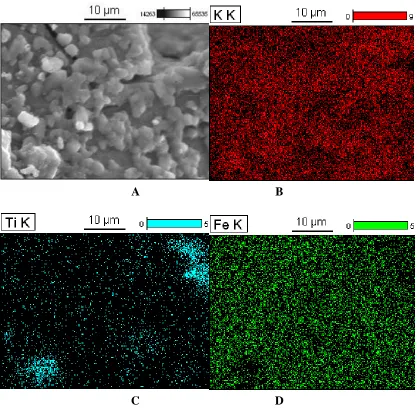
Figure 3. EDAX mapping of NiHCF@TiO2 NPs ( b for K, c for Ti, d for Fe)
Figure 3 describes the EDAX mapping of NiHCF modified TiO2 in which the composition,
stoichiometry and distribution of each element can be easily identified. From the graph it is confirmed that NiHCF is incorporated on the surfaces of TiO2. The elemental composition of the NiHCF
modified titanium oxide is shown in Fig. 4. The presence of Ni, K, Fe and Ti are clearly highlighted in that graph and the relative intensity of the each element present in the nanocomposite is given in the table.
[image:7.596.91.508.131.539.2]
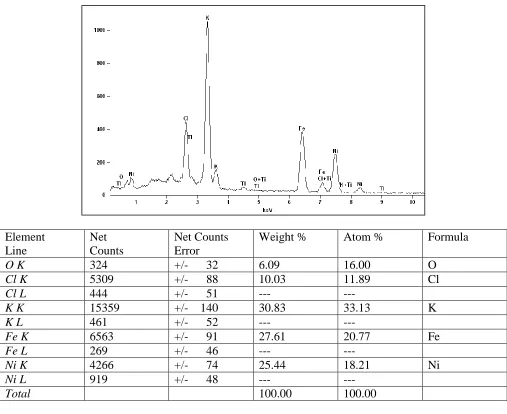
of the films was determined using EDAX measurements. Typical EDAX analysis of NiHCF modified TiO2 are shown in Fig 4.
Element Line
Net Counts
Net Counts Error
Weight % Atom % Formula
O K 324 +/- 32 6.09 16.00 O
Cl K 5309 +/- 88 10.03 11.89 Cl
Cl L 444 +/- 51 --- ---
K K 15359 +/- 140 30.83 33.13 K
K L 461 +/- 52 --- ---
Fe K 6563 +/- 91 27.61 20.77 Fe
Fe L 269 +/- 46 --- ---
Ni K 4266 +/- 74 25.44 18.21 Ni
Ni L 919 +/- 48 --- ---
Total 100.00 100.00
Figure 4. EDAX graph of NiHCF@TiO2 NPs
Although the NiHCF modified TiO2 exhibit two strong peaks corresponding to Kα peaks of
Fe (6.402keV) and K (3.311keV).The nickel containing membranes shows three Kα peaks originating from Ni (7.204 keV), Fe and K respectively. The weight percentage ratio of Ni, Fe and K present in NiHCF@TiO2NP is 1:1.09:1.21.The weight percentage of Ti is negligible because of the encapsulation
of TiO2NP by NiHCF. In the case of nickel containing membranes, the analysis is more difficult. The
[image:8.596.45.552.127.541.2]
300 400 500 600 700 800
20 30 40 50 60 70 80
Tr
a
n
sm
itta
n
ce
Wavelength (nm)
a
b
c
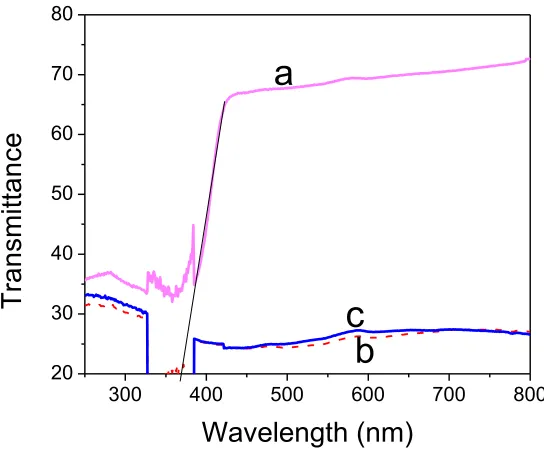
[image:9.596.151.423.98.323.2]3.3. DRS UV-Visible spectrum analysis
Figure 5. DRS of a) TiO2NPs b) NiHCF c) NiHCF@TiO2 NPs
The DRS UV-Visible spectrum of TiO2 NPs and NiHCF@ TiO2 NPs was recorded using
diffusive reflectance spectral mode and the resulting spectra are shown in Fig. 5. The band gap energy can be calculated from the graph. A tangent line drawn from the intercept of the TiO2 graph and
cutting point at the X axis indicate the band gap energy of titanium oxide. It was observed at about 350 nm which is closed to 3.2 eV. The edge absorption is slightly extended towards visible region. The absorption spectrum of TiO2 at 400 nm is due to the charge transfer from the valence band (mainly
formed by 2p orbitals of the oxide anions) to the conduction band (mainly formed by 3d t2g orbitals of
the Ti4+ cations) [36, 37]. On the other hand by the addition of NiHCF onto the TiO2 substrates the
band gap energy is completely red shifted. Thus the composite film is absorbing the whole visible region. For comparison the NiHCF spectrum also recorded and the resulting spectra are shown in Fig. 5. These results are consistent with the previously reported results.
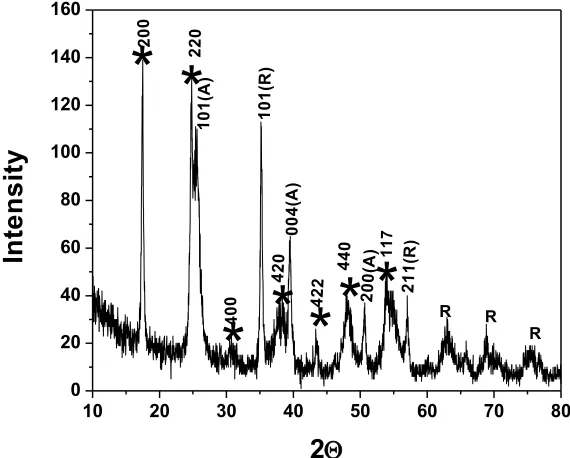
3. 4. XRD analysis
The X-ray diffractogram of NiHCF@ TiO2 NPs was recorded to determine the crystalline form
of NiHCF modified TiO2NP. The peaks marked as “R” and “A” represent the rutile and anatase
phases of TiO2 NPs, whereas the stars indicate the presence of NiHCF on the surface of titanium oxide.
It can be seen that for all the samples there are seven typical peaks with 2θ values of 17.50°, 25.49°, 31.12°, 37.93°, 43.15°, 47.81º and 53.66°, corresponding to (200), (220), (400), (420), (422), (440) and (117) crystal planes of NiHCF, respectively. The peaks with 2θ values of 35.19º, 56.77º, 62.98º and 68.80, corresponding to (101), (211), (002) and (301) crystal planes of pure rutile TiO2. The peaks with
10 20 30 40 50 60 70 80
0 20 40 60 80 100 120 140 160
*
*
*
*
*
*
In
te
n
s
it
y
2
1 0 1 (A ) 0 0 4 (A ) 2 00 (A) 200 220 400 440 422 420 117 2 1 1(R ) 1 0 1(R )*
R RR
4000 3500 3000 2500 2000 1500 1000 500
20 30 40 50 60 70 T ra n s m it ta n c e (% )
Wavenumber(cm-1)
3653
2167
2100
1614
1165 595 547
3433
of TiO2. Fig. 6 displays the XRD pattern of NiHCF@ TiO2 NPs and the TiO2 NPs is found to be a
mixture of 25% anatase and 75% rutile. In order to synthesis anatase rich form of titanium oxide the samples must be heated above 500oC. Because of insufficient heating of the TiO2 NPs, the rutile form
[image:10.596.139.424.172.401.2]of titanium oxide phase is visible in the XRD pattern [38, 39].
Figure 6. XRD pattern of NiHCF@TiO2 NPs
3. 5. FT-IR spectral analysis
[image:10.596.148.424.494.722.2]
0.0 0.2 0.4 0.6 0.8 1.0 1.2 1.4
-15 -10 -5 0 5 10 15 20
30 40 50 60 70 80 90 100
-1.5 -1.0 -0.5 0.0 0.5 1.0 1.5 C u rr e n t A
Scan rate (v), mV/s
Ip,a Ip,c
C
u
rr
e
n
t(
A
)
Potential(V) vs Ag Wire
a d
The FT-IR spectral behavior of NiHCF@TiO2 NPs is depicted in Fig. 7. The two major peaks
at 2167 and 2100 cm-1 are assigned for CN stretching vibration of -CN bound with metal ion within the lattice matrix viz. FeIII-CN-NiII and FeII-CN-NiII environment respectively. The peaks at 595 and 547 cm-1 are attributed to the formation of Fe-C≡N-Ni structure. The bands at 3653 and 3433 cm-1 are corresponding to the stretching vibrations of the liberating and the associating O-H in NiHCF@TiO2
NPs. TiO2 NPs of large surface area might offer more active sites to absorb water and generate
hydroxyl groups. The intense band below 1200 cm-1 is due to Ti-O-Ti vibrations [40].
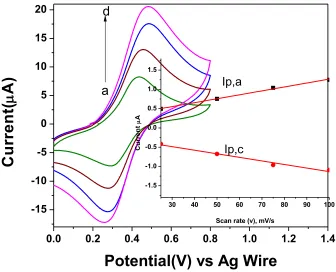
[image:11.596.129.465.259.531.2]3.6. Electrochemical behavior of TiO2-NiHCF nanocomposite
Figure 8. Cyclic voltammograms of NiHCF@TiO2 NPs obtained at various scan rates (25,50,75 and
100mV s-1). The inset shows the plot of current against scan rate.
A quasireversible CV is obtained for the NiHCF modified TiO2 system in 0.1M PBS medium.
Here the electron transfer occurs from FeIII to FeII redox centres to give a broad peak response. The electron transfer at the iron centre has taken place at less positive potential than the redox behavior of Ni centre. The immobilized hexacyanoferrate ≡Ti+[Fe(CN)6]3- was able to adsorb transition metal ions,
resulting in the formation of intervalence complexes ≡Ti+{M[Fe-(CN)6]}- which also adhered strongly
to the surface. The shape of the voltammogram is characteristic of a diffusion-controlled process in this system, i.e. the electroactive species adsorbed on the ≡TiO2 surface is desorbed from the surface
0.0 0.1 0.2 0.3 0.4 0.5 0.6 0.7 0.8
0 -10 -20 -30 -40
C
u
rr
e
n
t
(
A
)
Potential Vs. Ag wire
C
B
A
[image:12.596.130.435.341.587.2]depends on two main factors. The first is the strength of interaction of the ≡Ti+ lewis acid site with [Fe(CN)]3- species. The reaction of Ti+[Fe(CN)6]3- with the Ni2+ transition metal and the
polymerization process implies a relative high mobility of the species bonded on the surface since, in the present case, it is assumed that the electroactive species agglomerates on the surface as isolated islands. The second is the nature of the Fe-CN-Ni bond, which governs the ease of formation of the zeolitic cage.
The cyclic voltammogram at various scan rates were recorded as in Fig. 8. With the increase of scan rates, the cathodic and anodic currents were increased. The peak currents were linearly proportional to the scan rates in the range between 25 - 100 mV. A linear correlation obtained between peak currents, and the scan rate (I p,a and I p,c vs υ )is a characteristic of the absence of a diffusion controlled process and also it is a characteristic of strongly bound species during the redox process. This result is consistent with previously reported one [40].
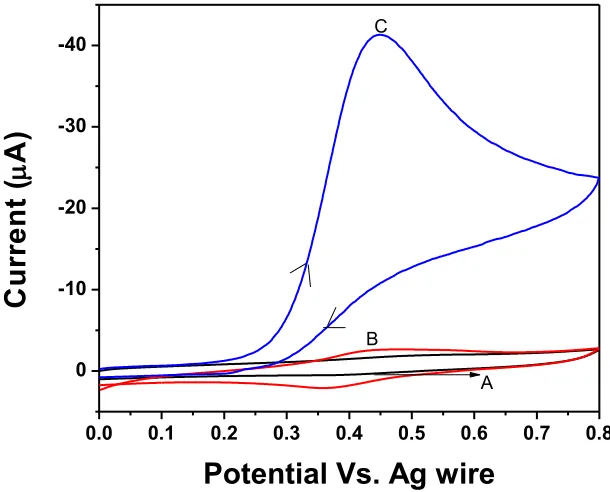
3.3. Electrocatalytic oxidation of hydrazine
Figure 9. Cyclic voltammogram of a) bare GCE, b) NiHCF@TiO2 NPs modified GCE c) addition of
hydrazine on NiHCF@TiO2 NPs /GCE in N2 saturated 0.1 M PBS (pH 8.0; Scan rate 50mV s -1
).
Figure 9 depicts the cyclic voltammetric responses of bare GCE (curve a), NiHCF@TiO2 NPs
(curve b) and the electrochemical oxidation of 0.1M hydrazine at the modified NiHCF@TiO2 NPs
-0.2
0.0
0.2
0.4
0.6
0.8
1.0
0.4 0.6 0.8 1.0 1.2 1.4 1.6 1.8 2.0 2.2
80 85 90 95 100 105 110 115
C
u
rr
e
n
t(
A
)
Conc (M)
C
u
r
r
e
n
t
(
A
)
Potential (V) vs. Ag wire
-20
0.45 V vs. Ag wire and the observed peak current was almost double when the GCE is modified NiHCF modified TiO2 nanoparticles.
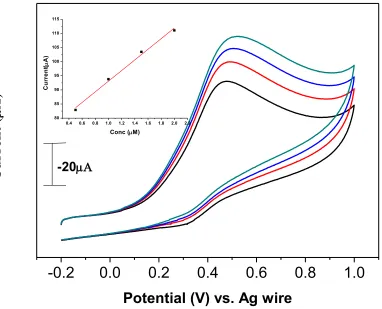
Figure 10. Cyclic voltamograms of the applications of various concentrations of hydrazine using a NiHCF@TiO2 NPs modified GCE in N2 saturated 0.1 M PBS.(Inset: analytical curve of the
anodic peak for the determination of hydrazine using NiHCF@TiO2 NPs modified GCE;
pH8.0; scan rate 50mV s-1)
As shown, at the NiHCF@TiO2 NPs (curve b), the peak potential was about + 0.44V vs. Ag
wire, while on the addition of hydrazine (curve c); peak potential is about + 0.45V vs. Ag wire. As the catalytic peak occurred near the formal potential of NiHCF@TiO2 NPs redox couple, it is reasonable
to ascribe that the redox couple catalysed hydrazine oxidation. Similarly, while considering the oxidation of hydrazine at the NiHCF@TiO2 NPs (curve c), a dramatic enhancement of the anodic peak
current at the modified electrode was observed. In other words, the data clearly shows that the combination of TiO2 nanoparticles and NiHCF definitely improve the characteristics of hydrazine
[image:13.596.87.469.141.450.2]
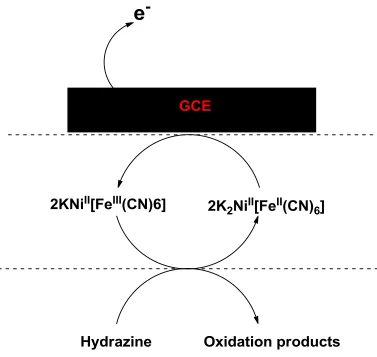
Scheme 1. Mechanism of electrocatalytic oxidation of hydrazine at NiHCF@TiO2NPs modified GCE
Figure 10 shows the cyclic voltamograms obtained for the oxidation of 50-200µl of 0.1M hydrazine at the NiHCF@TiO2NPs modified GCE. The graph illustrates the calibration curve of the
anodic peak current as a function of concentration of hydrazine for NiHCF@TiO2NPs (shown in inset
Fig.10).
The modified electrode showed a linear response of 0.5 - 2 µM of hydrazine with a correlation coefficient of r = 0.990.
3.7. Calibration plot and Deduction Limit
Differential pulse voltammetry (DPV) was used to determine the concentration of hydrazine by constructing a calibration plot. Voltammogram clearly showed that the plot of peak current versus hydrazine concentration constituted a linear segment with slope (slope: 0.1582 μA. for the linear segment), corresponding to the different concentration of substrate from 0.2µM to 1µM (Fig. 11). The detection limit (3σ) for hydrazine in the above range region was found to be 1.1 × 10⁻⁷
[image:14.596.111.488.78.435.2]
0.0 0.2 0.4 0.6 0.8 1.0
-0.5 -1.0 -1.5 -2.0 -2.5 -3.0 -3.5 -4.0 -4.5
20 40 60 80 100
10 15 20 25 P ea k C u rr en t, A
Conc. of Hydrazine (M)
C u rr e n t( A )
Potential(V) vs Ag Wire
Figure 11. Differential pulse voltammograms of the NiHCF@TiO2 NPs in 0.1 M PBS (pH 8.0)
containing different concentrations of Hydrazine, from inner to outer correspond to 0.2, 0.4, 0.6,0.8, 1.0 μM of Hydrazine. Inset: Plot of the peak currents as a function of concentration
Table 1. A comparison of electrocatalytic detection of hydrazine using various types of modified electrode systems.
Electrode System pH Potential(V)vs.
Ag/AgCl(satd KCl)
Conc. Ranges Ref
CeHCF/Mesoporous Carbon
1.5 +0.34 1 - 163 µM 42
Ni(II)-bicalein complex/MWCNT
13 +0.65 2.5µM -
0.2mM
43
Pd/CILE 7 -0.02 5 – 800 µM 44
Pd/CNT 1 +0.27 2.5 -700 µM 45
CoHCF@TNT 6.9 +0.29 0.5 - 2.5 mM 37
ZnO 7 +0.35 0.1- 1µM 46
ZnO/MWCNT 7.4 +0.30 0.5 - 1800µM 47
Pd/TiO2-NTs - +0.32 - 48
Pd/WO3 - - - 49
[image:15.596.148.423.73.291.2] [image:15.596.46.555.425.759.2]
3.8. Determination of hydrazine in water samples
In order to check the validity of the proposed method for the determination of hydrazine, four water samples from different sources were spiked with 1 × 10⁻³
[image:16.596.43.561.217.382.2]M of hydrazine and were analyzed under optimized conditions. The results are summarized in Table 2.
Table 2. Result of recovery test for quantitative determination of hydrazine in different water sources spiked with a known quantity of hydrazine.
Samples Added/10-3M Found/10-4M Recovery (%)
Distilled water 1.00 1.04 104 Drinking water 1.00 0.98 98 Industrial waste 1.00 1.03 103 Water*
River water 1.00 1.01 101 *The industrial effluent contained no hydrazine
3.9. Interference studies
The interfering effects of common anions and cations, which may coexist with hydrazine, were evaluated. This effect was investigated by adding a known amount of the test species to the hydrazine solution in amounts ranging up to 10 µg/ml. The interference of various species on the determination of hydrazine (0.1 mM) was studied under optimum conditions. The tolerance limit was defined as the maximum concentration of the interfering species that cause an error less than 5% for determination of 0.1 mM hydrazine. The maximum tolerable concentration ratio (ratio denotes the ratio of the concentration between the interfering substance and hydrazine) for Na+, NH4+, CH3COO-,
PO42-, glucose, lactose, F-, Cl- and Br- is 600 and 70 for Ca2+ and Mg2+.
4. CONCLUSION
the electrochemical oxidation of hydrazine in PBS. From the results it was found that the oxidations of hydrazine occur at less positive potential at the surface of the NiHCF@TiO2 NPs when compared to
the bare GCE. The proposed method can be applied for the electrochemical detection of hydrazine in water sources and the catalytic peak currents were calculated using DPV and it was found to be linearly dependent on the hydrazine concentrations and the detection limit for hydrazine was found to be 1.1 × 10⁻⁷
M.
References
1. V. D. Neff, J. Electrochem. Soc., 125 (1978) 886.
2. K. Itaya, N. Shoji and I. Uchida, J. Am. Chem. Soc., 106 (1984) 3423.
3. D. R. Shankaran and S. S. Narayanan, Russ. J. Electrochem., 37 (2001) 1149. 4. D. R. Shankaran and S. S. Narayanan, Fresen. J. Anal. Chem., 364 (1999) 686.
5. Q.L. Sheng, K. Luo, J.B. Zheng and H. F. Zhang, Biosens. Bioelectron., 24 (2008) 429 6. H. Yu and J. B. Zheng, Chin. J. Chem., 25 (2007) 503.
7. Y. Liu, Z.Y. Chu, Y. N. Zhang and W. Q. Jin, Electrochim. Acta. 54 (2009) 7490.
8. M. H. Yang, J. H. Jiang, Y. S. Lu, Y. He, G.L. Shen and R.Q. Yu, Biomaterials, 28 (2007) 3408. 9. M. S. Lorraine and K. Theodore, J. Electrochem. Soc., 130 (1983) 396
10.A. Abbaspour and M.A. Kamyabi, J. Electroanal. Chem., 576 (2005) 73 11.S. M. Chen, C. Y. Liou and R. Thangamuthu, Electroanalysis, 19 (2007) 2457.
12.H. Heli, S. Majdi, N. Sattarahmady and A. Parsaei, J Solid State Electrochem., 14 (2010) 1637. 13.S. Zamponi, A. M. Kijak, A. J. Sommer, R. Marassi, P. J. Kulesza and J. A. Cox, J Solid State
Electrochem., 6 (2002) 528.
14.H. Tada, Y. Saito and H. Kawahara, J.Electrochem. Soc., 138 (1991) 140.
15.D. Ivekovic¸ A. Gajovic¸ M. Ceh, and B. Pihlar, Electroanalysis, 22 (2010) 2202. 16.R. Ojani, J. B. Raoof and B. Norouzi, Electroanalysis, 20 (2008)1996
17.P.A. Fiorito, C.M.A. Brett and S.I. C. de Torresi, Talanta, 69 (2006) 403 18.K. J .McKenzie, F. Marken and M. Opallo, Bioelectrochemistry, 66 (2005) 41
19.H. M. Cao, Y. H Zhu, L. H Tang, X. L Yang and C. Z. Li, Electroanalysis, 20 (2008) 2223 20.H. W. Schessl, K. Othmer (Eds), Encyclopedia of Chemical Technology, fourth ed., Wiley
Interscience, 13 (1995) 560.
21.E. H. Vernot, J. D. Macewen, R. H. Bruner, C. C. Haus and E. R. Kinkead, Fund. Appl. Toxicol., 5 (1985) 1050.
22.J. W. Mo, B. Ogorevc, X. Zhang and B. Pihlar, Electroanalysis, 12 (2000) 48. 23.S. Amlathe and V. K. Gupta, Analyst, 113 (1988) 1481.
24.M. I. Evgenev, S. Y. Garmonov, I. I. Evgeneva and V. V. Ugrinich Trebinskii, J. Anal. Chem., 53 (1998) 240.
25.P. O. Barrales, A. M. Diaz, M. I. P. Reguera and L. F. C. Vallvey, Anal. Chim. Acta., 353 (1997) 115.
26.M. George, K. S. Nagaraja, and N. Balasubramanian, Talanta, 75 (2008) 27. 27.J. W. Mo, B. Ogorevc, X. J. Zhang and B. Pihlar, Electroanalysis, 12 (2000) 48. 28.A. A. Ensafi and B. Rezaei, Talanta, 47 (1998) 645.
29.K. M. Korfhage, K. Ravichandran and R. P. Baldwin, Anal. Chem., 56 (1984) 1514. 30.W. Hou and E. Wang, Anal. Chim. Acta., 257 (1992) 275.
31.D. R. Shankaran and S. S. Narayanan, Russ. J. Electrochem., 38 (2002) 987. 32.S.J. R. Prabakar and S. S. Narayanan, J. Electroanal. Chem. 617 (2008)111.
35.W. Jin, A. Toutianoush, M. Pyrasch, J. Schnepf and H. Gottschalk, J. Phys. Chem. B, 107 (2003) 12062
36.W. Rammensee, B. T. Szacilowski, W. Macyk and G. Stochel, J. Mater. Chem., 16 (2006) 4603. 37.S. Jancy Sophia, S. Devi and K. Pandian, ISRN Analytical Chemistry, 2012 (2012) 8 pages. 38.Q. Xiao, J. Zhang, C. Xiao, Z. Si and X. Tan, Solar Energy, 82 (2008) 706.
39.L. R. Cumba, U. D. O. Bicalho, D. R. Silvestrini and D. R. D. Carmo, Int. J. Chem., 4 (2012) 66. 40.L. T. Kubota and Y. Gushikem, J. Electroanal. Chem., 362 (1993) 219.
41.M. M. Ardakani , H. Rajabi , H. Beitollahi, B. B. F. Mirjalili, A. Akbari and Ni. Taghavinia, Int. J. Electrochem. Sci., 5 (2010) 147.
42.N. R. Stradiotto, S. S. L. Castro, R. J. Mortimer and M. F. De Oliveira, Sensors, 8 (2008) 1950. 43.L. Zheng and J. F. Song, Talanta, 79 (2009) 319.
44.N. Maleki, A. Safavi, E. Farjami and F. Tajabadi, Anal. Chim. Acta, 611, (2008) 151. 45.N. Maleki, A. Safavi, E. Farjami, F. Tajabadi, Anal. Chim.Acta., 611 (2008) 151.
46.S. K. Mehta, K. Singh, A. Umar, G. R. Chaudhary ,S. Singh, Electrochim. Acta, 69 (2012) 128. 47.C. Zhang , G. Wang , Y. Ji , M. Liu, Y. Feng, Z. Zhang , B. Fang, Sens. and Actuators B, 150
(2010) 247.
48.B. Dong, B. L. He, J. Huang , G. Y. Gao, Z. Yang, H. L. Li, Journal of Power Sources 175 (2008) 266.
49.W. Ye, B. Yang, G. Cao, L. Duan and C. Wang, Thin solid films, 516 (2008) 2957.
Supporting Information:
A B
C D
[image:18.596.155.443.388.679.2]
Quantitative results Element
Line
Net Counts
Net Counts Error
Weight % Atom % Formula
O K 354 +/- 53 20.26 43.20 O
Ti K 17883 +/- 143 79.74 56.80 Ti
Ti L 1062 +/- 58 --- ---
[image:19.596.74.520.77.386.2]Total 100.00 100.00
Figure S2. EDAX graph of TiO2NPs