Int. J. Electrochem. Sci., 10 (2015) 10659 - 10667
International Journal of
ELECTROCHEMICAL
SCIENCE
www.electrochemsci.org
Simultaneous Determination of Hydroquinone, Catechol and
Resorcinol at Poly(3-Thiophenemalonic Acid) Modified Glassy
Carbon Electrode
Guangri Xu*, Bo Tang, Shuke Jing, Jianzhong Tao
Department of Chemistry and Chemical Engineering, Henan Institute of Science and Technology, Xinxiang 453003, China
*
E-mail: xugr@hist.edu.cn
Received: 30 July 2015 / Accepted: 28 September 2015 / Published: 4 November 2015
Electrochemical characteristics of hydroquinone (HQ), catechol (CC) and resorcinol (RC) were investigated at glassy carbon electrode (GCE) modified with poly(3-thiophenemalonic acid) by cyclic voltammetry (CV). The effect of key parameters on the detection of three substances was evaluated at the modified electrode, such as immerging time, scanning rate and so on. Under optimum conditions, the catalytic oxidation currents increased linearly with increasing the concentration of HQ, CC and RC in the ranges of 7.81~500 μM, 3.91~500 μM and 15.6~500 μM with detection limits of 7.81 μM, 3.91μM and 15.6 μM, respectively, by differential pulse voltammetry (DPV). In addition, the modified electrodes exhibited good sensitivity, selectivity, reproducibility and stability. The modified electrode can be used for the selective detecting the hydroquinone, catechol and resorcinol.
Keywords: Poly(3-thiophenemalonic acid), Hydroquinone, Catechol, Resorcinol, Glassy carbon electrode
1. INTRODUCTION
Hydroquinone (HQ), Catechol (CC) and resorcinol (RC) are isomers of dihydroxybenzene. They are toxic, undegradable materials and can cause serious environmental pollution [1,2]. They are also important indicators for environmental monitoring [3,4]. Because of their similar chemical structure and difficulty in separation and detection simultaneously, it is very important to search for simple, stable and rapid analysis of those dihydroxybenzene isomers.
takes quite a long period of time [9]. Moreover, the actual effect of resorcinol on the chemiluminescence reaction is still unknown and affects the detection of HQ and CC [7]. Lately, electrochemical techniques, especially voltammetric methods, due to having more simplicity and selectivity are preferable over chromatographic and optical methods and more feasible for miniaturization of analysis [10-13]. Till now, high degree of overlapping in voltammetric responses makes their discrimination highly difficult for most conventional solid electrodes [12,14,15]. Also, the use of unmodified electrodes for the detection of these compounds also has a number of limitations such as slow electron transfer kinetics, low sensitivity and reproducibility over a wide range of solution compositions. Hence, it is pertinent to explore and develop a reliable method to fabricate modified electrodes with electron transfer mediators. To address this obstacle, polymer-modified electrodes have been widely used for selective electrochemical detection to take advantage of chemical stability and feasibility of selectivity/sensitivity control by polymer films, which can be homogeneously deposited electrochemically in general onto a conventional electrode [16, 17]. Lots of reports were found to prepare a thin layer of conducting polymers on GCE for sensing HQ and CC with brilliant cresyl blue [18], p-aminobenzoic acid [19], diallyldimethylammonium chloride [20] and crystal violet [21].
In this paper, a poly(3-thiophenemalonic acid) modified glassy carbon electrode (PTAGCE) was used for detecting HQ, CC and RC simultaneously. To our knowledge, it has not been reported yet for the fabrication of electrochemical sensor or biosensor. Three substances exhibited good electrochemical behavior and the modified electrode showed the advantages of good selectivity, sensitivity and reproducibility.
2. EXPERIMENTAL
2.1 Materials
3-thiophenemalonic acid was purchased from ACROS ORGANICS (New Jersey, USA). HQ, CC, RC, NaH2PO4 and Na2HPO4 were purchased from Sigma-Aldrich. All reagents were of analytical
reagent grade and used as received unless otherwise noted. Phosphate buffer solution (PBS) was prepared from stock solutions of 0.1 M NaH2PO4 and 0.1 M Na2HPO4. All solutions were prepared
using doubly distilled water obtained from a Milli-Q water purifying system (18 MΩ·cm). All experiments were performed at room temperature.
2.2 Instruments
(DPVs) were obtained by scanning the potential from -0.2 to 0.4 V with the following pulse amplitude: 100 mV·s-1
, pulse width: 2 ms, and pulse period: 1000 ms. All electrochemical experiments were performed in 0.1 M PBS (pH 7.0) unless otherwise noted.
2.3 Preparation of modified electrodes
The GCEs were consecutively polished with aqueous alumina slurries of 1.0, 0.3, and 0.05 μm (Buehler Inc, Lake Bluff, ILL, USA) until a mirror finish. Then the polished electrodes were subject to sonication in anhydrous ethanol and water, respectively and dried at room temperature [22]. PTAGCEs were prepared with electrochemical anodization at a constant potential of +1.8 V for 400 s in 0.1 M PBS (pH 6.8) followed by sweeping the potential between -0.6 and +1.0 V in 0.1 M PBS (pH 6.8) containing 1 mM 3-thiophenemalonic acid for 10 cycles. As shown in figure 1, with the increase in the number of sweeping cycle, a pair of redox peak current nearby 0 V increased gradually until the peak is stable to prove that the 3-thiophenemalonic acid molecules were gradually electropolymerized onto the GCE surface. The obtained PTAGCEs were thoroughly washed with water, transferred to 0.1 M PBS (pH 6.8), and scanned in the same potential range until a stable voltammogram was obtained to ensure the complete removal of unreacted monomer.
1.0 0.5 0.0 -0.5
-150 -100 -50 0 50 100 150 200
I/
A
[image:3.596.138.435.399.619.2]E/V vs. Ag/AgCl
Figure 1. CVs of electropolymerization of 3-thiophenemalonic acid at GCE.
3. RESULTS AND DISCUSSION
3.1 CVs of HQ, CC and RC at PTAGCE
redox behaviors of HQ, CC and RC were clearly quasi-reversible. At PTAGCE, the oxidation waves of HQ and CC were clearly resolved. On the contrary, a broad and undistinguished peak indicating a low presence of multiple components was observed at bare GCE. Additionally, we noted that the peak potentials shifted negatively at the PTAGCE with the difference in the degree of potential shift for HQ, CC and RC resulting a clear separation on the current signals for these three components.
1.4 1.2 1.0 0.8 0.6 0.4 0.2 -90
-60 -30 0 30
i
h g f
e d
c
b a
I/
A
E/V vs. Ag/AgCl
Figure 2. CVs of three analytes at bare GCE and PTAGCE. (a) Bare GCE in blank solution; (b) PTAGCE in blank solution; (c) RC at bare GCE; (d) RC at PTAGCE; (e) CC at bare GCE; (f) CC at PTAGCE; (g) HQ at bare GCE; (h) HQ at PTAGCE; (i) HQ, CC and RC at PTAGCE.
3.2 Effect of scan rate
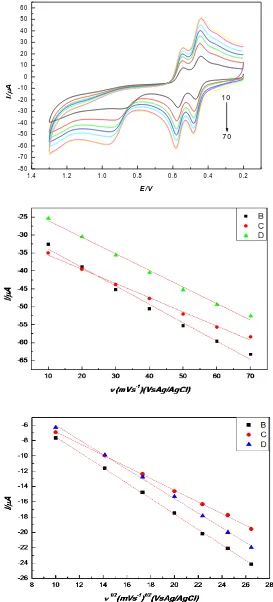
Figure 3(a) displays the cyclic voltammograms of PTAGCE in sulfuric acid solution (pH 2.0) at different scan rates. With the increase of scan rate, the peak current increased and the peak potential shifted positively. The increase of scan rate leads to large charging current so that the electron transfer at electrode surface slows down. Therefore, 10 mV/s was selected in the following experiment. In addition, ranging from 10 to 70 mV/s, the anodic peak current (Ipa) with the scan rate (v) is linearly
dependent with the equation of ICC=-2.88-0.05v, R2=0.98; IRC=-3.17-0.04v, R2=0.99 and IHQ
=-2.14-0.05v, R2=0.99, for CC, RC and HQ, respectively (Fig.3(b)). It can be inferred that the current is adsorption-controlled current. However, at high scan rate from 100 to 700 mV/s, Ipa is linearly
dependent with the square root of the scan rate and the equations are ICC=0.257-0.1v1/2, R2=0.99;
IRC=0.79-0.08v1/2, R2=0.99 and IHQ=0.357-0.1v1/2, R2=0.99, for CC, RC and HQ, respectively
[image:4.596.131.454.190.431.2]
Figure 3. (a)Effect of scan rate on three substances at PTAGCE; (b) Plots of peak current vs. scan rates for HQ, CC and RC at low scan rate; (c) Plots of peak current vs. square root of scan rates for HQ, CC and RC at high scan rate.
1.4 1.2 1 .0 0 .8 0 .6 0 .4 0 .2 -80
-70 -60 -50 -40 -30 -20 -10 0 10 20 30 40 50 60
7 0 1 0
I/
A
[image:5.596.157.430.75.677.2]
3.3 Effect of immerging time
[image:6.596.142.445.188.384.2]The influence of immerging time on the oxidation peak current of three substances was examined and the results shown in Fig.6 When improving the immerging time from 10 to 70 s, the oxidation peak current of three substances almost no increase. So the Immerging time has no effect, we will set immerging time at 10 s.
Figure 4. Effect of immerging time on CVs of three substances at PTAGCE
3.4 Simultaneous determination of HQ, CC and RC
Table 1. Comparison of the proposed sensor with others for the detection of HQ, CC and RC.
Electrode pH Linear range (μM) LOD (μM) Ref.
HQ CC RC HQ CC RC
Graphene-chitosan/GCE 7.0 1-300 1-400 a 0.75 0.75 a 24
PEDOT/GO/CGE 6.0 2.5-200 2-400 a 1.6 1.6 a 25
PARS/CS/BCN-GO/GCE 6.5 1-100 1-100 a 0.19 0.11 a 26
RGO-MWNTs/GCE 7.0 8.0-391.0 5.5-540.0 a 2.6 1.8 a 27
GNPs/CNF/Au electrode 7.0 9.0-500 5.0-350 a 0.86 0.36 a 28
Pt/ZrO2-RGO/GCE 7.0 1-1000 1-400
a
0.4 0.4 a 29
PTAGCE 6.8 15.6-500 7.81-500 3.91-500 15.6 7.81 3.91 This work
a
not reported
Under optimum conditions, we detected the three substances and obtained the standard curve by differential pulse voltammetry (DPV) as shown in Fig.5. The oxidation peak current of three substances showed good linear relationship with concentration ranging from 7.81-500 µM, 3.91-500 µM and 15.6-500 µM, respectively, for CC, RC and HQ. The linear regression equations were ICC
=-1.4 1.2 1.0 0.8 0.6 0.4 0.2 -50
-40 -30 -20 -10 0 10 20 30
I/
A
[image:6.596.53.518.483.660.2]
1.6×10⁻⁶
-0.12c, R2=0.99; IRC=-1.7×10⁻⁷-0.03c, R2=0.99 and IHQ=-7.7×10⁻⁶-0.11c, R2=0.99, for CC, RC
and HQ, respectively. The detection limits were 7.81 µM, 3.91 µM and 15.6 µM for CC, RC and HQ, respectively. The performance comparison of proposed sensor with other sensors for the detection of HQ, CC and RC was listed in Table 1. Compared with recently adopted graphene based modifiers, our proposed sensor was not able to obtain the detection limit as low as possible. However, polymer modified electrodes are easy and simple to prepare, having significant homogeneity and stability over composite modifiers. The development on present sensor is going to be carried out in next work.
Figure 5. (a) DPVs of various concentrations of three substances at PTAGCE. (a-i): 1000; 500; 250; 125;62.5; 31.2; 15.6; 7.81 and 3.91 µM. Plots of peak current against concentration of (b) RC, (c) CC and (d) HQ.
3.5 Stability and reproducibility
The anodic peak currents of HQ, CC and RC were reduced to 97.9%, 98.7% and 95.6% of the initial responses, respectively, after 40 consecutive CV scans. Being stored in pH 6.8 PBS for three weeks at 4 oC, the present electrode retained more than 90% of its initial DPV responses. It indicated an excellent stability of the proposed sensor. The relative standard deviation (RSD, shown in Table 2) for same electrode in 10 successive CV measurements were 6.7%, 9.9% and 10.3% for 0.5 mM HQ, CC and RC, respectively. Furthermore, the RSD of four electrodes prepared under same conditions
1.2 1.0 0.8 0.6 0.4 0.2
-180 -160 -140 -120 -100 -80 -60 -40 -20 0 i a I/ A E/V
0 200 400 600 800 1000
-180 -160 -140 -120 -100 -80 -60 -40 -20 0 I/ A
C/M
0 200 400 600 800 1000
-35 -30 -25 -20 -15 -10 -5 0 I/ A
[image:7.596.54.535.228.535.2][image:8.596.61.536.160.235.2]
were 2.35%, 3.74% and 4.10% for 0.5 mM HQ, CC and RC, respectively. It could be concluded that the proposed method is highly reproducible.
Table 2. The relative standard deviation for same electrode in 10 successive measurements. Peak current (μA)
RSD(%)
1 2 3 4 5 6 7 8 9 10
HQ 37.5 37.5 37.4 37.5 37.5 37.5 37.6 37.4 37.6 37.5 6.7
CC 46.1 46.1 46.1 46.2 46.2 46.2 46.2 46.3 46.3 46.4 9.9
RC 44.7 44.7 44.7 44.8 44.8 44.8 44.9 44.9 44.9 45.0 10.3
4. CONCLUSION
Under optimal experimental conditions, poly(3-thiophenemalonic acid) modified glassy carbon electrode can simultaneously detect HQ, CC and RC. These electrodes showed much better performance when compared with unmodified electrode. The oxidation peak current showed good linear relationship with concentration in the ranges of 7.81~500 μM, 3.91~500 μM and 15.6~500 μM with detection limits of 7.81 μM, 3.91μM and 15.6 μM, respectively, for CC, RC and HQ. Moreover, this method is simple and stable compared with composite modified electrodes [24-29].
ACKNOWLEDGEMENTS
This work was supported by Key Laboratory of Natural Resources of Changbai Mountain & Functional Molecules, Ministry of Education (NRFM-K-10-01).
References
1. J. Wang, J.N. Park, X.Y. Wei and C.W. Lee, Chem. Commun., 5 (2003) 628. 2. T. Xie, Q. Liu, Y. Shi and Q.J. Liu, Chromatogr. A, 1109 (2006) 317.
3. D.M. Zhao, X.H. Zhang, L.J. Feng and S.F. Wang, Colloid. Surf. B, 74 (2009) 317. 4. M. Sýs, B.Pekec, K. Kalcherand K. Vytras, Int. J. Electrochem. Sci., 8 (2013) 9030. 5. L.H. Wang and Y.P. Kuo, Chromatographia, 49 (1999) 208.
6. P. Nagaraja, R.A. Vasantha and K.R. Sunitha, J. Pharm. Biomed. Anal. 25 (2001) 417. 7. L. Zhao, B. Lv, H. Yuan, Z. Zhou and D. Xiao, Sensors, 7 (2007) 578.
8. M.F. Pistonesi, M.S.D. Nezio, M.E. Centurión, M.E. Palomeque, A.G. Lista and B.S.F. Band, Talanta, 69 (2006) 1265.
9. X. Tan, M. Li, P. Cai, L. Luo and X. Zou, Anal. Biochem., 37 (2005) 111. 10.Z.H. Wang, S.J. Li and Q.Z. Lv, Sens. Actuat. B:Chem., 127 (2007) 420. 11.H.L. Qi and C.X. Zhang, Electroanal., 17 (2005) 832.
12.J.J. Yu, W. Du, F.Q. Zhao and B.Z. Zeng, Electrochim. Acta, 54 (2009) 984.
13.P.H. Yang, W.Z. Wei, C.Y. Tao and J.X. Zeng, Bull. Environ. Contam. Toxicol., 79 (2007) 5. 14.Y.T. Shieh, B. R. Huangand M.L. Tsai, Int. J. Electrochem. Sci., 10 (2015) 3867.
15.X.M. Ma, Z.N. Liu, C.C. Qiu, T. Chen and H.Y. Ma, Microchim Acta, 180 (2013) 461.
18.A.A. Shaikh, S.K. Saha, P.K. Bakshi, A. Hussain and A.J.S. Ahammad, J. Electrochem. Soc., 160 (2013) B37.
19.P. Yang, Q. Zhu, Y. Chen and F. Wang, J. Appl. Polymer Sci., 113 (2009) 2881.
20.L. Wang, Y. Zhang, D. Lu, Y. Zhang and C. Wang, J. Solid State Electrochem., 16 (2012) 1323. 21.Y. Zhang, H. Zhuang and H. Lu, Anal. Lett., 42 (2009) 339.
22.T.C. Canevari, L.T. Arenas, R. Landers, R. Custodio and Y. Gushikem, Analyst, 138 (2013) 315. 23.J. Du, L.L. Ma, D.L. Shan, Y.R. Fan, L.P. Zhang, L. Wang and X.Q. Lu, J. Electroanal. Chem.,
722-723 (2014) 38.
24.H.S. Yin, Q.M. Zhang, Y.L. Zhou, Q. Ma, T. Liu, L.S. Zhu and S.Y. Ai, Electrochim. Acta 56 (2011) 2748.
25.W.M. Si, W. Lei, Y.H. Zhang, M.Z. Xia, F.Y. Wang and Q.L. Hao, Electrochim. Acta 85 (2012) 295. 26.J.Y. Qu, Y. Wang, J.H. Guo, Y. Dong and T.F. Lou, J Electrochem. Soc. 161 (2014) B220.
27.F.X. Hu, S.H. Chen, C.Y. Wang, R. Yuan, D.H. Yuan and C. Wang, Anal. Chim. Acta 724 (2012) 40. 28.H.L. Guo, S. Peng, J.H. Xu, Y.Q. Zhao and X.F. Kang, Sens. Actuat. B 193 (2014) 623.
29.A.T.E. Vilian, S.M. Chen, L.H. Huang, M.A. Ali and F.M.A. Al-Hemaid, Electrochim. Acta 125 (2014) 503.