Int. J. Electrochem. Sci., 9 (2014) 670 - 683
International Journal of
ELECTROCHEMICAL
SCIENCE
www.electrochemsci.org
Dithiocarbamate Post Functionalized Polypyrrole Modified
Carbon Sphere for the Selective and Sensitive Detection of
Mercury by Voltammetry Method
S. Devi1, T. Devasena2, S. Saratha3, P. Tharmaraj3, and K. Pandian1,* 1
Department of Inorganic Chemistry, University of Madras, Guindy Campus, Chennai - 600 025, India 2
Centre for Nanoscience and Technology, Anna University, Chennai – 600 025, India 3
Department of Chemistry, Thiagarajar College, Madurai – 625 009, Tamil Nadu, India *
E-mail: [email protected]
Received: 2 September 2013 / Accepted: 19 October 2013 / Published: 8 December 2013
A simple post functionalized method was demonstrated to modify dithiocarbamate functional group on polypyrrole modified carbon sphere for the selective preconcentration of mercury ion. The dithiocarbamate post functionalized polypyrrole modified carbon sphere modified GCE can be utilized for the selective detection of mercury by electrochemical method at trace level in water samples under optimized experimental condition.
Keywords: Carbon sphere, polypyrrole, mercury detection, voltammetry 1. INTRODUCTION
nanoparticles and they can be utilized for the electrochemical applications and catalysis [4]. Similarly polyaniline can be easily post functionalized with mercapto carboxylic acid because of their inherent redox nature of amine and imine functionality [5]. The carboxylic acid functionalized polyaniline system can be utilized for the electrochemical detection of heavy metals from environmental sources. In continuation of this kind of post functionalization of polymers, the predesigned polymer structure, shape and the integrity of the self-assembled molecular arrangement are maintained [6]. Here we propose a simple way of surface modification of polypyrrole using CS2 in presence of ammonia as base.
Scheme 1. Synthesis of CS@PPy/CS2 composites
Hydrothermally synthesized carbon sphere was utilized as template to grow a thin shell of conducting polypyrrole by an oxidative polymerization of pyrrole using copper salt as oxidizing agent.
The schematic diagram is shown for the post functionalization of polypyrrole preassembles on spherical carbon sphere in a submicron dimension (Scheme 1). The dithiocarbamate functionalized polypyrrole can be utilized for the selective binding of Hg2+ from the water samples. The dithiocarbamate functionalized polypyrrole shell on carbon sphere modified GCE system was utilized for the detection of mercury at trace concentration level. Mercury is considered to be one of the highly toxic heavy metal [7]. The long exposure to mercury causes kidney and respiratory failure, damage in the gastrointestinal tract and nervous system [8]. Obviously, the development of a rapid determination and reliable quantification of a trace level of mercury has become increasingly important for public security and health protection. Atomic absorption spectrometry (AAS) [9], atomic fluorescence spectrometry (AFS) [10], inductively coupled plasma mass spectrometry (ICPMS) [11] and microwave induced plasma atomic emission spectroscopy (MIP-AES) could be used to monitor Hg(II) [12]. However, they are very expensive and not suitable for in situ measurements. As an alternative to these spectroscopic techniques, electrochemical analysis, particularly stripping voltammetry, has attracted significant interests for trace analysis of heavy metals because of their excellent sensitivity, short analysis time, low power consumption and cheap equipment [6, 13-15]. Selective detection of mercury from environmental sources is a challenging area of research. Among many solid electrode so far reported for the detection of Hg(II), gold was found to be a superior substrate as a working electrode because of its high affinity for mercury which could enhance the preconcentration effect [16]. In recent years, nanotechnology-based sensors have become one of the most active areas in environmental analysis [17]. Owing to their unique capabilities, such as high surface area, increased mass transport, low detection limit and better signal-to-noise ratio, nanosized metal particles, especially Au nanoparticles (AuNPs) assembled on various supports as modified electrodes have emerged as a promising alternative for the electroanalysis of Hg(II) [18]. For instance, Hezard et al. reported on electrochemical detection of mercury (square wave anodic stripping voltammetry) using electrochemically deposited AuNP modified GCE [19]. Raj et al. constructed AuNPs-based ensembles onto the thiol functionalized sol-gel silicate network by a colloidal chemical approach [20]. But due to the some disadvantageous such as time consuming, complex pretreatment and structural changes, other chemically modified electrodes are used for the detection of Hg (II) rather than the gold nanoparticle modified electrode. The selective detection of Hg (II) and Pb (II) have been reported in the literature using polypyrrole modified graphene and carbon sphere substrates based on chelation or adsorption characteristics of nitrogen containing polypyrrole [21]. The high surface area and chelating ability of carbonaceous nanospheres (CS) makes them suitable materials for catalysis and adsorption processes. Hence we demonstrated to use carbon sphere as template to modify post functionalized polypyrrole for the selective binding of Hg (II).
2. EXPERIMENTAL SECTION 2.1. Materials
using deionised water. 2.2. Instrumental methods
2.2.1. FT-IR spectrophotometer (FT-IR)
FT-IR spectra were recorded using a Perkin-Elmer 360 model IR double beam spectrophotometer. The spectra were collected from 4000 to 400 cm-1 with 4 cm-1 resolution over 40 scans. All spectra were collected against the background spectrum of KBr.
2.2.2. Scanning electron microscopy (SEM)
Morphological and structural investigations were carried out using field emission JEOL-JSM-6360 instrument, USA. In a typical measurement, a small amount of sample powder was adhered onto a copper stub using double-sided carbon tape. The sample was then sputtered with platinum to reduce charging effect.
2.2.3. Cyclic voltammeter (CV)
The CV experiment was carried out using Gamry model 330 electrochemical instrument, USA including PV 220 software for pulse voltammeter. A three electrodes system with a single compartment cell system was used for the electrochemical studies. A platinum wire and a glassy carbon electrode (3 mm dia) were used as counter and working electrode srespectively. A silver wire is used as quasi-reference electrode whose potential was calibrated against Ag/AgCl (satd KCl). All potentials were measured against Ag wire as reference electrode. All solutions were degassed using nitrogen gas before doing all experiments.
2.3. Experimental Procedures 2.3.1. Preparation of carbon sphere
4 g of glucose was dissolved in 40 ml of distilled water to obtain a clear solution. The solution was stirred uniformly for 10 min at room temperature. The stirred solution was then transferred into a stainless autoclave and then heated for 24 hours at 200 ºC in a muffle furnace. Grey black colored pure products were obtained. It was washed with water and alcohol and then dried [22].
2.3.2. Polypyrrole decorated carbon sphere
for 10 min, then the mixture was stirred at room temperature for 2 hours. The black coloured products were obtained after centrifugation at 1500 rpm and kept under vacuum for 24 hours to get dried product. The copper ion decorated carbon spheres were dispersed in 20 ml distilled water for 10 min using ultrasonication bath. 0.02 ml of pyrrole in 30 ml of DI water was introduced into the above solution and the mixture was allowed to stir for 3 hours. Upon being centrifuged, the precipitate was obtained and dried to get the CS@PPY composites.
2.3.3. Post functionalized polypyrrole modified carbon sphere
The CS@PPY was functionalized by dithiocarbamate with the help of carbon disulfide (CS2) in presence of dil. NH3. The CS@PPY was dispersed in 20 ml distilled water under ultrasonication for 10 min which is taken in a round bottom flask and then 5 ml of carbon disulfide was added. The solution mixtures were stirred for 6 hours and then 5 ml of ammonia was added drop by drop. The suspensions were centrifuged and dried in a vacuum for 24 hours.
2.3.4. Preparation of stock solution
The stock solution of mercury and other interference elements were freshly prepared daily. 0.1 M solution of HgCl2 was prepared by dissolving 0.2715 g of HgCl2 in 10 mL of double distilled water. 100 ppm of other metal solutions such as Cd2+, Pb2+, Fe3+ and Cu2+ were prepared for study their interference with mercury ion.
[image:5.596.169.448.498.725.2]3. RESULTS AND DISCUSSION 3.1. Scanning electron microscope
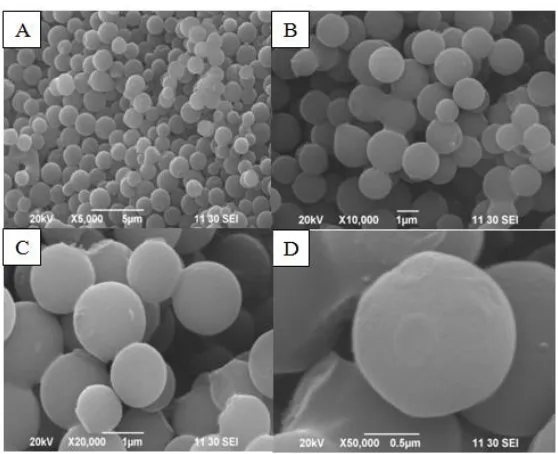
The carbon spheres were synthesized using glucose as carbon source without using any catalysts under hydrothermal condition as reported earlier [22]. SEM images of carbon spheres obtained are shown in Fig. 1. The analysis of SEM represents that the synthesized carbon spheres are uniform spherical shape and monodispersed.
[image:6.596.125.471.157.466.2]Figure 2. SEM image of CS@PPy/CS2 at different magnifications a) 5 µm b) 1 µm c) 1 µm and d) 0.5 µm.
Figure 3. Energy dispersive spectrum of (a) carbon sphere and (b) CS@PPy/CS2.
[image:6.596.84.491.506.680.2]
4000 3500 3000 2500 2000 1500 1000 500 50 55 60 65 70 75 80 85 90 95 100 700 874 1615 1615 1695 2843 2923 2923 3414
T
ra
n
s
m
it
ta
n
c
e
(
%
)
Frequency (cm-1)
b
a
3424carbon sphere was modified with chemical substances. Energy dispersive spectrum was used to confirm the presence of the elements in the post functionalized polypyrrole modified carbon sphere. The EDAX spectrum of carbon sphere and CS@PPy/CS2 are shown in Fig. 3 and their elemental composition of the carbon sphere and CS@PPy/CS2 are shown in Table I.
Table I. The elemental composition of carbon sphere and dithiocarbamate functionalized carbon sphere
3.2. FT-IR spectroscopy
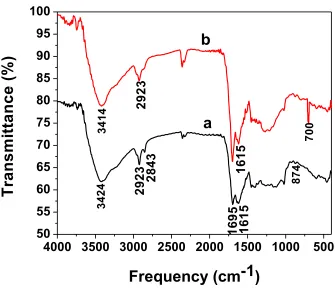
Figure 4. FT-IR Spectra of (a) CS@PPY and (b) CS@PPY/CS2
Figure 4 shows the FT-IR spectrum of (a) CS@PPY and (b) CS@PPY/CS2. Figure 4 (a) shows a peak at 3424 cm-1 which is due to the N-H stretching vibration. The peaks at 2843 and 2923 cm-1 are attributed to C-H stretching vibrations. Then the peak at 1695 cm-1 are corresponds to the C=C
Carbon sphere (A)
ELEMENTS WEIGHT % ATOMIC %
C 68.53 74.36
O 31.47 25.64
CS@PPY/CS2
(B)
C 50.86 61.46
O 34.31 31.13
[image:7.596.124.439.212.337.2] [image:7.596.120.455.383.672.2]
stretching vibration and the peak at 1615 cm-1 is assigned for the pyrrole ring vibration. The peak at 874 cm-1 is attributed to the doping of pyrrole. Figure 4(b) exhibits the remarkable differences between the CS@PPY/CS2 and CS@PPY. It was found that CS@PPY/CS2 composites had all the characteristic peaks of CS@PPY. The bands at 3414, 2923 and 1615 cm-1 are corresponds to the N-H stretching, C-H stretching and pyrrole ring vibrations. In addition, a new band is observed for CS@PPY/CS2 at near 700 cm-1 which is due to the C-S stretching frequency. This result confirms that the pyrrole ring is modified with CS2 functional group.
3.3. Cyclic Voltammetry studies
The selection of supporting electrolyte for the detection of mercury ion is one of the important parameter to achieve the lower detection limit in voltammetry studies. Some of the previous studies have demonstrated that the KCl solution exhibit higher anodic stripping peak current when compared with other supporting electrolytes. This electrolyte forms HgCl42- complex which can be easily removed from the surface so the peak shape is sharp and exhibit higher current values.
[image:8.596.105.493.350.667.2]
A similar concept has been demonstrated in the case of silver [23] and mercury [24] ion detection in presence of 0.1M KCl as supporting electrolyte. Hence we decided to use 0.1M KCl as supporting electrolyte for the detection of mercury for all the studies.
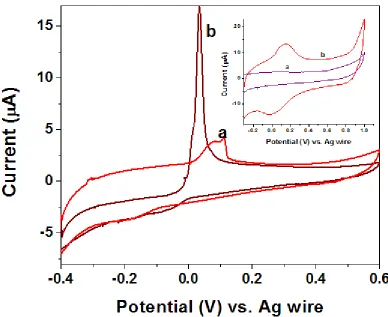
The electrochemical behaviour of Hg(II) on different electrode surface has been investigated in presence of 0.1M KCl as supporting electrolyte. In the case of bare GCE the peak is broad and the resulting anodic peak current response is minimal. On the other hand the peak current values are many fold increases when CS@PPY/CS2 modified GCE was used as working electrode. The higher current response is due to the selective binding of Hg(II) ion with dithiocarbamate functionalized polypyrrole. The reactivity and voltammetry responses for the pyrrole dithiocarbamate modified electrode have been described in the previously reported studies in more detail for the detection of Hg ions [8]. Thus the dithiocarbamate post functionalized polypyrrole modified electrode exhibit a strong affinity towards the Hg(II) ion. The voltammetry behaviour of the carbon sphere modified electrode and polypyrrole layer covered carbon sphere are shown in inset of the Fig.5. The broadening of the peak shape indicates the formation of polypyrrole on carbon surface through in situ oxidative polymerization of pyrrole using copper (II) ion as initiator. The proposed method can be utilized for the voltammetry detection of Hg ion present in water sources. Because of the strong affinity of Hg(II) ion with dithiocarbamate ligand we can use this method for the detection of mercury at lower concentration.
As can be seen in Fig. 5, a well-defined anodic peak was obtained at 0.04 V which is due to the electrochemical oxidation of Hg(0) to Hg(II) and Hg(0) was produced by the electrochemical reduction of captured Hg(II) at the deposition step under negative potentials. Furthermore, no mercury peak was observed in the absence of Hg(II) as a control experiment. These experimental results showed that Hg(II) ions from the solution can form strong HgCl42- complex with Cl− ions. Then HgCl42- complex is deposited on the modified electrode surface and reduced to Hg0 followed by the oxidation of Hg0 to Hg2+ ion.
3.4. Linear Sweep Voltammetry
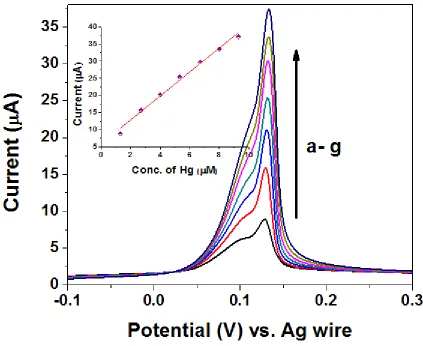
The linear sweep voltammetry (LSV) experiment was conducted to detect Hg ion in the concentration ranges of 1.3 - 9.3 µM.
Figure 6. Linear sweep voltammogram of CS@PPY/CS2 after the addition of mercury at different concentration (a - g: 1.3 – 9.3 µM) in 0.1M KCl (pH 7 and ν = 50mV/s).
3.5. Differential Pulse Voltammetry
[image:10.596.86.509.74.420.2]
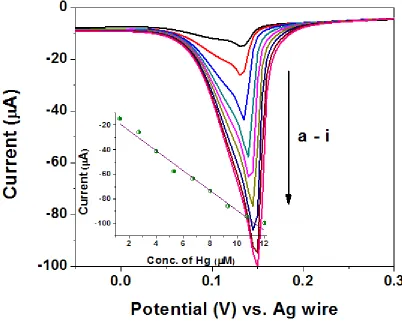
Figure 7. Difference pulse voltammogram of CS@PPY/CS2 after the addition of mercury at different concentration (a - i: 1.3 – 12 µM) in 0.1 M KCl (pH 7).
3.6. Interference of Foreign metal ions
Under optimized experimental conditions as mentioned above, the possible interferences of other metal ions like Cd2+, Pb2+, Fe3+ and Cu2+ for the determination of 1 μmoL L−1 of Hg2+ were examined with CS@PPY/CS2 electrode. The effect of the inference was tested in two compositions of the solution containing 1 and 10 μmoL L−1 of metal ions. The same experiment was also carried out with unmodified glassy carbon electrode. The peak current belonging to Cd2+ decreased but the peak current of Hg(II) was two fold increased and shifted to more negative potential on modified electrode. On the other hand, Fe3+ and Cu2+ exhibit very small peak currents compared to that of Hg(II). Pb2+ ion does not affect the Hg(II) peak current since the peak potential of Pb2+ is more negative than that of the Hg(II).
3.7. Calibration Plot, Limit of Detection and Validation of Method
concentration ranges from 1.3 - 12 µM (Inset of Fig. 6). The results obtained from this present investigation are compared with the previous reported results which are shown in Table II.
[image:12.596.52.546.265.581.2]The calibration plot (Figure 6) shows a good linear behavior with correlation coefficient (R2) of 0.9787 and the resulting equation is y = 8.10 x + 8.445. The limit of detection is found to be 1.8 µM (S/N =3). These values verified the sensitivity of the proposed method for the determination of mercury (II). CS@PPY/CS2/GCE can be stored about 4 weeks and the decrease in response was found to be 1.54% which indicates the good stability of electrode. Thus this present modified electrode can be a sensitive voltammetric sensor for trace analysis of mercury (II) ion.
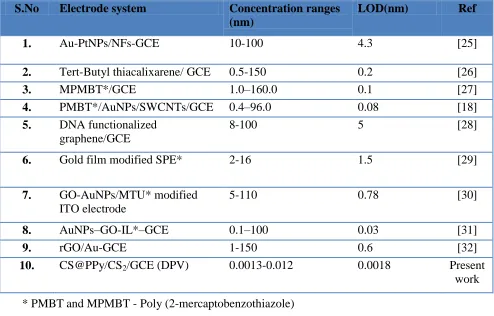
Table II. Comparison of our system with the previous literature reports S.No Electrode system Concentration ranges
(nm)
LOD(nm) Ref
1. Au-PtNPs/NFs-GCE 10-100 4.3 [25]
2. Tert-Butyl thiacalixarene/ GCE 0.5-150 0.2 [26]
3. MPMBT*/GCE 1.0–160.0 0.1 [27]
4. PMBT*/AuNPs/SWCNTs/GCE 0.4–96.0 0.08 [18]
5. DNA functionalized graphene/GCE
8-100 5 [28]
6. Gold film modified SPE* 2-16 1.5 [29]
7. GO-AuNPs/MTU* modified ITO electrode
5-110 0.78 [30]
8. AuNPs–GO-IL*–GCE 0.1–100 0.03 [31]
9. rGO/Au-GCE 1-150 0.6 [32]
10. CS@PPy/CS2/GCE (DPV) 0.0013-0.012 0.0018 Present
work * PMBT and MPMBT - Poly (2-mercaptobenzothiazole)
MTU-5-methyl-2-thiouracil IL-Ionic liquid
SPE-Screen printed electrode
3.8. Analytical Applications
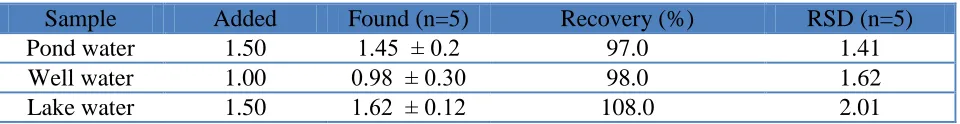
Table III. Detection of mercury in water samples
Sample Added Found (n=5) Recovery (%) RSD (n=5)
Pond water 1.50 1.45 ± 0.2 97.0 1.41
Well water 1.00 0.98 ± 0.30 98.0 1.62
Lake water 1.50 1.62 ± 0.12 108.0 2.01
The present method is simple and fast detection of mercury present in water sources. Recently a similar kind of dithiocarbamate functionalized silica [33, 34] and magnetite [35] nanomaterials were used for the removal of mercury present in water sources.
4. CONCLUSION
A new kind of chemically modified electrode has been developed for the highly selective and sensitive determination of Hg(II) by forming complex with pyrrole dithiocarbamate. It has been shown that CS@PPY/CS2 modified glassy carbon electrode can be used for determination of Hg(II) ion from aqueous solutions since the sensitivity is greatly improved by the availability of dithiocarbamate as chelating agent for the selective binding. Both LSV and DPV experiments were conducted in presence of 0.1M KCl as supporting electrolyte. The anodic peak current values improved because of the presence of 0.1M KCl as supporting electrolyte which can be used to form Hg(II) to HgCl42- at the surface of the electrolyte. It is concluded that CS@PPY/CS2 modified electrode has shown excellent reproducibility with high selectivity and the detection limit was found to be 1.8 µM. The proposed modified electrode is simple and also cheaper than those of the other modified electrodes for the simple and selective binding of Hg in presence of polypyrrole modified carbon sphere.
ACKNOWLEDGEMENT
One of the author’s grateful to UGC-CPEPA for providing research fellowship to carry out a part of the research work.
References
1. B. V. Veller and T. M. Swager, Chem. Commun., 46 (2010) 5761.
2. C. C. Han, M. Y. Bai, K. F. Yang, Y. S. Lee and C. W. Lin, J. Mater. Chem., 18 (2008) 3918. 3. D. M. T. Oriordan and G. G. Wallace, Anal. Chem., 58 (1986) 128.
4. Y. Peng, L. Qiu, C. Pan, C. Wang, S. Shang and F. Yan, Electrochim. Acta, 75 (2012) 399. 5. Z. Su, J. Huang, Q. Xie, Z. Fang, C. Zhou, Q. Zhou and S. Yao, Phys. Chem. Chem. Phys., 11
(2009) 9050.
6. I. Turyan and D. Mandier, Anal. Chem., 66 (1994) 58.
7. M. D. Imisides and G. G. Wallace, J. Electroanal. Chem., 246 (1988) 181. 8. G. E. Mckeowneyssen and J. Ruedy, Am. J. Epidemiol., 118 (1983) 461.
9. K. E. Levine, M. A. Levine, F. X. Weber, Y. Hu, J. Perlmutter and P. M. Grohse, J. Autom. Methods Manage. Chem., 2005 (2005) 211.
10.L. Rahman, W. T. Corns, D. W. Bryce and P. B. Stockwell, Talanta, 52 (2000) 833.
11.B. Passariello, M. Barbaro, S. Quaresima, A. Casciello and A. Marabini, Microchem. J., 54 (1996) 348.
13.A. Afkhami, H. Ghaedi, T. Madrakian and M. Rezaeivala, Electrochim. Acta, 89 (2013) 377. 14.R. X. Xu, X. Y. Yu, C. Gao, Y. J. Jiang, D. D. Han, J. H. Liu and X. J. Huang, Anal. Chim. Acta,
790 (2013) 31.
15.C. Gao and X. J. Huang, Trends Anal. Chem., 51 (2013) 1.
16.A. Giacomino, O. Abollino, M. Malandrino and E. Mentasti, Talanta, 75 (2008) 266. 17. J. Wang, C. Bian, J. Tong, J. Sun and S. Xia, Electroanalysis, 25 (2013) 1713.
18.X. C. Fu, J. Wu, L. Nie, C. G. Xie, J. H. Liu and X. J. Huang, Anal. Chim. Acta, 720 (2012) 29. 19.T. Hezard, K. Fajerwerg, D. Evrard, V. Colliere, P. Behra and P. Gros, J. Electroanal. Chem., 664
(2012) 46.
20.B. K. Jena and C. R. Raj, Anal. Chem., 80 (2008) 4836.
21.Y. Wei, R. Yang, J. H. Liu and X. J. Huang, Electrochim. Acta, 105 (2013) 218. 22.K. U. Lee, K. J. Park, O. J. Kwon and J. J. Kim, Curr. Appl. Phys., 13 (2013) 419.
23.B. Bottger, U. Schindewolf, J.L. Avila and R. R. Amaro, J. Electroanal. Chem., 432 (1997) 139. 24.P. Ugo, L. M. Moretto and G. A. Mazzocchin, Anal. Chim. Acta, 305 (1995) 74.
25.J. Gong, T. Zhou, D. Song, L. Zhang and X. Hu, Anal. Chem., 82 (2010) 567. 26.F. Wang, X. Wei, C. Wang, S. Zhang and B. Ye, Talanta, 80 (2010) 1198.
27.X. C. Fu, X. Chen, Z. Guo, C. G. Xie, L. T. Kong, J. H. Liu and X. J. Huang, Anal. Chim. Acta, 685 (2011) 21.
28.Y. Zhang, H. Zhao, Z. Wu, Y.Xue, X. Zhang, Y. He,X. Li and Z. Yuan, Biosens. Bioelectron., 48 (2013) 180.
29.A. Mandil, L. Idrissi and A. Amine, Microchim. Acta, 170 (2010) 299. 30.N. Zhou, H. Chen, J. Li and L. Chen, Microchim. Acta, 180 (2013) 493. 31.N. Zhou, J. Li, H. Chen, C. Liao and L. Chen, Analyst, 138 (2013) 1091. 32.L. Ding, Y. Liu, J. Zhai, A. M. Bond and J. Zhang, Electroanalysis, 25(2013) 1.
33.S. G. Renaudin, F. Gaslain, C. Marichal, B. Lebeau, R. Schneider and A. Walcarius, New J. Chem., 33 (2009) 528.
34.L. Bai, H. Hu, W. Fu, J. Wan, X. Cheng, L. Zhuge, L. Xiong and Q. Chen, J. Hazard. Mater., 195 (2011) 261.
35.P. Figueira, C. B. Lopes, A. L. D. Silva, E. Pereira, A. C. Duarte and T. Trindade, Water Res., 45 (2011) 5773.