White Rose Research Online URL for this paper: http://eprints.whiterose.ac.uk/136005/
Version: Accepted Version
Article:
Georgiou, L, Wilson, DJ, Sharma, N et al. (2 more authors) (2019) A functional form for a representative individual arterial input function measured from a population using high temporal resolution DCE MRI. Magnetic Resonance in Medicine, 81 (3). pp. 1955-1963. ISSN 0740-3194
https://doi.org/10.1002/mrm.27524
© 2018 International Society for Magnetic Resonance in Medicine. This is the peer
reviewed version of the following article: Georgiou, L, Wilson, DJ, Sharma, N et al. (2 more authors) (2018) A functional form for a representative individual arterial input function measured from a population using high temporal resolution dynamic contrast-enhanced MRI. Magnetic Resonance in Medicine, which has been published in final form at
https://doi.org/10.1002/mrm.27524. This article may be used for noncommercial purposes in accordance with Wiley Terms and Conditions for Self-Archiving. Uploaded in
accordance with the publisher's self-archiving policy.
[email protected] https://eprints.whiterose.ac.uk/
Reuse
Items deposited in White Rose Research Online are protected by copyright, with all rights reserved unless indicated otherwise. They may be downloaded and/or printed for private study, or other acts as permitted by national copyright laws. The publisher or other rights holders may allow further reproduction and re-use of the full text version. This is indicated by the licence information on the White Rose Research Online record for the item.
Takedown
If you consider content in White Rose Research Online to be in breach of UK law, please notify us by
Title:
A functional form for a representative individual arterial input function measured from a population using high temporal resolution dynamic contrast-enhanced MRI
Authors:
Dr Leonidas Georgiou, PhD, [email protected], Biomedical Imaging, University of Leeds, Leeds, UK and Department of Medical Physics, German Oncology Center, Limassol, Cyprus.
Dr Daniel J. Wilson, PhD, [email protected], Department of Medical Physics and Engineering, Leeds Teaching Hospital NHS Trust, Leeds, UK
Dr Nisha Sharma, MB, MRCP, FRCR, [email protected], Department of Radiology, Leeds Teaching Hospital NHS Trust, Leeds, UK
Prof. Timothy J. Perren, MD, FRCP, [email protected], Leeds Institute of Cancer and Pathology, St. James’s University Hospital, Leeds, UK
Prof David L. Buckley, PhD, [email protected], Biomedical Imaging, University of Leeds, Leeds, UK
Corresponding Author:
David L. Buckley, PhD
Biomedical Imaging, University of Leeds,
LIGHT Laboratories, Clarendon Way, Leeds, LS2 9JT, UK.
e-mail: [email protected]; tel. +44 113 343 2017
Running Title: A representative AIF for DCE-MRI studies
Abstract
Purpose: To measure the arterial input function (AIF), an essential component of tracer kinetic
analysis, in a population of patients using an optimized dynamic contrast-enhanced imaging sequence and to estimate inter- and intra-patient variability. From these data to extract a representative AIF that may be used for realistic simulation studies.
Methods: Thirty-nine female patients were imaged on multiple visits before and during a
course of neoadjuvant chemotherapy for breast cancer. A total of 97 T1-weighted dynamic
contrast-enhanced studies were analyzed including bookend estimates of T1 and model-fitting
to each individual AIF. Area under the curve and cardiac output were estimated from each first pass peak and these data were used to assess inter- and intra-patient variability of the AIF.
Results: Inter-patient variability exceeded intra-patient variability of the AIF. There was no
change in cardiac output as a function of MR visit (mean value 5.6 ± 1.1 L/min) but baseline blood T1 increased significantly following the start of chemotherapy (which was accompanied
by a decrease in hematocrit).
Conclusion: The AIF in an individual patient can be measured reproducibly but the variability
of AIFs between patients suggests that use of a population AIF will decrease the precision of tracer kinetic analysis performed in cross-patient comparison studies. A representative AIF is presented that is typical of the population but retains the characteristics of an individually measured AIF.
Key Words:
Introduction
Dynamic contrast-enhanced (DCE) MRI allows measurement of tissue hemodynamic characteristics by monitoring the delivery and distribution of an intravenously administered contrast agent, through its effect on the tissue’s T1 relaxation time. Techniques for analyzing
DCE data are undergoing continuous adaptation and are becoming a valuable tool in oncology (e.g. for diagnosis and monitoring of cancer) and other conditions (e.g. in the brain and kidneys) [1-3]. In particular, the introduction of quantitative assessment triggered a cascade of applications and had a significant effect on the acquisition techniques used in DCE-MRI [4]. MR signal intensity changes, due to the distribution of the contrast agent in the tissue, form temporal features that depend on the tissue pathophysiology, the imaging sequence used and the administration protocol and properties of the contrast agent. Quantitative analysis with tracer kinetic modelling allows the characterization of tissue microvasculature (e.g. tissue blood flow, blood volume fraction) and provides information on the exchange of contrast agent between vascular and interstitial compartments.
In order to decouple the response of the tissue from the contrast agent administration protocol, tracer kinetic modelling requires the concentration of the contrast agent in the feeding arteries, also known as the arterial input function (AIF), to be determined. Ideally, the delivery of the contrast agent should be sampled from an artery that directly feeds the tissue of interest. Furthermore, the frequency with which the AIF is sampled has a significant impact on the accuracy and precision of the resulting parameter estimates and influences the choice of model [5,6]. The sampling rate is particularly important during the early phase following bolus administration, when the signal in blood exhibits large and rapid changes. These requirements impose certain spatio-temporal limitations on the acquisition protocol that are usually difficult to achieve. Furthermore, additional challenges such as partial volume, B1 inhomogeneity,
incomplete spoiling and inflow effects may reduce the quality of the AIF measurement further and propagate as errors in subsequent tracer kinetic parameter estimates [7,8].
may be distorted and individual variability (e.g. cardiac output, bolus injection duration and contrast agent dose) is lost [12]. Another proposed solution is the reference region approach [13,14], but this makes assumptions about the reference tissue; and the extracted AIF may feature different temporal characteristics than expected (i.e. lower and more dispersed first pass peak). Despite the alternative approaches, a reliably measured individual AIF is superior with respect to the accuracy of the parameter estimates [15-17].
It is essential to assess the repeatability of AIF measurement in order to understand the impact of using a population average AIF on subsequent tracer kinetic analysis. In this work we have used a high temporal resolution DCE-MRI acquisition protocol and measured AIFs from a population of thirty-nine patients with breast cancer undergoing neoadjuvant chemotherapy prior to surgical resection. The participants were scanned between 1 and 5 times before and during their therapy, resulting in a total of 97 datasets. Each individual AIF was fitted with a functional AIF form [12] and this was used to obtain a measurement of the area under the first pass peak from which we assessed intra- and inter-patient variability and hence examined the repeatability of AIF measurement in a population of patients. Finally, using the parameters estimated from the model, we present a representative AIF that retains the features of an individually measured AIF.
Methods
Patients
Thirty-nine female patients (median age = 44, range = 25 – 69 years) diagnosed with invasive breast cancer and due to undergo neoadjuvant chemotherapy prior to surgery were enrolled in this prospective study. The study was approved by a local research ethics committee and written informed consent was obtained from each patient. Blood samples, taken as part of normal standard of care, were used to measure the large vessel hematocrit (Hct) before each MRI scan. Patients with contraindications to MRI were excluded from the study.
MR imaging
matrix size: 128×128×36, IR-TR: 3000 ms, TR/TE: 2.8/0.93 ms, flip angle: 8°, GRAPPA parallel factor: 2, Tacq: 1 min 05 s per inversion time) was used at four inversion times (TI: 100,
600, 1200 and 2800 ms) for T1 measurement. The accuracy of this approach was tested in a
phantom study detailed in Supporting Information S1. The IR sequence was repeated immediately after the DCE-MRI experiment.
The dynamic series consisted of 93 high temporal resolution volumes interleaved with 8 high spatial resolution volumes (the latter were not used in our analysis but are part of the standard breast protocol used in our clinic), a variation of the acquisition scheme proposed by Georgiou et al. [18]. For the high temporal resolution dynamic data, a T1-weighted 3D FLASH sequence
(TR/TE: 2.37/0.73, FA: 25°, CAIPIRINHA parallel factor: 2×2, Tacq: 2 s) was employed with
the same geometry used in the IR sequence. The volume selected encompassed both breasts, the heart, aortic arch and descending aorta (Figure 1).
Contrast agent
All patient studies followed the same contrast agent administration protocol. Gd-DOTA (Dotarem; Guerbet, Laboratories, Aulnays Sous Bois, France) was administered intravenously via the antecubital vein using an automated power injector (Spectris Solaris EP), at the beginning of the 11th dynamic volume (dose of 0.1 mmol/kg) followed by 20 ml of saline at a rate of 3 ml/s.
Postprocessing
Data were processed in PMI (Platform for Research in Medical Imaging, version 0.4 [19]) and Matlab (Mathworks, Nattick, MA, USA). For AIF extraction, regions of interest (ROIs) were drawn in the descending aorta and, for consistency across patients, were sampled in the same 10 slices (starting from inferior slices, ROIs were drawn in the 5th to 14th slices). Fig. 1 illustrates a representative example of the volume slab excited in our DCE-MRI experiment. The 3D ROIs were further trimmed to include only voxels that had a peak relative signal intensity change between the 50th and the 95th percentile of the signal change maxima [18].
These slices and percentiles were chosen empirically, to minimize inflow, section profile and partial volume artifacts. The median number of voxels included in the 3D ROIs for the AIF was 162 (range 87 – 358).
IR-FLASH signal equation [20,21] to the measured signal intensities at the four inversion times. Using the pair of T1 estimates and the signal equation for a FLASH sequence [22], an
iterative approach was followed to apply a bookend correction to the R1 (T1 relaxation rate
change) series, as described by Cron et al. [23]. To calculate the respective blood concentration time series for each patient a contrast agent relaxivity of 4.2 s-1 mM-1 was assumed [24]. As a
last step, the extracted AIFs were time-shifted so that the contrast appeared at t = 0 and the data were truncated so that each AIF covered a period of approximately 4.5 minutes.
For subsequent analysis we used a functional form to fit to each AIF, to allow more accurate interpolation and integration of the first pass peak. Horsfield’s model [12] was used since it provides a description of contrast agent recirculation, dispersion and redistribution that is based on physiological factors and because it can be fitted to individual AIF data sets, as opposed to an experimentally derived functional form that is fitted to averaged data from a population of subjects [10]. In our implementation of the Horsfield model, three exponential decay terms were used to characterize extravasation and excretion, combined with repeated gamma variate functions to account for recirculation. The equation for the period between the start of the nth recirculation and the (n+1)th recirculation, is given by:
, (1)
where Ai and mi are the amplitudes and time constants of the exponential terms, the coefficients
and reflect the number of “theoretical mixing chambers” and the ratio of the volume of the mixing chambers to the volume flow rate, and is the recirculation time. The gamma variate function takes the form given above for all t ≥ 0 and is 0 for all t < 0.
Eqn. 1 was fitted to the individual AIFs using the Levenberg-Marquardt iterative least-squares optimization algorithm. Given the large number of fit parameters, we used multiple random initial estimates within a predefined range for each parameter. The first pass was isolated from Eqn. 1 and an analytical solution for the area under the first pass curve (AUC1st) in terms of the
fitting parameters was derived (Eqn. 2)
Furthermore, using indicator dilution principles [25] we generated an estimate of the patient’s cardiac output (CO) from each AIF
(3)
where D is the dose of injected contrast agent, estimated by multiplying the concentration of Gd-DOTA used (0.5 mmol/ml) by the volume of contrast agent administered.
Repeatability Assessment
To assess the repeatability of AIF measurement in the patient cohort, we examined the variability in pre-contrast T1, and CO estimates. In addition, we assessed variability of
Hct. These were first assessed for normality using the Shapiro-Wilk test and a Q—Q (quantile-quantile) plot. One-way analysis of variance (ANOVA) for repeated measurements was used to test for any significant changes across MRI visits and to estimate inter- and intra-patient coefficients of variability (CV). To select a representative AIF we first fitted the population average AIF using Equation 1, and then identified the individual AIF whose first pass profile was closest to that of the population average AIF, using the least square differences of the two time series. The respective parameter estimates from the individual patient were used to generate a representative AIF.
Results
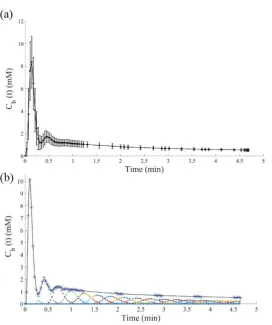
In this study we analyzed 97 datasets from thirty-nine patients who underwent a total of 146 MR examinations. Datasets were excluded due to: missing back coil, motion-corrupted AIF, deviation from the standard injection protocol (e.g. manual injection or slower injection) or missing IR data. Figure 2a shows the population-averaged AIF from all available datasets. The discontinuities in this plot are due to the interleaved acquisition scheme used [18]. Furthermore, although the number of DCE volumes was fixed for all scans, some data appear in the gaps because of the effect of variable time shifts.
The resulting model parameters were used in Eqn. 2 to estimate AUC1st. Table 1 shows the
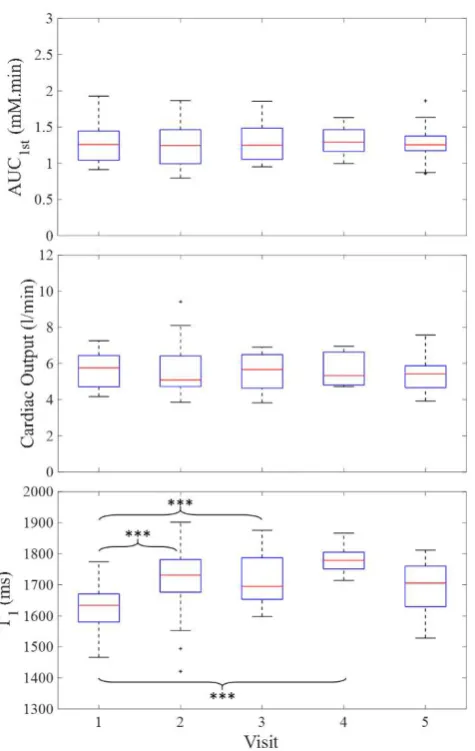
estimates obtained for pre-contrast blood T1, Hct, AUC1st, and CO. Figure 4 demonstrates the
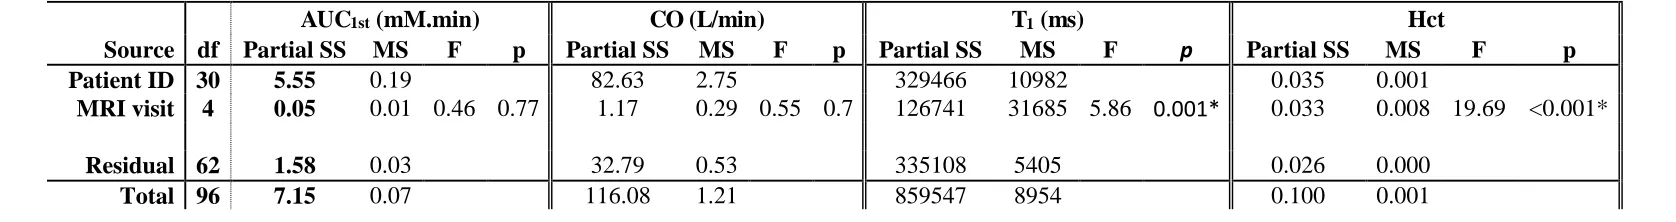
variability of these estimates within and between visits. All data followed a normal distribution (p > 0.05, Shapiro-Wilk test) and the results of the ANOVA test (Table 2) suggest that there were no significant differences between visits for both AUC1st (p = 0.77) and CO (p = 0.70).
There was a significant difference in the blood T1 estimates (p < 0.001) with a step increase
between visit 1 (pre-chemotherapy) and visits 2, 3 and 4 (all during chemotherapy). Similarly, Hct showed a significant change across visits (p < 0.001), with a decrease seen at visits 3, 4 and 5 compared to baseline.
For both AUC1st and CO variability within patients (total mean squares, MS = 0.01 mM∙min
and 0.29 L/min, respectively) was lower than variability between patients (MS = 0.16 mM∙min and 2.45 L/min, respectively). Similarly, the inter- and intra-patient CV were estimated to be 21% and 11% for AUC1st, 17% and 11% for CO, 7.7% and 7.1% for Hct and 4.6% and 4.2%
for T1.
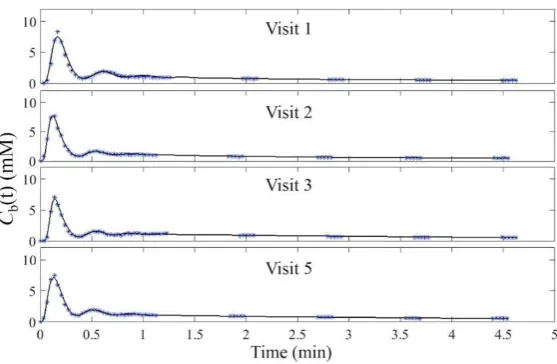
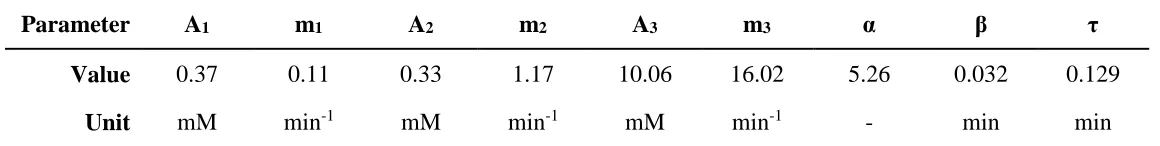
Figure 5 illustrates the representative AIF from this patient cohort plotted alongside the population AIF from [10]. The fitted parameters are shown in Table 3 and an Excel file of the respective time series, at a high temporal resolution (0.1 s), is provided as Supporting Information S2. The AIF was measured following a bolus administration of 14.4 ml of Gd-DOTA at 3 ml/s followed by 20 ml of saline, from a female patient, aged 59 years with an Hct of 0.35 and a mass of 72 kg.
Discussion
In 2006 Parker et al. published a population-averaged AIF [10] that has subsequently been used by numerous investigators for both simulations and data analysis. Since then, DCE-MRI acquisition has improved allowing many of the limitations of that study to be addressed. We measured an AIF in 97 separate MRI studies obtained from a population of 39 patients. Our AIF measurements were performed at a high sampling rate (2 s per acquisition compared with 5 s previously [10]) using a flexible coil to enhance the signal from the descending aorta and to allow for a detailed characterization of the first pass and subsequent recirculations of the contrast agent bolus in the blood. Another strength of this protocol was the use of bookend IR T1 measurements, which have been shown to improve the accuracy with which contrast agent
In Figure 2 we show a plot of the population-average AIF from all studies alongside an example AIF from an individual study. It is clear that the detailed temporal characteristics of the second pass seen in the individual AIF are lost in the population average AIF. Moreover, the majority of the individual AIFs examined in this study were characterized by a third pass peak, which is smoothed over in the population-average AIF. Incomplete sampling of the early bolus passes has been shown to introduce significant errors and fit failures in quantitative tracer kinetic analysis of tissue curves [18]. The different characteristics of the individual and population-average AIFs are likely the reason why Parker’s population-average functional form failed to converge to satisfactory fits on individual AIFs [12]. Parker’s model uses two Gaussians to account for the first pass and the second recirculation peak. Horsfield’s recirculation model is able to capture multiple passes despite having fewer fit parameters (9 versus 10 parameters).
Using Eqn.3 we estimated AUC1st in order to examine the variability of the AIFs for this patient
cohort. Within patients there were no significant differences in AUC1st between MRI visits.
Furthermore, both MS and CV estimates for inter-patient variability were higher than for intra-patient variability. The 21% inter-intra-patient CV suggests that use of a population average AIF will introduce additional variability and thus potentially limit the sensitivity of quantitative analysis across patients. Using AUC1st we estimated CO, as described by Yang et al. [14]. The
mean CO estimate was in good agreement with that measured in patients at rest and lying prone [27], providing indirect support for the accuracy of our measured AIFs. As noted by Yang, if the population-averaged AIF described by Parker is used to estimate CO, it results in an unrealistically high value (10.5 L/min) [14]. This may be due principally to under-sampling of the first pass leading to underestimation of AUC1st [14] but will also have been affected by B1
and inflow artifacts. This suggests that use of Parker’s population AIF in quantitative analysis may introduce systematic overestimation of tracer kinetic model parameters.
Our baseline blood T1 estimates match very well those recently reported in the literature at 1.5
T. For example, Dabir et al. provided estimates of 1551 ± 115 ms and 1572 ± 111 ms for blood T1 from 102 healthy volunteers and 113 low-risk patients, respectively, of whom 51% were
males [28]. Further studies in female subjects report blood T1 values of 1667 ± 77 ms (n = 20
healthy females, [29]), 1664 ± 62 ms (n = 38 healthy females, [30]) and 1666 ± 77 ms (n = 65 females with at least one risk factor for heart failure, [30]). A factor that affects blood T1 is Hct,
a significant decrease in Hct for visits 3, 4 and 5 and an increase in T1 for visits 2, 3 and 4 in
comparison with visit 1 (p < 0.005).
In this study we used an optimized acquisition protocol to measure the AIF in a group of patients with breast cancer undergoing neoadjuvant chemotherapy. Our aim was to reduce variations caused by experimental measurement errors to examine variations that are inherent to individual patients. To achieve this, we used the same dose of contrast agent for all patients and the administration protocol was fixed. Data were acquired at a temporal resolution that was appropriate to sample the early bolus passes of the AIF and the use of a flexible coil on the patient’s back enhanced the SNR from the aorta. Measurement errors related to inflow effects [7] were addressed by careful placement of the imaging volume to encompass heart, aortic arch, a significant region of lung tissue as well as descending aorta which also helped to reduce partial volume artifacts - Parker et al. used only a single slice and included data from the iliac arteries [10]. We have used a T1 measurement technique based on a non-selective inversion
recovery sequence, which is less prone to errors than a variable flip angle acquisition, and a bookend T1 method to improve the accuracy of estimates of contrast agent concentration
[23,26]. The result is a series of AIFs with excellent intra-patient repeatability but that highlight larger inter-patient variability. We provide the parameters of a functional form of a representative AIF from the patient cohort that would be ideal for simulation studies or intra-patient comparisons. For inter-intra-patient comparisons reliable individual AIFs should be measured, where possible. If not, the use of a representative AIF may be necessary but is likely to decrease the precision of tracer kinetic analysis.
Acknowledgments
References
1. Padhani AR. Dynamic contrast-enhanced MRI in clinical oncology: current status and future directions. J Magn Reson Imaging 2002;16(4):407-422.
2. Gribbestad IS, Gjesdal KI, Nilsen G, Lundgren S, Hjelstuen MHB, Jackson A. An Introduction to Dynamic Contrast-Enhanced MRI in Oncology. In: Jackson A, Buckley DL, Parker GJM, editors. Dynamic Contrast-Enhanced Magnetic Resonance Imaging in Oncology. Berlin, Heidelberg: Springer Berlin Heidelberg; 2005. p 1-22.
3. Georgiou L, Buckley DL. T1-weighted DCE MRI. In: Cercignani M, Dowell N, Tofts PS, editors. Quantitative MRI of the Brain. 2 ed. Baco Raton: CRC Press; 2018. p 251-268.
4. Sourbron SP, Buckley DL. Tracer kinetic modelling in MRI: estimating perfusion and capillary permeability. Phys Med Biol 2012;57(2):R1-R33.
5. Henderson E, Rutt BK, Lee TY. Temporal sampling requirements for the tracer kinetics modeling of breast disease. Magn Reson Imaging 1998;16(9):1057-1073.
6. Cramer SP, Larsson HB. Accurate determination of blood-brain barrier permeability using dynamic contrast-enhanced T1-weighted MRI: a simulation and in vivo study on healthy subjects and multiple sclerosis patients. J Cereb Blood Flow Metab 2014;34(10):1655-1665.
7. Roberts C, Little R, Watson Y, Zhao S, Buckley DL, Parker GJ. The effect of blood inflow and B(1)-field inhomogeneity on measurement of the arterial input function in axial 3D spoiled gradient echo dynamic contrast-enhanced MRI. Magn Reson Med 2011;65(1):108-119.
8. Garpebring A, Wirestam R, Ostlund N, Karlsson M. Effects of inflow and radiofrequency spoiling on the arterial input function in dynamic contrast-enhanced MRI: A combined phantom and simulation study. Magn Reson Med 2011;65(6):1670-1679.
9. Tofts PS, Kermode AG. Measurement of the blood-brain barrier permeability and leakage space using dynamic MR imaging. 1. Fundamental concepts. Magn Reson Med 1991;17:357-367.
10. Parker GJ, Roberts C, Macdonald A, Buonaccorsi GA, Cheung S, Buckley DL, Jackson A, Watson Y, Davies K, Jayson GC. Experimentally-derived functional form for a population-averaged high-temporal-resolution arterial input function for dynamic contrast-enhanced MRI. Magn Reson Med 2006;56(5):993-1000.
11. Orton MR, Miyazaki K, Koh DM, Collins DJ, Hawkes DJ, Atkinson D, Leach MO. Optimizing functional parameter accuracy for breath-hold DCE-MRI of liver tumours. Phys Med Biol 2009;54(7):2197-2215.
12. Horsfield MA, Thornton JS, Gill A, Jager HR, Priest AN, Morgan B. A functional form for injected MRI Gd-chelate contrast agent concentration incorporating recirculation, extravasation and excretion. Phys Med Biol 2009;54(9):2933-2949.
13. Yankeelov TE, Luci JJ, Lepage M, Li R, Debusk L, Lin PC, Price RR, Gore JC. Quantitative pharmacokinetic analysis of DCE-MRI data without an arterial input function: a reference region model. Magn Reson Imaging 2005;23(4):519-529.
14. Yang C, Karczmar GS, Medved M, Oto A, Zamora M, Stadler WM. Reproducibility assessment of a multiple reference tissue method for quantitative dynamic contrast enhanced-MRI analysis. Magn Reson Med 2009;61(4):851-859.
16. Port RE, Knopp MV, Brix G. Dynamic contrast-enhanced MRI using Gd-DTPA: Interindividual variability of the arterial input function and consequences for the assessment of kinetics in tumors. Magn Reson Med 2001;45(6):1030-1038.
17. Yankeelov TE, Cron GO, Addison CL, Wallace JC, Wilkins RC, Pappas BA, Santyr GE, Gore JC. Comparison of a reference region model with direct measurement of an AIF in the analysis of DCE-MRI data. Magn Reson Med 2007;57(2):353-361.
18. Georgiou L, Sharma N, Broadbent DA, Wilson DJ, Dall BJ, Gangi A, Buckley DL. Estimating breast tumor blood flow during neoadjuvant chemotherapy using interleaved high temporal and high spatial resolution MRI. Magn Reson Med 2018;79(1):317-326.
19. Sourbron S, Biffar A, Ingrisch M, Fierens Y, Luypaert R. PMI: platform for research in medical imaging. Magn Reson Mater Phy 2009;22(1):539.
20. Brix G, Schad LR, Deimling M, Lorenz WJ. Fast and Precise T1 Imaging Using a Tomrop Sequence. Magn Reson Imaging 1990;8(4):351-356.
21. Kershaw LE, Hutchinson CE, Buckley DL. Benign prostatic hyperplasia: evaluation of T1, T2, and microvascular characteristics with T1-weighted dynamic contrast-enhanced MRI. J Magn Reson Imaging 2009;29(3):641-648.
22. Haase A. Snapshot FLASH MRI - applications to T1, T2, and chemical-shift imaging. Magn Reson Med 1990;13:77-89.
23. Cron GO, Santyr G, Kelcz F. Accurate and rapid quantitative dynamic contrast-enhanced breast MR imaging using spoiled gradient-recalled echoes and bookend T-1 measurements. Magn Reson Med 1999;42(4):746-753.
24. Rohrer M, Bauer H, Mintorovitch J, Requardt M, Weinmann HJ. Comparison of magnetic properties of MRI contrast media solutions at different magnetic field strengths. Invest Radiol 2005;40(11):715-724.
25. Stewart GN. Researches on the Circulation Time and on the Influences which affect it. J Physiol 1897;22(3):159-183.
26. Cron GO, Kelcz F, Santyr GE. Improvement in breast lesion characterization with dynamic contrast-enhanced MRI using pharmacokinetic modeling and bookend T(1) measurements. Magn Reson Med 2004;51(5):1066-1070.
27. Dharmavaram S, Jellish WS, Nockels RP, Shea J, Mehmood R, Ghanayem A, Kleinman B, Jacobs W. Effect of prone positioning systems on hemodynamic and cardiac function during lumbar spine surgery: an echocardiographic study. Spine (Phila Pa 1976) 2006;31(12):1388-1393.
28. Dabir D, Child N, Kalra A, Rogers T, Gebker R, Jabbour A, Plein S, Yu CY, Otton J, Kidambi A, McDiarmid A, Broadbent D, Higgins DM, Schnackenburg B, Foote L, Cummins C, Nagel E, Puntmann VO. Reference values for healthy human myocardium using a T1 mapping methodology: results from the International T1 Multicenter cardiovascular magnetic resonance study. J Cardiovasc Magn Reson 2014;16:69. 29. Reiter U, Reiter G, Dorr K, Greiser A, Maderthaner R, Fuchsjager M. Normal diastolic
and systolic myocardial T1 values at 1.5-T MR imaging: correlations and blood normalization. Radiology 2014;271(2):365-372.
Figures
Figure 1. Example of the MRI volume slab acquired for the DCE data, which included the (i) heart, (ii) aortic arch, (iii) descending aorta and (iv) breasts. The image represents a maximum intensity projection in the sagittal plane. This was generated after subtracting the pre-contrast high spatial resolution volume from the first post-contrast high spatial resolution volume, and reconstructing the images in the sagittal plane. The dashed lines demonstrate the region where the AIF was sampled.
[image:14.595.91.364.382.708.2]data points on each side of successive acquisition bursts. (b) Example of Horsfield’s functional form fitted to an individual AIF. The black solid line indicates the fitted line through the data (asterisks). The colored data points indicate the recirculation phases of the contrast agent.
Figure 4. Boxplots of AUC1st, CO and pre-contrast blood T1 as a function of MRI visit. The
Table 1. Blood T1, AUC1st and CO estimates for each MR visit.
Parameters
Visit 1 baseline
(n=29)
Visit 2 post-cycle 1
(n=25)
Visit 3 post-cycle 3
(n=20)
Visit 4 post-cycle 5
(n=5)
Visit 5 after chemotherapy
(n=18)
Overall (n=97)
M M M M M M
Blood T1 (ms) 1626 ± 72 1718 ± 107 1716 ± 80 1782 ± 55 1696 ± 82 1689 ± 95
Hematocrit 0.41 ± 0.02 0.39 ± 0.03 0.37 ± 0.03 0.35 ± 0.04 0.36 ± 0.02 0.38 ± 0.03
AUC1st (mM.min) 1.28 ± 0.28 1.26 ± 0.32 1.28 ± 0.25 1.31 ± 0.23 1.29 ± 0.25 1.28 ± 0.27
CO (L/min) 5.66 ± 0.93 5.68 ± 1.38 5.49 ± 1.01 5.67 ± 1.01 5.53 ± 1.13 5.61 ± 1.10
Table 2. Results of the one-way ANOVA for repeated measures.
df – degrees of freedom, MS – Mean Squares, SS – sum of squares, * denotes significance at 95% level
AUC1st (mM.min) CO (L/min) T1 (ms) Hct
Source df Partial SS MS F p Partial SS MS F p Partial SS MS F p Partial SS MS F p
Patient ID 30 5.55 0.19 82.63 2.75 329466 10982 0.035 0.001
MRI visit 4 0.05 0.01 0.46 0.77 1.17 0.29 0.55 0.7 126741 31685 5.86 0.001* 0.033 0.008 19.69 <0.001*
Residual 62 1.58 0.03 32.79 0.53 335108 5405 0.026 0.000
[image:18.842.4.842.342.453.2]Table 3. Parameter estimates for the functional form of the representative AIF.
Parameter A1 m1 A2 m2 A3 m3
Value 0.37 0.11 0.33 1.17 10.06 16.02 5.26 0.032 0.129
Unit mM min-1 mM min-1 mM min-1 - min min
Supporting Information S1. Details of a phantom experiment performed to test the accuracy of the 3D IR-FLASH sequence for blood T1
measurement.
Supporting Information Figure S1. Bland-Altman plot of the difference between 3D IR-FLASH estimates of T1 and IR-SE estimates of T1
against IR-SE T1 in the HCMR phantom. Horizontal lines representing mean bias (bold) and ±95% confidence intervals (faint lines) are
shown.
Supporting Information S1 Details of a phantom experiment performed to test the accuracy
of the 3D IR-FLASH sequence for blood T1 measurement.
We imaged the Hypertrophic Cardiomyopathy Registry (HCMR) phantom and assessed gels
with T1 values in the range 344 to 2211 ms (measured in the same session using a single
slice IR-spin echo (SE) sequence with a TR of 10 s and 8 TI times: 100, 200, 400, 800, 1600,
3200, 6400 & 9000 ms). Results using the 3D IR-FLASH sequence with the acquisition
parameters detailed in the main manuscript (IR-TR: 3000 ms, TR/TE: 2.8/0.93 ms, flip angle:
8°, GRAPPA parallel factor: 2, four inversion times: 100, 600, 1200 and 2800 ms) were
excellent. The 3D IR-FLASH sequence produced results with a mean bias of -9 ms and 95%
confidence intervals of -24 to +7 ms.
Supporting Information Figure S1. Bland-Altman plot of the difference between 3D IR-FLASH
estimates of T1 and IR-SE estimates of T1 against IR-SE T1 in the HCMR phantom. Horizontal
lines representing mean bias (bold) and ±95% confidence intervals (faint lines) are shown. -40.0
-30.0 -20.0 -10.0 0.0 10.0 20.0
0 500 1000 1500 2000 2500
3
D
I
R
-F
LA
S
H
T1
-IR
-S
E
T1
(m
s)