This is a repository copy of
Water-Soluble Organic Composition of the Arctic Sea Surface
Microlayer and Association with Ice Nucleation Ability
.
White Rose Research Online URL for this paper:
http://eprints.whiterose.ac.uk/127892/
Version: Accepted Version
Article:
Chance, Rosemary Jane orcid.org/0000-0002-5906-176X, Hamilton, Jacqueline Fiona
orcid.org/0000-0003-0975-4311, Carpenter, Lucy Jane orcid.org/0000-0002-6257-3950 et
al. (3 more authors) (2018) Water-Soluble Organic Composition of the Arctic Sea Surface
Microlayer and Association with Ice Nucleation Ability. Environmental Science &
Technology. pp. 1817-1826. ISSN 1064-3389
https://doi.org/10.1021/acs.est.7b04072
[email protected] https://eprints.whiterose.ac.uk/ Reuse
Items deposited in White Rose Research Online are protected by copyright, with all rights reserved unless indicated otherwise. They may be downloaded and/or printed for private study, or other acts as permitted by national copyright laws. The publisher or other rights holders may allow further reproduction and re-use of the full text version. This is indicated by the licence information on the White Rose Research Online record for the item.
Takedown
If you consider content in White Rose Research Online to be in breach of UK law, please notify us by
S1
Supporting Information
Water-soluble organic composition of the Arctic sea surface microlayer and
association with ice nucleation ability
Rosie J. Chance
1, Jacqueline F. Hamilton
1, Lucy J. Carpenter
1, Sina C. Hackenberg
1,
Stephen J. Andrews
1, Theodore W. Wilson
2*1. Wolfson Atmospheric Chemistry Laboratories, Department of Chemistry, University of York,
Heslington, York, YO10 5DD, UK.
2. School of Earth and Environment, University of Leeds, Woodhouse Lane, Leeds, LS2 9TJ, UK.
*Now at Owlstone Medical Ltd., 162 Cambridge Science Park, Milton Road Cambridge, CB4 0GH,
UK.
Number of pages - 23
Supplementary text sections - 1
Number of tables - 3
FT-ICR-MS Formula assignment
Molecular formulae for all
m/z
peaks with signal to noise ratio greater than four were
generated using the SmartFormula functionality within DataAnalysis 4.1 software
(Bruker Daltonics, Bremen, Germany). In addition to unlimited C, H and O, the
heteroatoms N (up to 4), S (up to four) and P (up to one) were allowed, and a formula
error limit of 1 ppm was applied. This typically resulted in ~15000 different
m/z
peaks
per sample, many of which had multiple possible suggested formulae. Only
m/z
values that satisfied the following criteria were considered further: (i) absent from the
procedural extraction blank (at a signal to noise ratio of at least four); (ii) present in
both analytical replicates; (iii) signal-to-noise ratio greater than ten. This reduced the
number of
m/z
values to 1072 to 2022 per sample.
For each
m/z
peak, a unique formula was selected by applying the following criteria.
Elemental ratios were limited to those fitting the following rules: O/C
≤
1, 0.3
≤
H/C
≤
2.25, N/C
≤
0.5, S/C
≤
0.2, P/C
≤
0.1, (S+P)/C
≤
0.2, N < O, S < O, O > (2S + P).
Formulae with the following elemental combinations were also disregarded as being
unlikely (after Hawkes et al., 2016
1): N
3-4S
1-4, N
3-4P, N
1-4S
3-4, N
1-4S
1-4P and S
1-4P.
Double bond equivalents (DBE; calculated as DBE = 0.5(2C + N + P - H + 2)) were
required to be a non-negative integer value. Where application of these rules did not
result in a unique molecular formula, the formula with the lowest number of
heteroatoms was selected for bulk compositional analysis (van Krevelen plots and
calculation of average O/C and H/C ratios). The mSigma value (a measure of how
well the measured isotopic abundance fits the theoretical isotopic abundance for a
given molecular formula) was also used to evaluate possible formulae in some cases,
however this parameter was not available for all ions.
A total of 5044 different formulae were found in the seawater samples (n=7), 6154 in
the microlayer samples (n=7) and 2127 in the boat blanks (n=2). On average, only 33
± 5 % of ions with S/N >10 had formulae assigned to them. Ions with assigned
formulae accounted for an average of 62 ± 3 % of the total summed ion intensity for
each seawater sample, but 36 ± 5 % of the total summed ion intensity for SML
S3
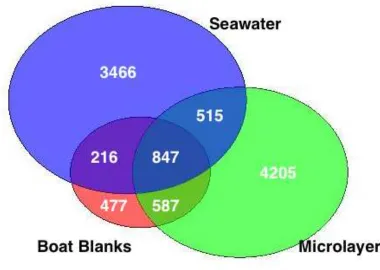
There was little overlap between the formulae found in samples of the same type (Fig.
S7), with 55% of seawater formulae being found in only one seawater sample. This is
surprising given the high level of similarity between the seawater mass spectra (SI
Figure S6), and may reflect ambiguity in formula assignment. Elemental composition
information obtained by assigning formula to the FT-ICR-MS results is discussed
here for completeness, but should be treated with caution. The overall distribution of
formulae between different compound classes (e.g. CHO, CHON etc) was generally
similar across sample types (Table S2). The distribution of compound classes and
average elemental ratios were within the ranges reported in the literature (Table S2).
The percentage (by number) of CHON compounds was significantly higher in
microlayer samples than seawater samples (students t-test, p < 1%), but was also high
in the boat blanks suggesting this might be an artifact related to the sampling or
sample volume.
H/C ratios were slightly higher for microlayer samples than seawater (students t-test,
p < 1%), with overall averages of 1.25 ± 0.05 and 1.09 ± 0.05 respectively, while
DBE values were lower (students t-test, p < 1%), with overall averages of 11 and 15
for SML and seawater respectively. However, for both average H/C ratio and DBE,
boat blanks had values between those for seawater and microlayer, again suggesting
the sampling differences could have contributed to the apparent difference. Average
O/C ratios were similar across the different sample types (overall average of 0.4 for
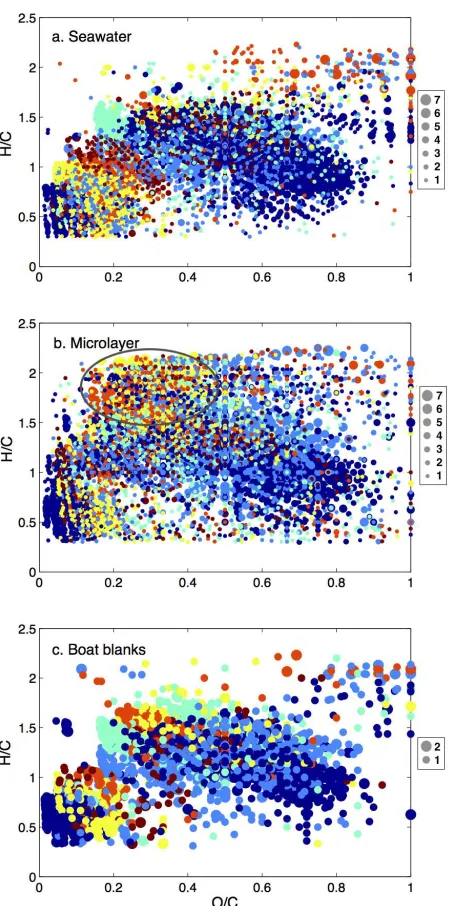
each; Table S2). Visualization of the molecular characteristics/assigned formula using
van Krevelen plots showed the three sample types to be broadly similar (Fig S8). The
most pronounced difference was the increased abundance of heteroatomic molecules
with H/C > 1.5 and O/C < 0.5 in the microlayer samples compared to the seawater
and boat blank samples.
For the more individual formula assignment of IN tracer ions, some possible formulae
containing phosphate (PO
4) groups were generated. However, these formulae were
considered unlikely because the fragmentation spectra of these ions did not contain
ions of
m/z
97 (H
2PO
4-) or 79 (PO
3-), which are characteristic of phosphate functional
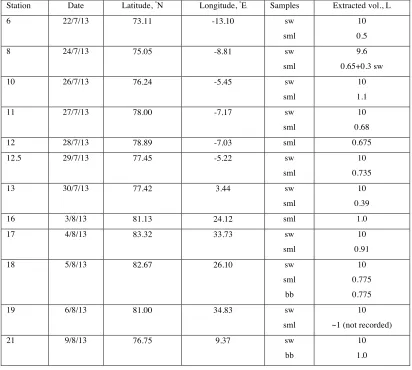
Table S1. Dates and positions for seawater (sw), microlayer (sml) and boat blank (bb)
sample collection during cruise JR288.
Station Date Latitude, ¡
N Longitude, ¡
E Samples Extracted vol., L
6 22/7/13 73.11 -13.10 sw
sml
10
0.5
8 24/7/13 75.05 -8.81 sw
sml
9.6
0.65+0.3 sw
10 26/7/13 76.24 -5.45 sw
sml
10
1.1
11 27/7/13 78.00 -7.17 sw
sml
10
0.68
12 28/7/13 78.89 -7.03 sml 0.675
12.5 29/7/13 77.45 -5.22 sw
sml
10
0.735
13 30/7/13 77.42 3.44 sw
sml
10
0.39
16 3/8/13 81.13 24.12 sml 1.0
17 4/8/13 83.32 33.73 sw
sml
10
0.91
18 5/8/13 82.67 26.10 sw
sml
bb
10
0.775
0.775
19 6/8/13 81.00 34.83 sw
sml
10
~1 (not recorded)
21 9/8/13 76.75 9.37 sw
bb
10
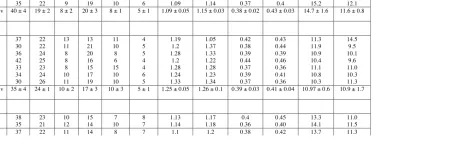
Table S2. Molecular composition information of SPE-DOM, as determined by FT-ICR-MS in negative ion mode in this study and comparable
previous work. See main text for details of data filtering and formula assignment. Intensity weighted average values are indicated by 'wa'
subscript.
% formula type Elemental ratios Saturation
CHO CHON CHOS CHOP CHONS CHONP H/C H/Cwa O/C O/Cwa DBE DBEwa
Seawater sw6 sw8 sw12.5 sw13 sw17 sw18 sw19 38 38 38 48 41 39 35 18 18 18 19 20 17 22 9 8 10 4 10 8 9 21 20 21 14 17 25 19 8 9 8 8 8 8 10 6 6 6 7 4 4 6 1.03 1.09 1.02 1.17 1.13 1.09 1.09 1.12 1.15 1.11 1.2 1.17 1.16 1.14 0.36 0.36 0.37 0.43 0.39 0.38 0.37 0.41 0.43 0.43 0.49 0.43 0.45 0.4 16.0 15.5 16.4 12.5 12.6 14.9 15.2 12.2 11.9 12.4 10.3 11.0 11.3 12.1 average ± stdev 40 ± 4 19 ± 2 8 ± 2 20 ± 3 8 ± 1 5 ± 1 1.09 ± 0.05 1.15 ± 0.03 0.38 ± 0.02 0.43 ± 0.03 14.7 ± 1.6 11.6 ± 0.8
Microlayer sml6 sml8 sml12 sml12.5 sml17 sml18 sml19 37 30 36 42 33 34 30 22 22 24 25 23 24 26 13 11 8 8 8 10 11 13 21 20 16 15 17 19 11 10 8 6 15 10 10 4 5 5 4 4 6 5 1.19 1.2 1.28 1.2 1.28 1.24 1.33 1.05 1.37 1.33 1.22 1.28 1.23 1.34 0.42 0.38 0.39 0.44 0.37 0.39 0.37 0.43 0.44 0.39 0.46 0.36 0.41 0.36 11.3 11.9 10.9 10.4 11.1 10.8 10.3 14.5 9.5 10.1 9.6 11.0 10.3 11.3 average ± stdev 35 ± 4 24 ± 1 10 ± 2 17 ± 3 10 ± 3 5 ± 1 1.25 ± 0.05 1.26 ± 0.1 0.39 ± 0.03 0.41 ± 0.04 10.97 ± 0.6 10.9 ± 1.7
Boat blanks bb18 bb21 38 35 23 21 10 12 15 14 7 10 8 7 1.13 1.14 1.17 1.18 0.4 0.36 0.45 0.40 13.3 14.1 11.0 11.5
Selected literature values: L2013 - sw -sml 44.1 42.5 33.1 33.7 17.4 19.4 -- -- 5.4 4.5 -- -- -- -- 1.253 1.266 -- -- 0.492 0.484 -- -- 9.26 9.00 L2015 - sw - ice 43 39 30 39 4 4 < 2 < 3 2 2 19 13 -- -- 1.2 1.4 -- -- 0.5 0.4 -- -- -- -- H2013
-sw (5 m) 24.6 30.8 21.4 -- 23.3 -- -- 1.6 -- 0.54 -- --
K2009
- sw 84 4 10.5 -- 1.4 -- -- 1.3 -- 0.35 -- 9.2
L2013 = Lechtenfeld, 2013
2; L2015 = Longnecker, 2015
3; H2013 = Hertkorn et al., 2013
4; K2009 = Kujawinski et al., 2009
5S7
Table S3. Sampling information and presence or absence of ions with the same molecular formulae as the IN tracer ions in ambient Arctic aerosol samples collected in the sampling area in spring and summer. Where ions were present, the formulae error in ppm is given, followed by the mSigma score.
Sample collection Tracer ion
Sample Date range Latitude
range, ¡N
Longitude
range, ¡E
Air mass
origin
C10H19O3
- C
11H21O3
- C
20H40O8S2
2- C
12H21O6
- C
14H25O6
-March 2013
RVL 2-5 18/3/2013 -
22/3/2013
77.5 - 80.3 -4.1 - 15.6 Barents sea Absent Absent Absent Absent Absent
RVL 8-11 24/3/2013 -
28/3/2013
70.5 - 75.0 -16.9 - -7.0 north
Greenland
Absent Absent Absent Absent Absent
RVL 01 16/3/2013 -
17/3/2013
n/a n/a Blank Absent Absent Absent Absent Absent
RVL 15 31/3/2013 -
1/4/2013
n/a n/a Blank Absent Absent Absent Absent Absent
July-August 2013
JR288 5-7 17/7/2013 -
20/7/2013
65.9 - 70.2 -20.7 - -12.5 east
Greenland
-2.61,
12.5
2.53,
8.8
Absent -1.78,
28.2 -1.09, 519.5 JR288 20-23 2/8/2013 - 6/8/2013
79.8 - 83.3 10.7 - 34.8 north
Greenland
3.27,
13.2
-3.37,
7.7 Absent
-2.3,
81.3
-1.81,
32
JR288 01 14/7/2013 -
15/7/2013
n/a n/a Blank Absent Absent Absent Absent Absent
[image:9.595.107.450.118.655.2]
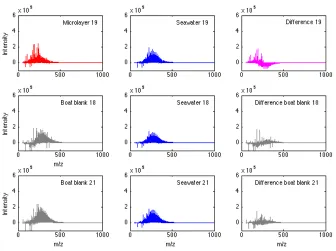
S9
S11
0 200 400 600 800 1000
−5 0 5 10 15 20x 10
4 Microlayer 12.5 In te n si ty
0 200 400 600 800 1000
−5 0 5 10 15 20x 10
4
Seawater 12.5
0 200 400 600 800 1000
−5 0 5 10 15 20x 10
4
Difference 12.5
0 200 400 600 800 1000
−5 0 5 10 15 20x 10
4 Microlayer 13 In te n si ty
0 200 400 600 800 1000
−5 0 5 10 15 20x 10
4
Seawater 13
0 200 400 600 800 1000
−5 0 5 10 15 20x 10
4
Difference 13
0 200 400 600 800 1000
−5 0 5 10 15 20x 10
4 Microlayer 16 In te n si ty
No seawater 16 sample
0 200 400 600 800 1000
−5 0 5 10 15 20x 10
4
Difference 16
0 200 400 600 800 1000
−5 0 5 10 15 20x 10
4 Microlayer 17 In te n si ty
0 200 400 600 800 1000
−5 0 5 10 15 20x 10
4
Seawater 17
0 200 400 600 800 1000
−5 0 5 10 15 20x 10
4
Difference 17
0 200 400 600 800 1000
−5 0 5 10 15 20x 10
4 Microlayer 18 m/z In te n si ty
0 200 400 600 800 1000
−5 0 5 10 15 20x 10
4
Seawater 18
m/z
0 200 400 600 800 1000
−5 0 5 10 15 20x 10
4 Difference
S15
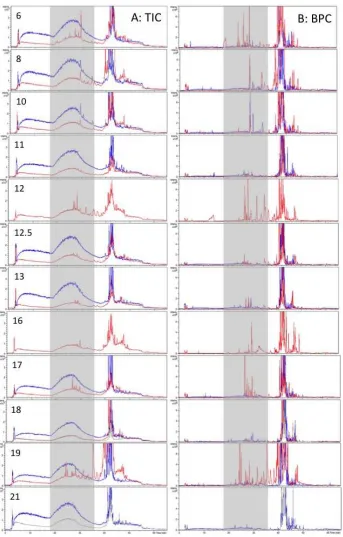
S17
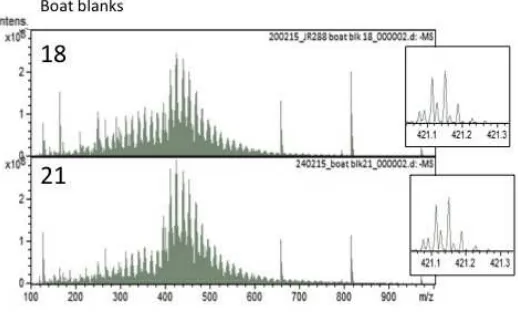
Figure S6. Negative mode FT-ICR-MS spectra for seawater (blue; top to bottom: 6, 8, 12.5, 13, 17, 18, 19), microlayer (red; top to bottom: 6, 8, 12, 12.5, 17, 18, 19) and microlayer sampler blank SPE extracts (grey; top to bottom: 18, 21). Inset panels show the fine scale resolution (across an arbitrary m/z range of 421.0-421.3) using the same vertical scale. The three most prominent seawater peaks were identified as C20H21O10 (m/z = 421.12), C21H25O9 (m/z = 421.15) and C22H29O8 (m/z = 421.19) in all
S21
Figure S8. Van Krevelen plots for formulae identified in negative FT-ICR-MS spectra for (a) all seawater samples analyzed (n=7), (b) all microlayer samples analyzed (n=7) and (c) both sampling boat blanks (n=2). The size of the dots is scaled to the fraction of samples each formulae was found in. The color indicates the elemental composition as follows: dark blue = CHO, light blue = CHON, cyan = CHOS, yellow = CHOP, orange = CHONS and burgundy = CHONP. Grey oval highlights region where microlayer shows particular enrichment (see text for details).