Int. J. Electrochem. Sci., 11 (2016) 9100 – 9109, doi: 10.20964/2016.11.12
International Journal of
ELECTROCHEMICAL
SCIENCE
www.electrochemsci.orgComparing the Air Flow Distribution Qualities Among Three
Different Air Flow Path Configurations for Tubular Solid Oxide
Fuel Cell Stacks
Zidong Yu1,2,*, Yu Xu2, Biao Hu2, Shengji Liu1,*, Xinyi Zhang2
1
School of Automobile and Traffic Engineering, Jiangsu University, Zhenjiang, Jiangsu 212013, China;
2
School of Energy and Power Engineering, Jiangsu University of Science and Technology, Zhenjiang, Jiangsu 212003, China.
*
E-mail: [email protected]
Received: 21 July 2016 / Accepted: 2 September 2016 / Published: 10 October 2016
In this paper, the air flow distribution quality within a conventional tubular solid oxide fuel cell (T-SOFC) stack air flow path structure was analyzed by 3D calculating fluid dynamics (CFD) simulating. The air flow field within the T-SOFC stack was of a typically turbulence characteristic. Both air flow distribution qualities among 36 T-SOFC units in stack level and over each T-SOFCs unit surface within the T-SOFC stacks with different air flow manifold configuration designs, such as 1in1out-line, 1in1out-Z, and 2in2out-Z type, were carefully compared through 3D simulation. 2in2out-Z type air flow path structure was concluded to be a more suitable chooses for T-SOFC stack, because its smaller variation of x-velocity at each main plane than that in other type air flow path structures.
Keywords: Tubular SOFC stack, air flow distributing path optimization, turbulence flow characteristic.
1. INTRODUCTION
development of SOFCs faces the challenges to maximize the power density and minimize the unwanted temperature variation throughout the whole stack, which contributes to the thermal stress in different components [8, 9]. These will rely on the proper air flow path design to ensure high air flow distribution qualities within the stack.
In the past decade, more and more attentions had been paid on investigating proper stack structure designs to achieve high stack performance and overall lifetime [4, 10-13]. M. Peksen had coupled the CFD and computational solid mechanics model to simulate the heating-up process to achieve the induced thermal stress within a specific planar SOFC stack [4]. Y. P. Chyou et al. had developed a heat transfer models for the typical planar SOFC units with co-, counter and cross fuel & air arrangement pattern, and the air flow distribution was found to be a very important factor to determine both the temperature and electrochemical reaction distributions within a stack [14, 15]. Computer simulation had been employed by D. Yan et al. to test the planar SOFC stacks with external manifold and obtained the optimized parameters [16]. The effects of different rib shapes (i.e., rectangle and discrete cylinder) on the air flow distributions within the specific planar SOFC stacks had been numerically compared by 3D computational fluid dynamics (CFD) modeling [17, 18, 19]; and the planar stack using rectangular rib configuration for fuel side and discrete symmetric cylindrical rib configuration to construct air flow channels was concluded to be a suitable design for that type of planar SOFC stacks [18].
Conclusively, a suitable air flow manifold configuration design can not only feed air flow uniformly among the T-SOFC units and over each T-SOFC active cathode surface, but also can provide sufficient air flow to remove possible hot spots during performance. As reviewed above, CFD methods had been widely adopting to investigate the flow distributing characteristics within different planer SOFC stack designs and optimize the stack parameters. It was generally agreed to be an accurate and effective approach. However, as far as we know, there were rare reports on the 3D CFD analyzing and optimizing for 3D air flow path within the tubular solid oxide fuel cell (T-SOFC) stack designs.
In this paper, the air distribution characteristics within a convenient tubular SOFC stacks were figured out and assessed by the 3D CFD model developing and simulating. The air flow distributing qualities among 36 T-SOFC units in stack level and over each T-SOFC unit surface in single cell level were carefully analyzed to illustrate the practicable of the current used air flow path. Finally, the air flow distributions qualities within different air flow path configuration for T-SOFC stacks, such as, 1in1out-line, 1in1out-Z, and 2in2out-Z, were compared to achieve the optimized results.
2. CFD MODELING OF 3D AIR FLOW PATH WITHIN CONVENTIONAL T-STACKS
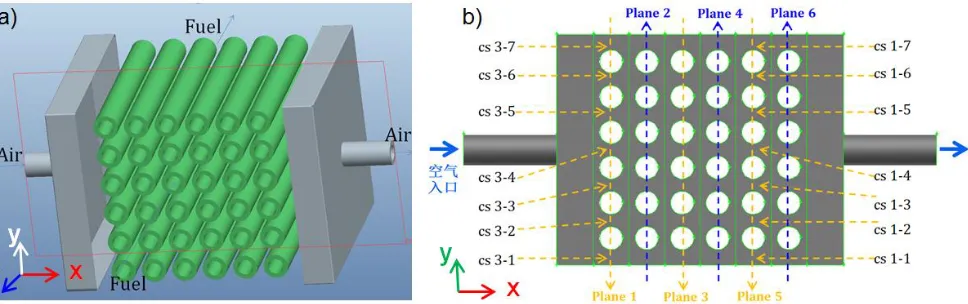
The sketch diagram of air flow path within a conventional T-SOFC stack was illustrated in Fig. 1a. 36 tubular SOFC units (i. e., diameter d=15 mm, length L=150 mm) were metrically connected with an interval 8 mm. The total active areas of all T-SOFC units within the stack was around,
S36dL36 3.14 15 10 3150 10 30.254 m2, (1)
1in1out ‘line-type’ configuration. 1in1out meant two manifolds (inlet and outlet) were placed at the centers of the opposite surfaces, respectively. Their effects were feeding the air flows to each tubular SOFC unit, collecting exhaust gas and cooling the stack. For the case with average output current density j around 7000 A m-2, effective utilization of air flow
2
O
around 20%, the mass flow rate at the manifold inlet can be evaluated as,
2 2 -1 air air O O
0.00318 kg s 4
jSM m
F
, (2)
Where F was the Faraday constant, equaled to the total electric column of one molar electrons.
2
O
M was the molar mass of oxygen.
2
O
was the mass fraction of oxygen within air mixture. Then the manifold inlet velocity can be conveniently evaluated as
-1air air/ air in 28.7 m s
u m A . airwas air
mass density; Ainrin2 was the total areas of inlet manifold entrances. In current case, the radii of both
inlet and outlet manifolds rin=rout were around 10 mm.
Mesh grid dividing was one of the most important steps to achieve proper 3D CFD calculating results within the complicated 3D air flow path of T-SOFC stacks. Enough hexagonal mesh elements around 1564276 were addred to the current 3D CFD air flow path model to ensure the accuracy. For this case, the Reynolds number within the inlet manifolds was high around 39295.3, which was of typical turbulent flow characteristic. The k- model was chosen for the turbulent flow field simulating.
Finally, the flow characteristics of air fluid distribution within the conventional T-stack would be figured out by the 3D CFD approach using software Fluent with a tolerance 1×10⁻⁵. The detailed process of 3D model developing, meshing and simulating processes could be found in many previous papers [18, 20].
For carefully getting the air flow distributing characteristics and qualities within T-SOFC stack, six y-z main planes ‘plane i(i=1, 2…6)’ along x direction were indexed in Fig. 1b. Each plane consisted of seven smaller y-z cross sections, which were labeled as cs i-j. j=1, 1, 2,…7 was the indexes along y direction.
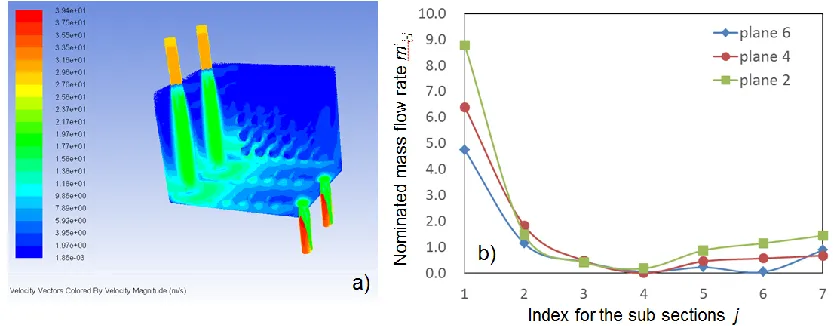
[image:3.596.60.544.553.705.2]
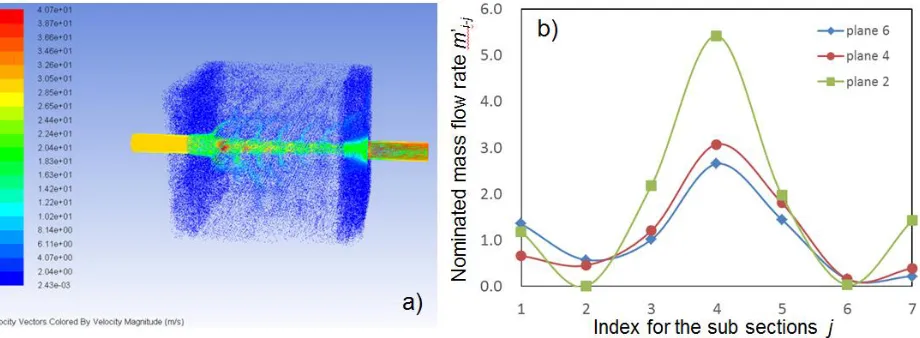
Figure 2. a) 3D velocity vector distributions of particle motion trails within the conventional 1in1out line-type air flow pat;b) the corresponding no-dimensional air mass flow rates through seven sub cross sections of plane i=2, 4 and 6, respectively.
3. RESULTS AND DISCUSSION
The air distributing qualities within tubular SOFC stacks could be judged by two levels: i) among 36 T-SOFC units in stack level; ii) over each T-SOFC unit surface in single cell level. Fig. 2a showed the 3D velocity vector distributions of particle motion trails within the conventional 1in1out line-type air flow path design to visually illustrate the movement routes of the air flow particles. Due to its turbulent state, there were obviously vortexes within the stack which was good for uniform distribution of air fluid. However, most of the air flows were concentrated in the middle region due to both the inlet and outlet manifolds were placed at the central positions of the opposite surfaces. Thus, it was reasonable to find that most of the air flow was induced from the inlet manifold and transported out the T-SOFC stack directly.
The corresponding no-dimensional air mass flow rates through seven sub cross sections cs i-j of plane i=2, 4 and 6 were displayed in Fig. 2b. i and j were the indexes of the main plane and sub cross section, respectively. The non-dimensional item was used to compare the performances among the T-SOFC stacks with different structure design and working conditions [20, 21],
6 '
0
/
i j i j k i k
m m
m , (3)Where mi j was the air mass flow rate passing through the sub cross section cs i-j. The air
distribution results in Fig. 2b showed that most of the air flows passed through the sub section cs i-4. This could be well consisted with the configuration of air transport process in Fig. 2a in quantity.
highest velocity was appeared at main plane 2 due to it neared the inlet manifold entrance. The x-velocities within plane-6 were distributed more uniformly compared to the other planes, because of far away from the inlet manifold entrance.
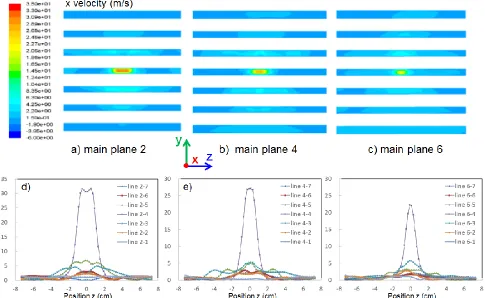
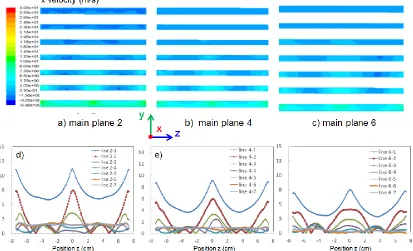
Figure 3. a-c) the detail ux perpendicular to the seven y-z sub cross sections within planes i=2, 4 and 6
for 1in1out line-type air flow path; d-f) The corresponding x-velocities distributions at the center line ‘line i-j’ of sub cross section in planes 2, 4 and 6.
The corresponding x-velocities distributions at the center line ‘line i-j’ of sub cross section ‘cs i-j’ in i-plane were curved as Fig. 3d, e and f. Obviously, the peak of the x-velocity were appeared at lines i-4 around y=0 positions. The variations of the air flow rate distributions could be estimated by the nominated standard deviations of x-velocities over main plane as [18, 21],
2
1
1/2
( )
N j
j
u
u u
u
N
, (4) [image:5.596.55.540.150.448.2]
characteristics within two different alternative manifold configuration designs (1in1out-Z type and 2in2out-Z) were analyzed and compared.
Figure 4. a) sketch diagram of a 1in1out Z-type air flow path configuration; b) the corresponding 3D velocity vector distributions of particle motion trails within it; c) the corresponding no-dimensional air mass flow rates through seven sub cross sections in plane i= 2, 4 and 6.
[image:6.596.60.512.88.209.2]Fig. 4a and b showed the sketch diagram of a 1in1out Z-type air flow path configuration, and the 3D velocity vector distributions of particle motion trails within it to visually illustrate the movement routes of air flow. Obviously, most of the air flow will pass through the top areas of the structure. Fig. 4c showed the corresponding no-dimensional air mass flow rates through seven sub cross section in plane i= 2, 4 and 6, respectively. Compared with the conventional 1in1out line-type air flow path, very different air flow distribution trend among the 36 T-SOFC units were obtained. More air flow rates will pass through cs i-4, i-5 andi-6. The air flow distributing quality among 36 piled T-SOFC units was slightly improved.
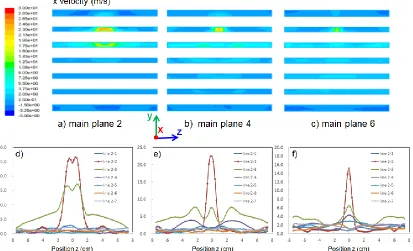
Figure 5. a-c) the detail ux perpendicular to the seven y-z sub cross sections within planes i=2, 4 and 6
[image:6.596.94.507.450.701.2]
The x-velocity distribution perpendicular to the seven y-z sub cross sections within planes i=2, 4 and 6 were pictured out at Fig. 5a, b and c, respectively, to indicate the air distribution quality over each T-SOFC unit surface indirectly. Then, the corresponding horizontal velocities distributions at the center line ‘line i-j’ of each sub cross section were figured out as Fig. 5d, e and f. to illustrate the variations of air flow distribution over the relevant T-SOFC unit surface. Compared with that in 1in1out line-type air flow path, the maximum x-velocities within planes 2, 4 and 6 will decrease from 31.6, 27.1 and 22.2 m s-1 to 25.4, 21.8 and 14.5 m s-1, respectively. It. meant more air flows would be
fed to other places except that around the peak values.
The nominated standard deviations of the x-velocities over main plane 2, 4 and 6 were evaluated as 1.819, 1.489 and 0.819, respectively. Obviously, using 1in1out Z-type air flow path configuration could obtained higher air flow distribution quality over T-SOFC unit surfaces than that in 1in1out line-type configuration.
Figure 6. a) 3D velocity vector distribution of particle motion trails within 2in2out Z-type air flow path configuration; b) the no-dimensional air mass flow rates through sub cross sections cs i-j within three main planes.
Fig. 6 showed the 3D velocity vector distribution of particle motion trails within 2in2out Z-type air flow path configuration to visually illustrate the movement routes of air flow. In this case, most of the air flows were concentrated around the button zone of the stack. Then, the no-dimensional air mass flow rates through sub cross sections cs i-j within three main planes were displayed in Fig. 6b.As shown in the figure, cs i-1 will obtain most of the air flow. Compared with that in conventional 1in1out line-type design, using 2in2out Z-type didn’t improve the air flow distribution quality among the 36 T-SOFC units too.
[image:7.596.89.507.304.467.2][image:8.596.92.505.109.360.2]
1.016, 1.111 and 1.117, respectively.
Figure 7. a-c) the detail ux perpendicular to the seven y-z sub cross sections within planes i=2, 4 and 6
for 2in2out Z-type air flow path; d-f) The corresponding x-velocities distributions at the center line ‘line i-j’ of sub cross section in planes 2, 4 and 6.
Figure 8. Comparison of the overall nominated standard deviations of x-velocities
u over plane 2, 4 and 6 among the 1in1out line-type, 1in1out Z-type and 2in2out Z-type air flow path structures using in T-SOFC stacks were compared. [image:8.596.187.412.446.608.2]
different configurations, due to the relevant lower variations of x-velocity over the surfaces of each T-SOFC units.
4. CONCLUSIONS
In this study, the 3D CFD analyzing model for the 1in1out line-type air flow path within a conventional T-SOFC stack had been well developed to figure out the flow distribution characteristics. The air fluid transport process within the structure was found to be a typical turbulence flow. T-SOFC stack with 2in2out Z-type manifold configuration would lead to a great improvement of the air flow distributing uniformity over each T-SOFCs unit surface in single cell level. It was concluded to be a more suitable air flow path design for the typical T-SOFC stacks. However, it should also be mentioned that compared with the conventional 1in1out line-type manifold configuration, not matter using 1in1out Z-type or 2in2out Z-type designs could not apparently improved air flow distributing quality among 36 T-SOFC units. The air flow distribution quality in stack level should be further concerned and improved by some other alternative air flow path configurations in the near future.
ACKNOWLEDGEMENTS
We gratefully acknowledge the financial support of the National Science Foundation of China 21106058, the Jiangsu Province Colleges and Universities Natural Science Projects (13KJB480003).
References
1. D. Chen, Q. Zhang, L. Lu, V. Periasamy, M.O. Tade, Z. Shao, J Power Sources, 303 (2016) 305-316.
2. Xiang Gao, Qiang Zhang, Wenxuan Zhang, D. Chen, Int. J. Electrochem. Sci., 10 (2015) 7521-7534.
3. Wei Kong, Wenxuan Zhang, Shundong Zhang, Qiang Zhang, S. Su, International Journal of Hydrogen Energy, (2016).
4. M. Peksen, International Journal of Hydrogen Energy, 39 (2014) 5137-5147.
5. P. Batfalsky, J. Malzbender, N.H. Menzler, International Journal of Hydrogen Energy, 41 (2016) 11399-11411.
6. L. Jin, W. Guan, J. Niu, X. Ma, W.G. Wang, J Power Sources, 240 (2013) 796-805.
7. L. Blum, H.P. Buchkremer, S. Gross, A. Gubner, L.G.J. de Haart, H. Nabielek, W.J. Quadakkers, U. Reisgen, M.J. Smith, R. Steinberger-Wilckens, R.W. Steinbrech, F. Tietz, I.C. Vinke, Fuel Cells, 7 (2007) 204-210.
8. W.S. Xia, Y.Z. Yang, Q.S. Wang, J Power Sources, 194 (2009) 886-898.
9. D. Chen, H. Wang, S. Zhang, M.O. Tade, Z. Shao, H. Chen, Aiche Journal, 61 (2015) 3786-3803. 10. D. Chen, H. He, D. Zhang, H. Wang, M. Ni, Energies, 6 (2013) 1632-1656.
11. L. Lu, D. Chen, G. Zhao, X. Ren, G. Guo, The Journal of Physical Chemistry C, 114 (2010) 18435-18438.
12. Wei Kong, Xiang Gao, Shixue Liu, S. Su, a.D. Chen, Energies 7(2014) 295-313.
14. Y.-P. Chyou, T.-D. Chung, J.-S. Chen, R.-F. Shie, J Power Sources, 139 (2005) 126-140. 15. C.M. Huang, S.S. Shy, H.H. Li, C.H. Lee, J Power Sources, 195 (2010) 6280-6286.
16. D. Yan, Z. Bin, D. Fang, J. Luo, X. Wang, J. Pu, B. Chi, L. Jian, Y. Zhang, International Journal of Hydrogen Energy, 38 (2013) 660-666.
17. P.W. Li, S.P. Chen, M.K. Chyu, J Power Sources, 140 (2005) 311-318.
18. S. Su, H. He, D. Chen, W. Zhu, Y. Wu, W. Kong, B. Wang, L. Lu, International Journal of Hydrogen Energy, 40 (2015) 577-592.
19. B. Timurkutluk, C. Timurkutluk, M..Mat, Y. Kaplan, Renewable and Sustainable Energy Reviews, 56(2016) 1101–1121.
20. D. Chen, Q. Zeng, S. Su, W. Bi, Z. Ren, Appl Energ, 112 (2013) 1100-1107.
21. K. Rashid, S. K. Dong, R. A. Khan, S. H. Park, Journal of Power Sources, 327(2016) 638-652.
22. K. S. Howe, G. J. Thompson, K. Kendall, Journal of Power Sources, 196(2011) 1677-1686. 23. V. Lawlor, S. Griesser, G. Buchinger, A.G. Olabi, S. Cordiner, D. Meissner, Journal of Power
Sources, 193(2009) 387-399.