Int. J. Electrochem. Sci., 7 (2012) 4479 - 4487
International Journal of
ELECTROCHEMICAL
SCIENCE
www.electrochemsci.org
Carbon Paste Electrode Modified with Carbon Nanotubes and
Poly(3-Aminophenol) for Voltammetric Determination of
Paracetamol
Indra Noviandri*, Rien Rakhmana
Analytical Chemistry Research Group, Faculty of Mathematics and Natural Sciences, Institut Teknologi Bandung, Jl. Ganesha No. 10 Bandung 40132, Indonesia
*
E-mail: innov@chem.itb.ac.id, innov66@yahoo.com
Received: 12 March 2012 / Accepted: 9 April 2012 / Published: 1 May 2012
In this research, carbon paste electrode (CPE) was modified with carbon nanotube (CNT) and poly(3-aminophenol) and the modified electrode was used for voltammetric determination of paracetamol. The CNT used to modify CPE was synthesized using spray pyrolysis technique and characterized using Scanning Electron Microscopy (SEM), Transmission Electron Microscopy (TEM), and Energy Dispersive X-Ray (EDX) techniques. Modification of CPE was conducted firstly by dispersing CNT on the surface of CPE from its N,N-Dimethil fomamide (DMF) suspension and then CNT was trapped in poly(3-aminophenol) through electropolymerization of 3-aminophenol on the surface of CPE. Characterization of the modified electrode was conducted with squarewave voltammetry (SWV) technique. Oxidation peak of paracetamol was 450 mV vs Ag/AgCl(3 M NaCl). Oxidation current of paracetamol obtained with the modified CPE was significantly higher than that obtained with bare CPE. The best calibration curve for paracetamol was in the concentration range of 10-5 M – 10-4 M with limit of detection (3) of 1,1 µM. Results of paracetamol determination in real sample with the modified electrode were in good agreement with those of HPLC method.
Keywords: voltammetry , carbon paste, carbon nanotube, 3-aminophenol, paracetamol
1. INTRODUCTION
toxic metabolites accumulation that causes hepatocyte death. Therefore it is very important to develop effective analytical methods for paracetamol analysis. Many analytical methods have been developed for quality control purposes,[1] including titration[2-7], spectrophotometry[8-14], near infra red spectroscopy[15-17], and chromatography.[18-22]
Recently voltammetric method has been widely used for paracetamol determination. Modified working electrodes were developed for this purposes to improve selectivity and sensitivity of the determination.[23-34] Conducting polymer modified electrode is one of many successful methods to improve selectivity of analysis and has been used for paracetamol determination.[29,30] On the other hand, many researchers have shown that carbon nanotube (CNT) can be used to improve sensitivity of paracetamol analysis.[31-34] In this research, we developed a carbon paste electrode (CPE) modified with CNT and poly(3-aminophenol) to improve sensitivity of paracetamol determination. On the surface of CPE, CNT was trapped in poly(aminophenol) through electropolymerization of 3-aminophenol.
2. EXPERIMENTAL
2.1. Apparatus and Procedures
Voltammetric measurements were conducted using BASi Epsilon Electrochemical analyzer. A conventional three-electrode system was used for all electrochemical measurements with a modified carbon paste as working electrode, a platinum (Pt) wire as auxiliary electrode and a Ag/AgCl (NaCl 3 M) as reference electrode. Cyclic voltammetry (CV) and squarewave voltammetry (SWV) technique was use in this study and the measurements were conducted in a home made 10 mL glass cell. Nitrogen gas was used to expel dissolved oxygen in solution before each measurement was conducted.
2.2. Chemicals
Except carbon nanotubes, all chemicals used in this study were of analytical grade (Merck or Sigma Aldrich) and were used without further purification. Carbon nanotubes were made using spray pyrolysis method with three heating panels having temperature of 400C, 700C and 400C, respectively. Raw materials used in CNT synthesis were benzene containing a certain amount of ferrocene as catalyst. The carbon nanotubes produced were used for electrode modification without further purification. Deionized water was used as solvent for all measured solution.
2.3. Preparation of working electrode
certain amount of CNT suspension in N,N-dimethylformamde (DMF) was dropped on the surface of CPE. After all DMF solvent evaporated, the second step was conducted. In the second step 3-aminophenol was electropolymerize using cyclic voltammetry technique in a voltammetric cell containing 25 mM aminophenol in phosphate buffer solution of pH 7.0. To polymerize 3-aminophenol, ten cycles of cylic voltammetry were conducted in the potential range of 200 mV – 1200 mV with scan rate of 5 mV/s.
3. RESULTS & DISCUSSION
[image:3.596.110.483.311.453.2]3.1. Characterization of Carbon Nanotube
Figure 1. SEM image of carbon nanotube
Figure 2. TEM image of carbon nanotube
[image:3.596.215.380.505.670.2]
contains iron residue (15 11%) from catalyst used in the synthesis. SEM images (Figure 1) show that carbon nanotubes are formed from spray pirolysis process.
TEM image confirm the formation of carbon nanotube having average diameter around 28 nm (Figure 2). No conclusion can be drawn from the data about the type of CNT. The CNT was used without further purification.
3.2. Electropolymerization
Electropolymerization of 3-aminophenol was conducted using cyclic voltammetry technique. Ten cycles of potential scan between 200 mV and 1200 mV were used in electropolymerization process. The cyclic voltammograms (CVs) of the polymerization process is given in Figure 3. The first cycle has a sharp peak at 400 mV due to oxidation of 3-aminophenol monomer. As the oxidation proceed, the oxidize monomers were combined to form poly(3-aminophenol) covering the surface of CNT modified CPE. The peak at 400 mV disappears at the second cycle and the oxidation current is lower compare to that of first cycle. Oxidation current at further cycles was relatively constant due to propagation of polymer chain. The CVs confirm formation of poly(3-aminophenol) on the surface of the CNT modified electrode.
Figure 3. Cyclic voltammogram for electropolymerization of 3-aminophenol from Phosphate buffer solution (pH = 7.0) containing 25 mM 3-aminophenol
3.3. Effects of electrode modification
To study the effects of modification on electrode performance, squarewave voltammograms (SWVs) of paracetamol oxidation were obtained using three types of working electrodes, namely bare
0.2 0.4 0.6 0.8 1.0 1.2
0.0 2.0 4.0 6.0 8.0 10.0 12.0 14.0 16.0
C
u
rre
n
t
/
mi
cro
a
mp
e
re
Potential / Volt (vs Ag/AgCl )
[image:4.596.147.449.382.598.2]
carbon paste electrode (CPE), poly(3-aminophenol) modified carbon paste electrode (PCPE) and carbon paste electrode modified with poly(3-aminophenol) and CNT (CNT-PCPE).
0.2 0.4 0.6 0.8 1.0 0.0
2.0 4.0 6.0 8.0 10.0
C
urrent
/
A
Potential / Volt (A)
run 1
run 15
background
0.2 0.4 0.6 0.8 1.0 20.0
40.0 60.0 80.0 100.0
C
urrent
/
A
Potential / Volt
(B)
run 1
run 15
background
0.2 0.4 0.6 0.8 1.0 40.0
60.0 80.0 100.0 120.0 140.0
C
urrent
/
A
Potential / Volt
(C)
run 1
run 15
background
[image:5.596.187.397.132.724.2]
The SWVs are shown in Figure 4. SWVs of paracetamol obtained using CPE (Figure 4A) showed that the peak current decrease as the measurements were repeated using the same solution. The peak current decrease significantly in the first seven runs and become constant after eight runs. Similar trend was obtained using PCPE. However, peak currents were higher and consistent peaks were obtained after four run (Figure 4B) showing that poly(3-aminophenol) layer improve electrode performance. The peak currents obtained with PCPE were about three times higher than those of CPE. A more consistent and higher peak current was obtained using CNT-PCPE (Figure 4C). The peak currents obtained with CNT-PCPE were about twice as large as those obtained with PCPE showing a significant improvement of measurement sensitivity due to CNT. These results are consistent with those of CNT modified electrode developed in previous studies.[31-34] The performance of CNT-PCPE is better than that of PCPE not only due to its sensitivity but also due to the stability of peak currents obtained from repeated measurements. More consistent peak currents were obtained using CNT-PCPE.
The sensitivity of CNT-PCPE depends on the amount of CNT used to modify CPE. In this study, the highest sensitivity was found when CPE was modified with 40 L of CNT suspension. In addition, sensitivity of CNT-PCPE also depends on the pH of measured solution. Peak currents increase as the pH of measured solution decrease. Similar results were also found in previous study.[30] Therefore, further measurements will be conducted in solution containing phosphate buffer solution (PBS) of pH 5.0 with CNT-PCPE modified with 40 L of CNT suspension to obtain optimum sensitivity.
3.4. Linear range and limit of detection
0.00 0.01 0.02 0.03 0.04 0.05 0.06 0.07 0.08 0.09
0 1 2 3 4 5 6 7 8
Pe
a
k
C
u
rre
n
t
/
A
Concentration / mM
Ip = 92,36 C + 0,06
[image:7.596.157.426.88.317.2]R2 = 0,9998
Figure 5. Calibration curve of Paracetamol
No shift of oxidation peak potential was found in this concentration range (Figure 6). Limit of detection (3) was estimated to be 1.1 M.
0.3 0.4 0.5 0.6 0.7
10 12 14 16 18
C
urrent
/
A
Potential / Volt
0,01 mM 0,1 mM
background
[image:7.596.127.451.443.715.2]
3.5. Real sample analysis
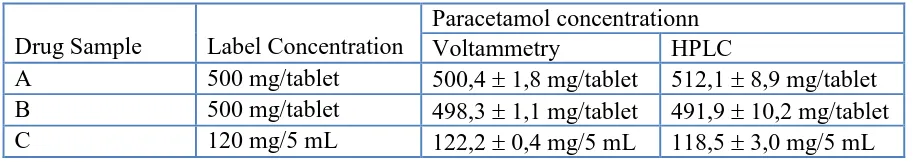
[image:8.596.71.531.223.304.2]Reliability of CNT-PCPE for voltammetric determination of paracetamol was verified through real sample analysis. Three drug samples containing paracetamol were used for this purpose. The results obtained with voltammetric method were compared to those obtained with HPLC method recommended in Farmakope Indonesia.[35] The results are summarized in Table 1.
Table 1. Results of Drug Analysis (n = 5) .
Drug Sample Label Concentration
Paracetamol concentrationn
Voltammetry HPLC
A 500 mg/tablet 500,4 1,8 mg/tablet 512,1 8,9 mg/tablet B 500 mg/tablet 498,3 1,1 mg/tablet 491,9 10,2 mg/tablet C 120 mg/5 mL 122,2 0,4 mg/5 mL 118,5 3,0 mg/5 mL
Table 1 shows that the results of voltammetric method were in a good agreement with those of HPLC method. A t-test ( = 0,05) suggests that there were no significant differences between results of voltammetric method and those of HPLC method. This suggests that CNT-PCPE can be used as working electrode for a reliable voltammetric determination of paracetamol.
4. CONCLUSION
The results show that CNT can be trapped on the surface of CPE through electro-polymerization of 3-aminophenol to produce CNT-PCPE. The performances of CNT-PCPE were significantly better than those of CPE or PCPE because it exhibited a more sensitive and consistent signals. Results of voltammetric determination of paracetamol in real sample were in good agreement with those of HPLC methods proving that CNT-PCPE could be used as a good working electrode for voltammetric determination of paracetamol.
ACKNOWLEDGMENT
Authors gratefully acknowledge the support of Indonesia Managing Higher Education for Relevance and Efficiency (I-MHERE) program from Directorate General of Higher Education under Ministry of National Education, Indonesia, to publish this research. This research was partly supported by Institut Teknologi Bandung research grant.
References
1. M. E. Bosch, A. J. R. Sanchez, F. S. Rojas, C. B. Ojeda, J. Pharm. Biomed. Anal., 42 (2006) 291-321.
3. K. Setiadarma, S. Tino, T. Hermini, Acta. Pharm. Indones., 10 (1985) 37-38. 4. M. K. Srivastava, S. Ahmad, D. Singh., I. C. Shukla, Analyst, 110 (1985) 735-737.
5. B. C. Verma, D. K. Sharma, B. H. G. Rao, V. S. Jamwal, Indian J. Pharm. Sci., 54 (1992) 62-65. 6. C. Burgot, F. Auffret, J. L. Burgot, Anal. Chim. Acta. 343 (1997) 125-128.
7. K. G. Kumar, R. Letha, J. Pharm. Biomed. Anal. 15 (1997) 1725-1728.
8. B. K. Datta, S.C. Bachar, R. Banoo, S. Haque, Indian J. Pharm. Sci. 51 (1989) 270-271. 9. A. A. El Kheir, S. Belal, M. El Sadek, A. El Shanwani, Analyst, 111 (1986) 319-321. 10.A. Criado, S. Cardenas, M. Gallego, M. Valcarcel, Talanta, 53 (2000) 417-423. 11.C. Andres, C. Soledad, G. Mercedes, V. Miguel, Analyst, 125 (2000) 1179-1183. 12.M. Knochen, J. Giglio, B. F. Reis, J. Pharm. Biomed. Anal., 33 (2003) 191-197. 13.N. Aditya, R. K. Arora, T. Meena, Indian J. Pharm. Sci., 68 (2006) 370-373.
14.R. Patidar, U. S. Baghel, S. Pathela, M. Singhal, J. Global Pharm. Techn., 1 (2009) 62-66. 15.A. Eustaquio, M. Blanco, R. D. Jee, A. C. Moffat, Anal. Chim. Acta, 383 (1999) 283-290. 16.Y. Dou, Y. Sun, Y. Ren, P. Ju, Y. Ren, J. Pharm. Biomed Anal., 37 (2005) 543-549.
17.M. Baptistao, W. F. C. Rocha, R. J. Poppi, J. Mol. Struc., 1002, (2011) 167-171.
18.D. J. Speed., S. J. Dicksons., E. R. Cairns., N. D. Kim. , J. Anal. Toxicol., 25 (2001) 198-202. 19.R. B. Prasanna., M. S. Reddy, Asian J. Research Chem., 2 (2009) 70-72.
20.D. P. Uttam., V. N. Abhijit., V. S. Aruna, Electron. J. Chem., 6 (2009) 289-294. 21.H. G. Lu, H. Yuan, Z. R. Ruan, B. Jiang, J. Chromatogr. B, 878 (2010) 682-688.
22.H. Li, C. Zhang, J. Wang, Y. Jiang, J. P. Fawcett, J. Gu, J. Pharm. Biomed. Anal., 51 (2010), 716-722.
23.R. N. Goyal, V. K. Gupta, M. Oyama, N, Bachheti, Electrochem. Commun., 7 (2005) 803-807. 24.P. Norouzi, F. Dousty, M. R. Ganjali, P. Daneshgar, Int. J. Electrochem. Sci., 4 (2009) 1373-1386. 25.X. Kang, J. Wang, H. Wu, J. Liu, I. A. Aksay, Y. Lin, Talanta, 81 (2010) 754-759.
26.M. Behpour, S. M. Ghoreishi, E. Honarmand, Int. J. Electrochem. Sci., 5 (2010) 1922-1933.
27.M. Zidan, T. W. Tee, A. H. Abdullah, Z. Zainal, G. J. Kheng, Int. J. Electrochem. Sci., 6 (2011) 279-288.
28.N. F. Atta, A. Galal, S. M. Azab, Int. J. Electrochem. Sci., 6 (2011) 5082-5096. 29.N. F. Atta, M. F. El-Kady, Talanta, 79 (2009) 639-647.
30.L. Ozcan, Y. Sahin, Sens. Actuators B., 127 (2007) 362-369. 31.M. Li, L. Jing, Electrochim. Acta, 52 (2007) 3250-3257.
32.R. T. Kachoosangi, G. G. Wildgoose, R. G. Compton, Anal. Chim. Acta, 618 (2008) 54-60. 33.R. N. Goyal, A. V. K. Gupta, S. Chatterjee, Sens. Actuators B., 149 (2010) 252-258. 34.T. L. Lu, Y. C. Tsai, Sens. Actuators B., 153 (2011) 439-444.