AND
ATTENUATION COEFFICIENTS
A THESIS SUBMITTED FOR THE DEGREE OF
DOCTOR OF PHILOSOPHY
a t t h e
AUSTRALIAN NATIONAL UNIVERSITY
by
JOSEPH M. M I L L S , JR.
T h i s t h e s i s i s d e d i c a t e d t o
CAROL ANN ANDREW THOMAS
AARON DONALD
and t o t h e m em ory o f
JOHN W. GRAHAM
T h i s t h e s i s i s a d e s c r i p t i o n o f a r e s e a r c h p r o j e c t u n d e r t a k e n d u r i n g t h e p e r i o d O c t o b e r , 1973 t o Ma rc h , 1977, w h i l e I was a f u l l - t i m e s t u d e n t in t h e Research School o f E a r t h S c i e n c e s a t t h e A u s t r a l i a n N a t i o n a l U n i v e r s i t y .
T h e r e s e a r c h w o r k d e s c r i b e d i n t h i s t h e s i s i s e n t i r e l y my own e x c e p t as c i t e d i n t h e a c k n o w l e d g e m e n t s a nd i n t h e t e x t . T h i s t h e s i s has n e v e r been s u b m i t t e d t o a n o t h e r u n i v e r s i t y o r s i m i l a r i n s t i t u t i o n .
«
RAYLEIGH WAVE GROUP VELOCITIES AND ATTENUATION COEFFICIENTS
TABLE OF CONTENTS
Page No.
Acknowledgements *x
P u b l i c a t i o n s x j ^
A b s t r a c t x ‘ '
Chapter 1 INTRODUCTION 1
1.1 Su rf ace Wave I n v e s t i g a t i o n s o f t h e A n e l a s t i c i t y
o f t h e Upper Ma nt l e h
1.2 Scope o f t h i s T h e s i s 8
Chapter 2 DETERMINATION OF GROUP VELOCITY AND SPECTRAL
AMPLITUDE BY NARROW-BAND FILTERING 10
2.1 I n t r o d u c t i o n 10
2 . 2 Gaussian F i l t e r s and t he D e t e r m i n a t i o n o f Group
A r r i v a l Times and S p e c t r a l A m p l i t u d e s 12 2. 3 The D i r e c t F i l t e r i n g Method and t h e A n a l y s i s o f
Long Peri od Seismid Data 17
2. 3* 1 Computers 17
2 . 3 . 2 Data, D i g i t i z a t i o n , D eci mat ion and De t r e n d i n g 17
2 . 3 . 3 E i l t e r i n g 18
2 . 3 . ^ The D i r e c t F i l t e r i n g Method 19 2 . 3 . 5 T e s t s and Comparison w i t h t h e M u l t i p l e F i l t e r
Technique , 23
2 . 3 . 6 A m p l i t u d e s and D e t e r m i n a t i o n o f Q. 30
Chapter 3 GREAT CIRCLE RAYLEIGH WAVE ATTENUATION AND GROUP VELOCITY, OBSERVATIONS FOR PERIODS BETWEEN 150 AND 600 SECONDS FOR 7 GREAT
CIRCLE PATHS 32
3.1 I n t r o d u c t i o n 32
3 . 2 Data Pr ocessi ng Techniques 36
3 . 2 . 1 Measurement o f Group V e l o c i t y 36 3 . 2 . 2 Measurement o f R e l a t i v e S p e c t r a l A m p l i t u d e s
and A t t e n u a t i o n C o e f f i c i e n t s
C h a p t e r 4 GREAT CIRCLE RAYLEIGH WAVE ATTENUATION AND GROUP VELOCITY, OBSERVATIONS FOR PERIODS BETWEEN 50 AND 200 SECONDS FOR
9 GREAT CIRCLE PATHS 53
4.1 I n t r o d u c t i o n 53
4 . 2 Data and P r o c e s s i n g T e c h n i q u e s 55
4 . 2 . 1 Measurement o f Group V e l o c i t y 58
4 . 2 . 2 C a l c u l a t i o n o f G r e at C i r c l e Group V e l o c i t i e s
and t h e i r V a r i a n c e s 58
4 . 3 C a l c u l a t i o n o f Phase V e l o c i t i e s and F r ee O s c i l l i a t i o n
P e r i o d s f r o m G r e a t C i r c l e Group V e l o c i t i e s 73 4 . 3 . 1 Phase V e l o c i t i e s and t h e i r V a r i a n c e s
C a l c u l a t e d by I n t e g r a t i o n o f Group V e l o c i t i e s 74 4 . 3 . 2 C a l c u l a t i o n o f E q u i v a l e n t S p h e r o i d a l
O s c i l l a t i o n P e r i o d 76
4 . 4 D i s c u s s i o n 77
4 . 5 Summary
87
C h apt er 5 INVERSION OF GLOBAL AVERAGE GROUP VELOCITIES
AND ATTENUATION COEFFICIENTS 88
5.1 I n v e r s i o n T e c h n i q u e s 88
5-2 C o n t r o l l e d Monte C a r l o I n v e r s i o n o f R a y l e i g h Wave
Group V e l o c i t i e s 90
5 -3 The C o r r e c t i o n o f Observed Group V e l o c i t i e s f o r
A n e l a s t i c i t y 94
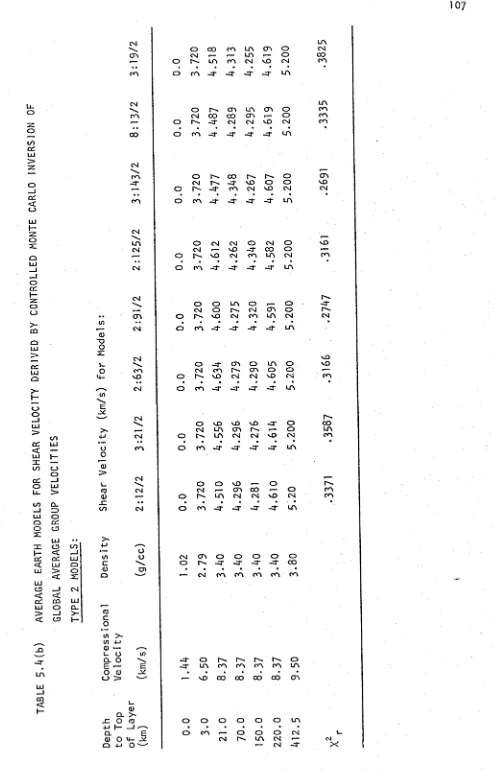
5-4 Shear V e l o c i t y Models f o r t h e Upper M a n t l e
98
5 . 5 Q " 1 Model s 113
5 . 6 E r r o r s i n E s t i m a t e s o f A t t e n u a t i o n and t h e i r
e f f e c t s on Q.'^ Model s 122
C h a p t e r 6 THRUST FAULTING AND CRUST-UPPER MANTLE
STRUCTURE IN EASTERN AUSTRALIA 124
6 . 1 6. 2
6 . 3
6 . 4
I n t r o d u c t i o n 124
S u r f a c e Wave D i s p e r s i o n
128
6 . 2 . 1 I n s t r u m e n t a l Response 128
6 . 2 . 2 Group V e l o c i t y D i s p e r s i o n 129
C o n t r o l l e d Monte C a r l o I n v e r s i o n o f Group V e l o c i t i e s 143 6 . 3 . 1 Monte C a r l o i n v e r s i o n o f S u r f a c e Wave
Group V e l o c i t i e s 143
6 . 3 . 2 Model s g e n e r a t e d by C o n t r o l l e d Monte C a r l o
I n v e r s i o n s 155
6 . 3 . 3 Compar i son o f Observed and M o d e l l e d Shear
Wave T r a v e l Times 159
Source P ar a me te r s 165
6 . 4 . 1 P-wave F i r s t M o t i o n s 165
6 . 4 . 2 Source P ar a me te r s f r o m S y n t h e t i c s o f S u r f a c w
Waves 165
6 . 4 . 2 . 1 A t t e n u a t i o n 167
( c o n t d , )
Page No C h a p t e r 6
6 . 4 . 3 C o m p a r i s o n o f Body and S u r f a c e Wave
Meehani sm 174
6 . 4 . 4 A f t e r s h o c k s , S l i p and S t r e s s Dr op 175
6 . 5 C o n c l u s l o n s 180
C h a p t e r 7 REGIONALIZATION AND PURE PATH MODELS FOR
SHEAR VELOCITY AND ATTENUATION 1 8 3
7 . 1 I n t r o d u c t i o n 1 8 3
7 . 2 R e g i o n a l i z a t i o n o f M i x e d P a t h G r o u p V e l o c i t i e s
and A t t e n u a t i o n C o e f f i c i e n t s 1 8 5
7 . 3 G r o u p V e l o c i t y R e g i o n a l i z a t i o n 1 9 8
7 . 4 R e g i o n a l Shear V e l o c i t y M o d e l s f o r Oceans and
C o n t i n e n t s 2 1 8
7 . 5 C T j R e g i o n a l i z a t i o n
Q ^ I n v e r s i o n s f o r O c e a n i c and C o n t i n e n t a l R e g i o n s
2 3 9
7 . 6 2 4 3
C h a p t e r 8 SUMMARY 2 4 7
Page No.
FIGURES
Ch a p t e r 2
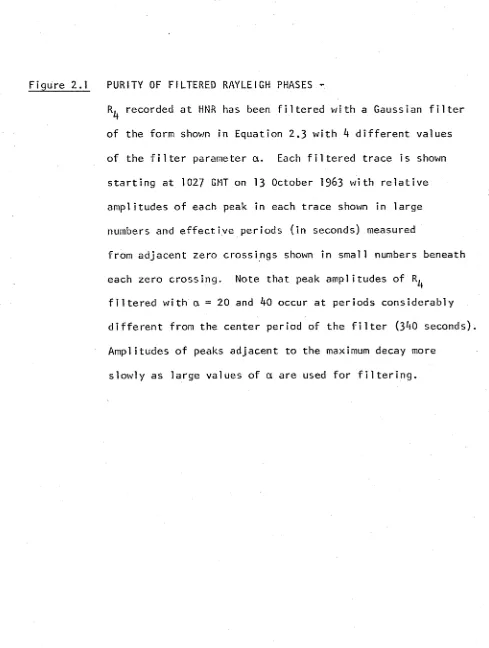
2. 1 P u r i t y o f F i l t e r e d R a y l e i g h P h a s e s 15
2 . 2 D i r e c t F i l t e r i n g Method 20
2 . 3 D i r e c t F i l t e r i n g Method D i s p l a y o f Envel ope Maxima 21
2 . 4 D i r e c t F i l t e r i n g Method Summary T a b l e 22
2 . 5 A n a l y s i s o f Two S y n t h e t i c Sei smogr ams by t h e
t h e D i r e c t F i l t e r i n g Method and t h e
M u l t i p l e F i l t e r T e c h n i q u e 24
2 . 6 R a y l e i g h Wave D i s p e r s i o n from t h e P i c t o n
E a r t h q u a k e (9 March 1973) r e c o r d e d a t C h a r t e r s
Tower s , Queens l and 26
CHAPTER 3
3. 1 Gr e a t C i r c l e P a t h s 34
3 . 2 Group V e l o c i t y and A t t e n u a t i o n C o e f f i c i e n t s f o r
S t a t i o n s CTA and SBA 39
3 . 3 Group V e l o c i t y and A t t e n u a t i o n C o e f f i c i e n t s f o r
S t a t i o n s TOL and HNR 40
3 . 4 Group V e l o c i t y and A t t e n u a t i o n C o e f f i c i e n t s f o r
S t a t i o n s BUL, DUG and ADE 41
3.5
Group V e l o c i t y and A t t e n u a t i o n C o e f f i c i e n t s f o rS t a t i o n s A F I , 1ST and AQU 42
3.6
Group V e l o c i t i e s Computed fr om t h e Sum ofA u t o c o r r e l o g r a m s f o r S t a t i o n s AFI and 1ST 44
3.7
Aver aged Group V e l o c i t i e s and A t t e n u a t i o n C o e f f i c i e n t sf o r S t a t i o n 1ST 45
3.8
A t t e n u a t i o n C o e f f i c i e n t s and QR1s a r e d i s p l a y e din t h r e e d i f f e r e n t f o r m a t s 46
3.9
Gl obal Aver a g e Gr e a t C i r c l e Group V e l o c i t i e s andA t t e n u a t i o n C o e f f i c i e n t s 51
C h a p t e r 4
4. 1 Gr e a t C i r c l e P a t h s
4 . 2 Group V e l o c i t i e s , A mp l i t u d e s f o r S t a t i o n s 59~66
4.3
Gl obal Aver age G r e a t C i r c l e Group V e l o c i t i e s andA t t e n u a t i o n C o e f f i c i e n t s 71
4 . 4 Compar i son o f Gl obal Av e r a g e Group V e l o c i t i e s w i t h
Chapter 4 (contd.)
Page No.
4.5 Q for Rayleigh Waves 86
Chapter 5
5-1 Flow Chart for a Controlled Monte Carlo Inversion
Program 91
5.2 Shear Velocity Models from Type 1 Bounds 101
5-3 Shear Velocity Models from Type 2 Bounds 102
5-4 Shear Velocity Models derived from a Constant
velocity Upper Mantle - 100 km Lid Thickness 1 04
5-5 Shear Velocity Models derived from a Constant
velocity Upper Mantle - 70 km Lid Thickness 105
5.6 Partial Derivatives of Phase and Group Velocity
with respect to Compressional Velocity,
Shear Velocity and Density - for Model 2:91/2 111
5-7 Partial Derivatives of Phase and Group Velocity
with respect to Compressiona1 Velocity,
Shear Velocity and Density - for Model 2:91/2 112
5.8 Models for Specific Attenuation for Shear Waves
- 70 km Lid Thickness for periodsfrom 50 to 300
seconds 11 5
5-9 Models for Specific Attenuation for Shear Velocity
- 100 km Lid Thickness for periodsfrom 50 to 300
seconds 116
5-10 Models for Specific Attenuation for Shear Waves
- 70 km Lid Thickness for periodsfrom 60 to 300
seconds 117
5.11 Resolution Kernels for Models 3/T and 3/50 121
Chapter 6
6.1 Southeast Australia 125
6.2 CTA Low-gain vertical Seismograms and Synthetics 130
6.3 CTA Low-gain vertical Seismogram 131
6.4 CTA Low-gain transverse seismogram 132
6.5 Digital High-gain Seismograms 133
6.6 ADE Seismograms and Synthetic Seismograms 134
6.7 Rayleigh Wave Group Velocity Dispersion from
the Vertical CTA High-gain Digital Seismogram 136
6.8 Rayleigh Wave Group Velocity Dispersion from
Page No. C h a p t e r 6 ( c o n t d , )
6 . 9 Love Wave Group V e l o c i t y D i s p e r s i o n f r o m
t h e CTA H l g h - g a i n Seismogram 138
6 . 1 0 R a y l e i g h Wave Group V e l o c i t y D i s p e r s i o n f r o m
t h e ADE Long P e r i o d V e r t i c a l Seismogram 139 6.11 Love Wave Group V e l o c i t y D i s p e r s i o n f r o m t h e
ADE Long P e r i o d N-S Seismogram 140
6 . 1 2 R a y l e i g h Wave Group V e l o c i t y D i s p e r s i o n f r o m
t h e TAU Long P e r i o d V e r t i c a l Sei smogram l 4 l
6 .1 3 Group V e l o c i t i e s 157
6 . 1 4 P a r t i a l D e r i v a t i v e s o f Group V e l o c i t y w i t h
r e s p e c t t o Shear V e l o c i t y in Model CTA2S1 15 8
6 . 1 5 Model s 164
6 . 1 6 Focal Mechanism S o l u t i o n s 166
6. 17 A f t e r s h o c k L o c a t i o n s 170
6 . 1 8 Sou rc e A m p l i t u d e and Phase S p e c t r a 172
C h a pt e r 7
7.1 An O r i g i n a l R e g i o n a l i z a t i o n Based on 4 Upper
M a n t l e P r o v i n c e s 186
7 . 2 A R e g i o n a l i z a t i o n pr opposed by Wu (1972) 188
7 - 3 Group V e l o c i t i e s and A t t e n u a t i o n C o e f f i c i e n t s
7 - 3 - 1 f o r P at hs 1, 2 and 3 192
7 - 3 . 2 f o r Pat hs 4 , 5 and 6 193
7 . 3 . 3 f o r Pat hs 7 , 8 and 9 194
7 . 4 R e s i d u a l A t t e n u a t i o n and Group V e l o c i t y D i s p e r s i o n 195 7 . 5 Pure Pat h Group V e l o c i t i e s D e r i v e d u s i n g t h e
O r i g i n a l R e g i o n a l i z a t i o n 199~200
7 . 6 Pure Pat h Group V e l o c i t i e s D e r i v e d u s i n g t h e
Wu (1972) R e g i o n a l i z a t i o n 201- 203
7 . 7 Shear V e l o c i t y Model s D e r i v e d f r o m Pure Path
O cea ni c Group V e l o c i t i e s 21 9*~223
7 . 8 Shear V e l o c i t y Model s D e r i v e d f r o m Pure Path
C o n t i n e n t a l Group V e l o c i t i e s 229^233
7 - 9 Pur e Path Q.
p
D e r i v e d u s i n g t h e Wu (1972)R e g i o n a l i z a t i o n 240-241
7 . 1 0 Oc ea n ic Models f o r S p e c i f i c A t t e n u a t i o n f o r
Shear Waves 244
TABLES
v i i
Page No.
2.1 Ha 1 f • ' w i d t h s o f Gaussi an F i l t e r s ( i n s ec onds )
computed f o r a F i l t e r P a r a m e t e r o f
b
0 28 2 . 2 Decrement i n F i l t e r e d A m p l i t u d e s caused byF i l t e r T r u n c a t i o n 29
3*1 L i s t o f S t a t i o n s and D i g i t i z a t i o n P a r a m e t e r s f o r
K u r i l e I s l a n d s E a r t h q u a k e o f 13 O c t o b e r 1963 37 3 . 2 G l o b a l Av er ag e A t t e n u a t i o n C o e f f i c i e n t s and
Group V e l o c i t i e s 50
b.
1 K u r i l e I s l a n d s E a r t h q u a k e s 57b.2
E x p r e s s i o n s f o r G r e a t C i r c l e Group V e l o c i t y and t h e V a r i a n c e s d e r i v e d f r o m Group V e l o c i t i e sf o r R^ , , R^ and R^ C o m b i n a t i o n s 68
A .
3 G l o b a l A v e r ag e s f o r a l l Pat hs - 50 t o 550 SecondP e r i o d s 72
A . A
Fundamental S p h e r o i d a l Mode O b s e r v a t i o n s-Compar i son w i t h Model QM2 81 —84
5.1 K u r i l e I s l a n d s E a r t h q u a k e s 93
5 . 2 G l o b a l Av er a ge Group V e l o c i t i e s C o r r e c t e d f o r
A n e l a s t i c D i s p e r s i o n 97
5 - 3 S t a r t i n g Model Bounds on Shear V e l o c i t y Model s D e r i v e d by C o n t r o l l e d Monte C a r l o I n v e r s i o n
o f G lo b a l A v e r a g e Group V e l o c i t i e s 99- 10 0 5.
A
A v e r a g e E a r t h Models f o r Shear V e l o c i t y d e r i v e dby C o n t r o l l e d Monte C a r l o I n v e r s i o n o f G l o b a l
A ver ag e Group V e l o c i t i e s 106- 109
5 - 5 0. Model s (a) D e r i v e d f r o m 2:91 118
(b) D e r i v e d f r o m
b:bb
1196.1 CTA and ADE Group V e l o c i t i e s I A5- I A7
6 . 2 Shear V e l o c i t y Model s D e r i v e d f r o m C o n t r o l l e d
Monte C a r l o I n v e r s i o n s
1 A 8 - 1 5 A
6 . 3 S t a r t i n g Model Bounds 160 — 161
6 . A Shear Wave T r a v e l Times 162
6 . 5 J o i n t R e l a t i v e L o c a t i o n s 177-178
7.1 Pure Pat h C o m p o s i t i o n f o r I n d i v i d u a l S t a t i o n s
and Paths 189-191
TABLES ( c o n t d . )
7- 3 Oc e a n i c Models Based on 5- 08 M
7 . 4 2 Regi on Models G e n e r a t e d f r om a C o n s t a n t
V e l o c i t y ( 4 . 4 km/ s) Upper Ma n t l e
7 . 5 C o n t i n e n t a l Models w i t h High V e l o c i t y Li ds a t 200 km
7 . 6 2 Regi on Oceani c Models f o r A t t e n u a t i o n
b as ed on 1 9 : 5 / 2 0
Page No.
224- 227
228
ix
ACKNOWLEDGEMENTS
1 am i n d e b t e d t o my s u p e r v i s o r P r o f e s s o r A n t o n L. H a l e s , w h o s e
i n s i g h t i n t o g e o p h y s i c a l p r o b l e m s a n d a c a d e m i c p o l i t i c s h a s n e v e r c e a s e d
t o a m a z e me. H i s a d v i c e a nd e n c o u r a g e m e n t h a s b e e n a c o n t i n u a l a i d i n
t h e c o m p l e t i o n o f t h i s t h e s i s .
P r o f e s s o r Adam D z i e w o n s k i o f H a r v a r d U n i v e r s i t y i n t r o d u c e d me
t o t h e m e t h o d s o f a n a l y s i s o f s u r f a c e w a v e s i n h i s c o u r s e on s e i s m o l o g y
a t t h e U n i v e r s i t y o f T e x a s a t D a l l a s , He h a s c o n t r i b u t e d g r e a t l y t o my
d e v e l o p m e n t w i t h many d i s c u s s i o n s , s u g g e s t i o n s a n d i n h i s g u i d a n c e i n
t h e d e v e l o p m e n t o f t h e R e s i d u a l D i s p e r s i o n M e a s u r e m e n t .
1 a l s o e x t e n d my t h a n k s t o D r . Th o ma s J . F i t c h (now a t
M a s s a c h u s e t t s I n s t i t u t e o f T e c h n o l o g y , L i n c o l n L a b o r a t o r y ) f o r s u g g e s t i n g
o u r j o i n t a n a l y s i s o f t h e P i c t o n e a r t h q u a k e ( C h a p t e r 6) i n w h i c h h e i s
p r i m a r i l y r e s p o n s i b l e f o r t h e d e t e r m i n a t i o n o f t h e s o u r c e m e c h a n i s m
s o l u t i o n , a f t e r s h o c k l o c a t i o n s a n d d e t e r m i n a t i o n o f s e i s m o g r a p h c o n s t a n t s
T h e i d e a o f i n v e r s i o n o f s u r f a c e wa v e d i s p e r s i o n d a t a u s i n g a
c o n t r o l l e d Mo n t e C a r l o i n v e r s i o n t e c h n i q u e wa s f i r s t s u g g e s t e d t o me by
Dr . J o s e p h F. G e t t r u s t (now a t t h e U n i v e r s i t y o f H a w a i i ) .
P r o f e s s o r D z i e w o n s k i a nd D r s . R . S . A n d e r s t e n a n d R . L . P a r k e r
( U n i v e r s i t y o f C a l i f o r n i a a t San D i e g o ) e n l i g h t e n e d me i n t h e p i t f a l l s a n d
p r o b l e m s o f i n v e r s i o n t e c h n i q u e s a n d t h e i r a p p l i c a t i o n t o g e o p h y s i c a l d a t a
D r s . R . S . A n d e r s s e n a n d F . R . d e Hoog o f t h e C o m p u t e r C e n t e r a n d
P r o f e s s o r P . A . P . Mor a n o f t h e R e s e a r c h S c h o o l o f S o c i a l S c i e n c e s a r e
t h a n k e d f o r t h e i r a s s i s t a n c e i n t h e f o r m u l a t i o n o f t h e v a r i a n c e o f p h a s e
v e l o c i t i e s c a l c u l a t e d by i n t e g r a t i o n o f g r o u p v e l o c i t i e s ( S e c .
4
.3
-1
) .1 h a v e b e n e f i t e d g r e a t l y f r o m c o n v e r s a t i o n s w i t h P r o f e s s o r
Drs, R.C. Liebermann, J,R. Cleary and J,M.W. Rynn have critically
read papers for publication and made many constructive comments to my
benefit. Dr. J.M.W. Rynn was most helpful in his critical comments
on early drafts of this thesis.
The following individuals allowed me to use their computer
programs: Dr Brian Mitchell (stochastic inversion program for Q ^);
Professor A.M, Dziewonski (multiple filter analysis and free oscillation
period calculation programs); Dr. John Goncz (surface wave dispersion
calculation program); Dr. David Harkrider (surface wave dispersion and
synthetic seismogram programs); Mr. Lee Belbin (global map generation
program); Dr. R.L, Parker (line printer contouring program); and
Dr. B.R. Julian (ray tracing program).
Mrs. I.J. Weekes, Mrs. L. Hodgson and Mrs. Clementine Krayshek
have drafted some of the figures which are included in this thesis.
The operations and programming staff at the Computer Center have been of
enormous aid throughout the course of the research described in this
thesis.
My special thanks is also extended to the faculties and to my
fellow students at both the University of Texas at Dallas and at R.S.E.S.
x i
EARLIER PUBLICATIONS
D z i e w o n s k i , A . M . , M i l l s , J . M , J r , and B l o c h , S . , 1972. R e s i d u a l d i s p e r s i o n measurement - a new method o f s u r f a c e - w a v e a n a l y s i s . B u l l . S e i s . Soc. Am. , 6 2 , 129^139.
PUBLICATIONS DURING THE COURSE OF THIS WORK
M i l l s , J . M. J r . and F i t c h , T . J . , 1977- T h r u s t f a u l t i n g and c r u s t - u p p e r m a n t l e s t r u c t u r e i n e a s t A u s t r a l i a . Geophys. J . Roy. A s t r . S o c .
(Ac ce pt ed f o r p u b l i c a t i o n . )
M i l l s , J . M. J r . and H a l e s , A . L . , 1977. G r e a t c i r c l e R a y l e i g h wave a t t e n u a t i o n and g r o u p v e l o c i t y , P a r t 1: O b s e r v a t i o n s f o r p e r i o d s bet ween 150 and 600 seconds f o r 7 g r e a t c i r c l e p a t h s . Phys. E a r t h P l a n e t . I n t . ( A cc e pt ed f o r p u b l i c a t i o n . )
M i l l s , J . M. J r . and H a l e s , A . L . , 1977- G r e a t c i r c l e R a y l e i g h wave a t t e n u a t i o n and g r o u p v e l o c i t y , P a r t I I : O b s e r v a t i o n s f o r
Th e a n a l y s i s o f g r o u p v e l o c i t i e s and a t t e n u a t i o n c o e f f i c i e n t s f o r R a y l e i g h Waves i n t h e p e r i o d r a n g e 50 t o 600 s e c o n d s p r o v i d e s
i n f o r m a t i o n on t h e a v e r a g e e l a s t i c and a n e l a s t i c p r o p e r t i e s o f t h e e a r t h a t u p p e r m a n t l e d e p t h s . The D i r e c t F i l t e r i n g Met hod has been d e v e l o p e d f o r t h i s a n a l y s i s and p r o v i d e s o b j e c t i v e e s t i m a t e s o f g r o u p a r r i v a l t i m e s , t h e i r s t a n d a r d e r r o r s and s p e c t r a l a m p l i t u d e s f r o m G a u s s i a n f i l t e r e d s e i s m o g r a m s . E s t i m a t e s o f t h e p e r i o d a t t h e e n v e l o p e maximum a r e a l s o made t o e s t i m a t e t h e p u r i t y o f t h e f i l t e r e d s i g n a l a t t h e g r o u p a r r i v a l t i m e .
Th e D i r e c t F i l t e r i n g Met hod has been a p p l i e d t o s e i s m o g r a m s o f 4 K u r i l e I s l a n d s e a r t h q u a k e s r a n g i n g i n m a g n i t u d e f r o m 6 . 6 t o 8 . 3 * T h e s e e v e n t s a r e l o c a t e d w i t h i n a s m a l l r e g i o n so t h a t R a y l e i g h waves f r o m a l l e v e n t s t r a v e r s e t h e same g r e a t c i r c l e p a t h s . G r e a t c i r c l e g r o u p v e l o c i t i e s f o r t h e p e r i o d r a n g e 100 t o 600 s e c o n d s ha v e been d e t e r m i n e d f o r t h e m a g n i t u d e 8 . 3 e v e n t by a v e r a g i n g o f g r o u p v e l o c i t i e s o f R a y l e i g h p h a s e s a r r i v i n g a f t e r R^. A t t e n u a t i o n c o e f f i c i e n t s f o r p e r i o d s
b e t w e e n 100 and 450 s e c o n d s h a v e been d e t e r m i n e d f r o m s p e c t r a l a m p l i t u d e s d e t e r m i n e d ( l ) f r o m t h e r a t e o f d e c a y o f e n v l e o p e maxima o f G a u s s i a n f i l t e r e d R a y l e i g h p h a s e s and ( 2) f r o m t h e r a t e o f d e c a y o f s p e c t r a l a m p l i t u d e s t a k e n as t h e sum o f t h e p r o d u c t s o f a p u r e s i n e wave w i t h s e g m e n t s o f e a c h R a y l e i g h p h a s e w i t h i n a g r o u p v e l o c i t y w i n d o w . B o t h m e t h o d s p r o v i d e s i m i l a r e s t i m a t e s o f a t t e n u a t i o n c o e f f i c i e n t s .
G r o u p v e l o c i t i e s and s p e c t r a l a m p l i t u d e s d e t e r m i n e d f o r 3 o t h e r K u r i l e I s l a n d s e a r t h q u a k e s h a v e e x t e n d e d t h e r a n g e o f a c c u r a t e m e a s u r e m e n t s t o p e r i o d s a s s h o r t as 50 s e c o n d s . T h e s e m e a s u r e m e n t s t a k e n w i t h t h o s e f o r t h e l a r g e r e v e n t p r o v i d e a v e r a g e s f o r g r o u p v e l o c i t i e s and a t t e n u a t i o n
x i i i
a t t e n u a t i o n c o e f f i c i e n t s o v e r a i l p a t h s p r o v i d e s a r e l i a b l e e s t i m a t e o f g l o b a l a v e r a g e g r o u p v e l o c i t i e s f o r p e r i o d s between 50 and 600 seconds and a t t e n u a t i o n c o e f f i c i e n t s f o r p e r i o d s between 50 and 450 s e co n d s . G l o b a l a v e r a g e phase v e l o c i t i e s have been c a l c u l a t e d by i n t e g r a t i n g g l o b a l a v e r a g e g o r u p v e l o c i t i e s . G l o b a l a v e r a g e g r o u p v e l o c i t i e s and e q u i v a l e n t s p h e r o i d a l o s c i l l a t i o n p e r i o d s d e r i v e d f r o m t h e g l o b a l a v e r a g e phase v e l o c i t i e s a r e in p oo r a g r e e m e n t w i t h t h o s e c a l c u l a t e d f o r most r e c e n t e a r t h m o d e l s , i n c l u d i n g QM2, o f H a r t e t _ a l . ( 1 9 7 7 b ) . In f u t u r e
i n v e r s i o n s o f d a t a s e t s f o r a v e r a g e e a r t h model s e q u i v a l e n t f r e e
o s c i l l a t i o n p e r i o d s on s u r f a c e wave phase o r g r o u p v e l o c i t i e s i n t h e p e r i o d r a n ge 50 t o 150 seconds a r e n e c e s s a r y s i n c e body wave t r a v e l t i m e s t o g e t h e r w i t h f r e e o s c i l l a t i o n d a t a f o r p e r i o d s i n ex c es s o f 140 seconds do n o t a d e q u a t e l y c o n s t r a i n upper m a n t l e s t r u c t u r e o f such m o d e l s .
Upper m a n t l e s hear v e l o c i t i e s and q J have been d e t e r m i n e d f r o m p
g l o b a l a v e r a g e g r o u p v e l o c i t i e s and a t t e n u a t i o n c o e f f i c i e n t s f o r p e r i o d s between 50 and 300 s e co n d s . Shear v e l o c i t y model s d e t e r m i n e d f r o m g l o b a l a v e r a g e g r o u p v e l o c i t i e s a l o n e show t h a t t h e a v e r a g e t h i c k n e s s o f t h e
l i t h o s p h e r e c a n n o t be d e t e r m i n e d w i t h p r e c i s i o n . G l o b a l a v e r a g e model s f o r s h e a r wave s p e c i f i c a t t e n u a t i o n ( Q ^ ) i n d i c a t e t h a t a zone o f h i g h a t t e n u a t i o n i s c o i n c i d e n t w i t h t h e l ow v e l o c i t y z ones b e g i n n i n g a t d e p t h s r a n g i n g f r o m 70 t o 100 km. A v e r a g e Q^, f o r t h e l i t h o s p h e r e , l o w - v e l o c i t y z one and s u b - l o w v e l o c i t y l a y e r 1 a s t h e n o s p h e r e ) a r e a p p r o x i m a t e l y 2 00 , 85 t o 110 and 170 t o 200 r e s p e c t i v e l y .
Pure P at h a v e r a g e s f o r g r o u p v e l o c i t i e s and s p e c i f i c a t t e n u a t i o n have been c a l c u l a t e d f r o m i n d i v i d u a l o b s e r v a t i o n s and f r o m p a t h a v e r a g e s f o r 2 r e g i o n a l i z a t i o n s , one o r i g i n a l t o t h i s s t u d y and t h e o t h e r d e v i s e d by Wu
( 1 9 7 2 ) . Both a r e based on 4 u p p er m a n t l e p r o v i n c e s : ocean b a s i n s ,
c o n t i n e n t , i s l a n d a r c and m i d - o c e a n r i d g e . Pur e p a t h g r o u p v e l o c i t i e s and s p e c i f i c a t t e n u a t i o n have a l s o been c a l c u l a t e d f o r c o m b i n a t i o n s o f r e g i o n s and p r o v i d e w e l l s e p a r a t e d r e g i o n a l measur ement s f o r such c o m p o s i t e
t h a t a l ow v e l o c i t y zone i s r e q u i r e d b e n ea th t h e o c e a n s , b u t i s n o t
r e q u i r e d b e n e a t h c o n t i n e n t s , A r e g i o n a l s t u d y o f g r o u p v e l o c i t y d i s p e r s i o n > t h r u s t f a u l t i n g i n e a s t e r n A u s t r a l i a shows t h a t a l ow v e l o c i t y z one i s r e q u i r e d a t d e p t h s g r e a t e r t h a n lAO and p r o b a b l y g r e a t e r t h a n 180 km i n o r d e r t o f i t o b s e r v e d f u n d a m e n t a l and h i g h e r mode Love and R a y l e i g h wave g r o u p v e l o c i t i e s and ScS t r a v e l t i m e s .
Q.
\
d e t e r m i n e d f r o m p a t h a v e r a g e g r o u p v e l o c i t i e s anda t t e n u a t i o n c o e f f i c i e n t s has been r e g i o n a l i z e d s u c c e s s f u l l y f o r 2 and 3 r e g i o n c o m b i n a t i o n s . The r e s u l t i n g p u r e p a t h Q. ^ f o r c o n t i n e n t s i s much l o w e r t h a n t h a t f o r ocean b a s i n s and o c e a n - r i d g e p r o v i n c e s . I n v e r s i o n
o f Q
\
f o r o c e a n - r i d g e p r o v i n c e s shows t h a t t h e a v e r a g e 0o f o r t h eR p
1
CHAPTER 1
INTRODUCTION
S i n c e 1912 when A l f r e d Wegener ( 1 9 2 9 ) p r o p o s e d t h e t h e o r y o f c o n t i n e n t a l d r i f t , o u r k n o w l e d g e o f t h e d y n a m i c s o f c o n t i n e n t a l and o c e a n i c p l a t e s and t h e i n t e r n a l s t r u c t u r e o f t h e e a r t h has i n c r e a s e d m a n y f o l d . Our u n d e r s t a n d i n g o f t h e n a t u r e o f t h e o c e a n f l o o r and i t s r e l a t i o n t o t h e m o t i o n o f t h e l i t h o s p h e r i c p l a t e s was g r e a t l y a d v a n c e d d u r i n g t h e 1 9 6 0 ' s a n d e a r l y 1 9 7 0 ' s by Hess ( 1 9 6 2 ) , V i n e and M a t t h e w s ( 1 9 6 3 ) , W i l s o n ( 1 9 6 5 ) , M c K e n z i e and P a r k e r ( 1 9 6 7 ) , Mor gan ( 1 9 6 8 ) , Le P i c h o n ( 1 9 6 8 ) and o t h e r s .
The o b s e r v a t i o n and m o d e l l i n g o f s e i s m i c wave t r a v e l t i m e s and a m p l i t u d e s p r o v i d e d i r e c t e v i d e n c e on t h e s t a t e o f m a t e r i a l i n r e g i o n s o f t h e e a r t h ' s i n t e r i o r w h i c h a r e n o t o t h e r w i s e r e a d i l y a v a i l a b l e t o o u r
i n v e s t i g a t i o n . Of t h e body p h a s e s , n e i t h e r c o m p r e s s i o n a 1 (P) o r s h e a r (S) w a v es w i l l b o t t o m i n a p r o n o u n c e d l o w v e l o c i t y z o n e . The a d d i t i o n a l
p r o p e r t y , t h a t body p h a s e s do n o t a v e r a g e l a t e r a l l y o v e r l a r g e p o r t i o n s o f t h e e a r t h ' s m a n t l e , makes t hem l e s s s u i t a b l e t h a n s u r f a c e wa v e s f o r
s t u d i e s o f t h e a v e r a g e r e g i o n a l p r o p e r t i e s o f t h e e a r t h ' s u p p e r m a n t l e . The s t u d y o f t h e g r a v e r f r e e o s c i l l a t i o n modes l e a d s t o p r o b l e m s i n t h e o p p o s i t e s e n s e , n a m e l y t h a t o f a v e r a g i n g o v e r e x t e n s i v e p o r t i o n s o f t h e e a r t h ' s
i n t e r i o r . T h u s , t h e m o s t s u i t a b l e m e t h o d f o r t h e i n v e s t i g a t i o n o f t h e a v e r a g e r e g i o n a l e l a s t i c and a n e l a s t i c p r o p e r t i e s o f t h e e a r t h a t u p p e r m a n t l e d e p t h s i s t h e s t u d y o f t h e d i s p e r s i o n and a t t e n u a t i o n o f l o n g p e r i o d s u r f a c e w a v e s .
inference being based on S-wave travel times from explosions and on G wave
group velocities. Toksoz and Anderson (1966) demonstrated that the upper
mantle structure is laterally heterogenous. Shear velocity models derived
from pure path phase velocities (Toksoz, et_ al_. I
967
) indicated that apronounced low velocity zone exists beneath the oceans and tectonic regions.
This was the first indication that mantle shear velocities beneath continents,
oceans and tectonic regions were genuinely different.
The motion of the oceanic lithosphere, whether by mantle
convection (Ringwood and Green 1966, Ringwood 1969, McKenzie 1969b) or by
gravity sliding (Hales 1969) requires flow in some region of mantle and
probably, therefore, zones of low viscosity. These low viscosity regions
are generally thought to coincide with regions of high seismic wave atten
uation and low shear velocity (Anderson 1966). Recent studies show that the
shear wave low velocity zone is present beneath the oceans beginning at
depths of 30 to 90 km, depending on the age of the oceanic lithosphere
(Forsyth 1977), and beneath the continents at depths of 100 km or more
(Knopoff 197^)- Such low velocity /high attenuation zones are thought to
be caused by partial melting of mantle material (Walsh 1968) from which
basaltic magmas are formed by processes of partial fusion and fractional
crystallization (Green and Ringwood 1967). Whether low viscosity is
restricted to zones of high attenuation has, however, been questioned
recently by O'Connell (1977).
Studies of attenuation of surface waves have only recently begun
to provide information on attenuation in the crust and upper mantle.
Kanamori's (1970a)estimates of attenuation for great circle Rayleigh and
Love waves pioneered the study of attenuation in the upper mantle. More
recent studies have provided information on attenuation for surface waves
which sample the crust and the uppermost mantle but do not sample to
3
MANTLE,
Surface waves which sample the crust and upper mantle to depths of
several hundred kilometers provide information on anelasticity not
available through body wave studies, since measurements of body wave
attenuation require pure phases (Kanamori 1367)- S-wave arrivals which
sample the low velocity zone appear as late arrivals and do not bottom in
the low velocity zona Consequently measurements of attenuation in this zone
are at best difficult.
As early as 1958, Sato calculated attenuation from G wave spectral
amplitudes. For each spectral component, the amplitude of a surface wave
decays as exp (-ttAQ. V tU) , where T is the period, A the epicentral distance,
U the group velocity and Q. ^ the specific attenuation. Since Q. ^ is defined
as the ratio of energy lost per cycle to energy stored in the wave, Q. ^ is
a direct measure of anelasticity. At least two measurements of the amplitude
of a surface wave along its path of propagation, as well as a measurement of
the group velocity for that segment of the path between the stations, are
needed to compute Q ^ for the path. This measurement of the specific
attenuation is an average of Q ^ for Love waves and Q. ^ and Q g for Rayleigh
waves weighted by the surface wave amplitudes as a function of depth. Q ^
can be measured from seismograms recorded at two or more stations along a
great circle path or from a single seismogram which contains multiple passages
of a surface wave phase which travels two or more full circuits of the earth.
The precision of Q. ^ measurements is dependent upon the precision
of both group velocity and spectral amplitude measurements. For accurate
determination of Q. \ paths must be long enough to provide decrements in
amplitude over the path length which are large enough for accurate calculation
of the amplitude ratio and yet short enough so that amplitudes of the phase
5
a p a t h w i t h a Q o f 200 m e a s u r e d a t a p e r i o d o f 300 s e c o n d s , a 10 p e r c e n t d e c r e m e n t i n a m p l i t u d e r e q u i r e s a p a t h l e n g t h o f 7 500 km, a 25 p e r c e n t d e c r e m e n t , a p a t h l e n g t h o f 2 0 5 0 0 km, and a 5 0 p e r c e n t d e c r e m e n t a p a t h
l e n g t h o f 4 9 5 0 0 km. P u r e p a t h s o f s u c h l e n g t h s a r e d i f f i c u l t t o f i n d e i t h e r b e t w e e n s t a n d a r d s e i s m i c s t a t i o n s o r b e t w e e n s e i s m i c z o n e s i n w h i c h l a r g e e a r t h q u a k e s o c c u r and s t a n d a r d s t a t i o n s . A t a p e r i o d o f 50 s e c o n d s and a Q. o f 100 t h e s e p a t h l e n g t h s c a u s e d e c r e m e n t s o f 7 0 , 9 5 . 3 and 9 9 - 9 7 p e r c e n t ,
r e s p e c t i v e l y . F o r o ne f u l l c i r c u i t o f t h e e a r t h t h e d e c r e m e n t i n a m p l i t u d e a t 50 s e c o n d s f o r a Q o f 100 i s 9 9 - 8 4 p e r c e n t . S i n c e t h e amount o f e n e r g y a r r i v i n g p e r u n i t o f t i m e g e n e r a t e d by a l a r g e e a r t h q u a k e on t h e a v e r a g e d e c r e a s e s w i t h t i m e , so a l s o t h e n o i s e l e v e l ( i . e . o t h e r modes e x c i t e d by t h e e a r t h q u a k e ) d e c r e a s e s w i t h t i m e . For t h i s r e a s o n m e a s u r e m e n t o f
h e a v i l y a t t e n u a t e d s u r f a c e wa v e s i s s t i l l p o s s i b l e even a f t e r a t t e n u a t i o n by f a c t o r s as g r e a t as t wo h u n d r e d .
S i n c e S a t o ' s ( 1 9 5 8 ) e a r l y i n v e s t i g a t i o n o f t h e a t t e n u a t i o n o f G w a v e s , a number o f a d v a n c e s have been made i n b o t h t h e d e t e r m i n a t i o n o f g r o u p and p h a s e v e l o c i t y as w e l l as s p e c t r a l a m p l i t u d e s ( e . g . A l e x a n d e r 1 9 6 3 , P i l a n t and K n o p o f f 1 9 6 4 , Ben-Menahem 1 9 6 5 , L a n d i s m a n e t a l . 1 9 6 9 , D z i e w o n s k i and H a l e s 1 9 7 2 , F o r s y t h 1 9 7 5 a ) . T h e s e t e c h n i q u e s h a v e p r o v i d e d m e t h o d s f o r a c c u r a t e m e a s u r e m e n t s o f s u r f a c e wave v e l o c i t i e s and have been a p p l i e d t o p a t h s o v e r many p o r t i o n s o f t h e e a r t h ' s s u r f a c e . A summary o f v e l o c i t y o b s e r v a t i o n s and c r u s t - u p p e r m a n t l e s h e a r v e l o c i t i e s me a s u r e d p r i o r t o 1972 has been c o m p i l e d by K n o p o f f ( 1 9 7 2 ) . S i n c e t h a t t i m e i m p o r t a n t c o n t r i b u t i o n s ha v e been made i n t h e d e t e r m i n a t i o n o f s h e a r v e l o c i t i e s and t h e t h i c k n e s s o f t h e l i t h o s p h e r e i n t h e o c e a n s ( F o r s y t h 1 9 7 5 b , K a u s el e t a l . 1 9 7 4 , Leeds e t a 1. 1 9 7 4 , Y o s h i i 1 9 7 5 ) - A d d i t i o n a l o b s e r v a t i o n s e x t e n d i n g t o p e r i o d s o f as g r e a t as a f e w h u n d r e d s o f s e c o n d s h a v e a l s o
A r a b i a , Goncz 197^ - A u s t r a l i a , S h e r b u r n e 1975 - South A m e r i c a , Biswas and K n o p o f f 197A - N o r t h A m e r i c a ) . These o b s e r v a t i o n s complement
o b s e r v a t i o n s o f g r e a t c i r c l e phase and g r o u p v e l o c i t i e s made by Kanamori (1970a), D z i e w o n s k i (1971a) and Wu (1972) w h i c h have pr o du ce d p u r e p a t h v e l o c i t i e s a t p e r i o d s between 160 and 360 seconds f o r 3 o r A d i f f e r e n t k i n d s o f r e g i o n s t h a t can be d e s c r i b e d as e i t h e r s h i e l d , o c e a n , t e c t o n i c or_ c o n t i n e n t , deep ocean b a s i n , a r c , and r i d g e . The m a j o r d i f f e r e n c e
between t h e s e r e g i o n a l i z a t i o n s i s a m a t t e r o f i n t e r p r e t a t i o n : Kanamori (1970a) and D z i e wo n s k i (1971a) based t h e i r t e c t o n i c r e g i o n a l i z a t i o n on Umbgr ove' s
( 1 9^ 7) g l o b a l c l a s s i f i c a t i o n o f C e n o z o i c f o l d i n g b e l t s , wher eas Wu1s (1972) c l a s s i f i c a t i o n i s based on g l o b a l t e c t o n i c r e g i m e s .
The s t u d y o f t h e a v e r a ge a n e l a s t i c p r o p e r t i e s o f t h e e a r t h has n o t p r o g r e s s e d as q u i c k l y as t h e s t u d y o f t h e e l a s t i c p r o p e r t i e s . A summary o f Q 1 o b s e r v a t i o n s measured p r i o r t o 1972 has been c o m p i l e d by Smi th ( 1 9 7 2 ) . S i n c e 1972 measur ements o f a t t e n u a t i o n have been made in N o r t h A me r ic a by S o l omon (1972) and M i t c h e l l (1973b, 1975a, 1975b) f o r p e r i o d s as g r e a t as 80 s e c o nd s. S i m i l a r measur ements have a l s o been made t o 110 seconds f o r P a c i f i c Ocean p a t h s by M i t c h e l l e t a 1. (1975) and have been i n v e r t e d by M i t c h e l l ( 1 9 7 7 ) .
O t h e r measur ements o f Q ^ f o r R a y l e i g h waves have been made and i n v e r t e d by B u r t o n (197A, 1977) and app ear t o r e p r e s e n t an a v e r a g e Q. ^ f o r mi xed
o c e a n i c and c o n t i n e n t a l p a t h s , many o f w h i c h c r o s s t h e E u r a s i a n c o n t i n e n t . Q. ^ o b s e r v a t i o n s f r o m f u n d a m e n t a l and h i g h e r mode t o r s i o n a l and s p h e r o i d a l o s c i l l a t i o n modes f o r p e r i o d s between 100 and 600 seconds have a l s o been
r e p o r t e d by R o u l t ( 197A, 1975) and J o b e r t and R o u l t ( 1 9 7 6 ) . These
measur ements empl oy many o f t h e t e c h n i q u e s used in l o ng p e r i o d s u r f a c e wave a n a l y s e s d e v e l o p e d by P i l a n t and K n o p o f f (1964) and Cara ( 1973) and a r e c o m p a r a b l e t o Q. ^ d e t e r m i n e d f r o m l o ng p e r i o d s u r f a c e waves.
Jeffreys (1965, 1967) had made the point that the anelasticity of the
mantle would cause shifts in free oscillation periods which could lead to
errors in earth modelling. Anderson and Archambeau (1964) and Anderson
et a 1. (1965) presented a method for calculating observed free oscillation
and surface wave Q ^ from a and Q. ^ model. Liu e_t_ aj_- (1976) have
formulated corrections for free oscillation periods and surface wave phase
velocity measurements caused by anelasticity. Recently these corrections
have been incorporated into average earth models derived from free
oscillation periods and body wave travel times (Hart et a 1. 1977a, 1977b).
However, little high quality average earth or regional Q. ^ data exist for
surface wave or free oscillation periods which sample the upper mantle -
the region in earth models most affected by attenuative dispersion. Such
Sec. 1.2 SCOPE OF THIS THESIS
A new method o f a n a l y s i s f o r t h e d e t e r m i n a t i o n o f s u r f a c e wave g r o u p v e l o c i t i e s and s p e c t r a l a m p l i t u d e s has been d e v e l o p e d ( Ch a p t e r 2) w h i c h p r o v i d e s o b j e c t i v e e s t i m a t e s o f e r r o r in g r o u p v e l o c i t y me as ur ement s. These methods have been a p p l i e d t o 4 K u r i l e I s l a n d s e a r t h q u a k e s o f s u r f a c e wave m a g n i t u d e 6 . 6 t o 8 . 3 ( C h a p t e r s 3 and 4 ) . A n a l y s i s o f t h e l a r g e s t e v e n t y i e l d s g r o u p v e l o c i t i e s f o r p e r i o d s between 150 and 600 seconds
and a t t e n u a t i o n c o e f f i c i e n t s between 150 and 450 second p e r i o d s f o r 7 g r e a t c i r c l e p a t h s . A n a l y s i s o f t h e s m a l l e r 3 e v e n t s e x t e n d t h e r ange o f
each o f t h e s e t y p e s o f measur ements t o p e r i o d s as s h o r t as 50 seconds f o r each o f t h e 7 p a t h s and f o r 2 a d d i t i o n a l p a t h s . G l o b a l a v e r a g e g r o u p v e l o c i t i e s a r e s l o w compared w i t h a l l r e c e n t e a r t h models f o r p e r i o d s
between 70 and 200 sec on ds . Phase v e l o c i t i e s and e q u i v a l e n t f r e e o s c i l l a t i o n p e r i o d s a r e c a l c u l a t e d by i n t e g r a t i n g g l o b a l a v e r a g e g r o u p v e l o c i t i e s .
Av er a ge e a r t h model s g e n e r a t e d by c o n t r o l l e d Monte C a r l o i n v e r s i o n ( C h a p t e r 5) o f g l o b a l a v e r a g e g r o u p v e l o c i t i e s c o r r e c t e d f o r a n e l a s t i c d i s p e r s i o n show t h a t a v er a g e l i t h o s p h e r i c t h i c k n e s s e s o f 70 km and 100 km a r e b o t h p o s s i b l e Models f o r i n d i c a ' t e t h a t t h e mean C^of t h e l i t h o s p h e r e i s a b o u t 200 w h i l e a h i g h a t t e n u a t i o n z o ne a t d e p t h s o f 100 t o 200 km w i t h a between 85 and 110 p r o d u c e s s a t i s f a c t o r y model s f o r o b s e r v e d a t t e n u a t i o n f o r p e r i o d s between 50 and 300 s e co n d s . f o r t h e m a n t l e b e n ea th 400 km exceeds 180.
R e g i o n a l model s f o r s h e a r v e l o c i t y have been d e r i v e d by
c o n t r o l l e d Monte C a r l o i n v e r s i o n o f p u r e p a t h g r o u p v e l o c i t i e s c o r r e c t e d f o r a n e l a s t i c d i s p e r s i o n ( C h a p t e r 7 ) - Pure p a t h o c e a n i c g r o u p v e l o c i t i e s r e q u i r e a low v e l o c i t y zone b e g i n n i n g a t d e p t h s o f 70 o r 100 km. Pur e p a t h c o n t i n e n t a l g r o u p v e l o c i t i e s do n o t r e q u i r e t h e p r e s e n c e o f a l ow v e l o c i t y z o n e . A r e g i o n a l s t u d y o f g r o u p v e l o c i t y d i s p e r s i o n and t h r u s t f a u l t i n g
3
180 km in order to fit both ScS travel times and observed fundamental
and higher mode group velocities for both Love and Rayleigh waves. Surface
wave group velocities, alone, do not require the presence of a pronounced
low velocity zone with a high velocity lid but preclude its presence at
depths shallower than ] k 0 km. Pure path attenuation models have been
produced for both continental and oceanic upper mantle structures (Chapter
7
) •CHAPTER 2
DETERMINATION OF GROUP VELOCITY AND SPECTRAL AMPLITUDE BY NARROW-BAND FILTERING
Sec. 2 .1 INTRODUCTION
Group v e l o c i t y d i s p e r s i o n o f s u r f a c e waves i s a measure o f t h e a v e r a g e e l a s t i c p r o p e r t i e s o f t h e e a r t h . The r a t e o f decay o f a m p l i t u d e s o f s u r f a c e waves i s a measure o f t h e a v e r a g e a n e l a s t i c p r o p e r t i e s o f t h e e a r t h and i s commonly e x p r e s s e d as t h e a t t e n u a t i o n c o e f f i c i e n t y o r t h e s p e c i f i c a t t e n u a t i o n Q.
\
For two s t a t i o n s on t h e same g r e a t c i r c l e as t h e s o u r c e(2.1)
wher e A i s t h e s t a t i o n s e p a r a t i o n in k i l o m e t e r s , U t h e i n t e r s t a t i o n g r o u p v e l o c i t y , A^ t h e s p e c t r a l a m p l i t u d e measured a t t h e s t a t i o n c l o s e s t t o
for periods between 50 and 600 seconds. These measurements will, in turn,
be used to derive the regional and global average shear velocity and
variation of Q. , the specific attenuation for Rayleigh waves, as a function
Sec. 2 * 2 GAUSSIAN FILTERS AND THE DETERMINATION OF GROUP ARRIVAL TIMES AND SPECTRAL AMPLITUDES
S e v e r a l r e f i n e m e n t s t o t h e t e c h n i q u e i n t r o d u c e d by A l e x a n d e r (1963) have r e c e n t l y been made by P i l a n t and K n o p o f f (1964) - Time V a r i a b l e
F i l t r a t i o n , D z i e wo n s k i e t a l . ( 1 9 6 9 ) “ M u l t i p l e F i l t e r T e c h n i q u e a n d ,
L e v s h i n e t a 1♦ (1972) - Fr e q ue n c y Time A n a l y s i s . The more r e c e n t o f t h e s e t e c h n i q u e s use Gaussi an f i l t e r s o f t h e f o r m
F(co,co )
o exp (2.2)
i n t h e f r e q u e n c y d o m a i n , and
J r T co / co t 2\
f (t,co ) = --- -- cos (co t ) exp ( - (— --- ) ) ( 2 . 3 )
i n t h e t i m e domain ( D z i e w o n s k i e t a 1. 196 9) . Gaussi an f i l t e r s a l l o w o p t i m a l f r e q u e n c y and t i m e r e s o l u t i o n t o be a c h i e v e d ( P a p o u l i s 1962) i n t h e sense t h a t
D D = v4t/ 2
t co ( 2 . 4 )
where D t and D a r e t h e t i m e and f r e q u e n c y d u r a t i o n o f t h e f i l t e r :
CO M 7
Dt 2 =
J
t 2 1 f ( t ,coQ)|2 d tand
D co
OO
( 2 . 5 )
2
— CO
13
For other types of non-band-1 i mi ted filters, is always greater than
vfi72. Other filters thus provide poorer frequency-time resolution than the
Gaussain filter. In practice such filters are always truncated and, hence,
band-1imited. As Dziewonski et al. (1969) pointed out
"The highest possible energy concentration of the impulse response
corresponding to a band-limited filter is achieved when the filter
is a truncated prolate spheroidal wave function of zero order (see
also Papoulis, 1962, sec
k~5) •
If, however, the Gaussian functionis truncated at a value of the order of 30 db down from the maximum,
the energy concentration of its impulse response is only 0.1 per
cent lower than that of the corresponding prolate spheroidal wave
function."
More recently, several authors have discussed the optimization of
filter resolution in terms of the determination of the value of the filter
parameter (a in the case of the Gaussian filter described in Equation 2.2
and 2.3) which produces the sharpest filter which "rings" least (Inston
et al. 1971, Cara 1973, Denny and Chin 1976, Canitez 1977). The effect of
choosing a filter parameter which is not optimal results in the loss of
resolution in the time domain. The choice of such an optimal value of the
filter parameter is dependent upon the dispersive character of the signal
being analyzed. Errors in estimation of group velocity are systematic
when group velocity changes rapidly with frequency (Dziewonski et a 1. 1972).
An alternative method for minimizing error in group velocity
estimation is the Residual Dispersion Measurement of Dziewonski et al. (1972).
This technique requires cross-correlation of a synthetic seismogram, which
approximates the dispersion of the signal to be analyzed within a few
percent, with the original seismogram. The analysis of the resulting cross-
correlogram gives the differences in dispersion between the two signals.
estimation of the group velocity difference (residual dispersion) are
consequently much smaller. If the residual dispersion is large, then a
new synthetic should be produced and the process repeated.
Dziewonski et al. (1972) noted that the maximum amplitude of
a Gaussian filtered seismogram does not, in general, coincide with the group
arrival time. The errors in determination of the group arrival time
caused by Gaussian filtering depend on second and higher order derivatives
(with respect to frequency) of the amplitude spectrum and wave number of the
seismic signal. Second and third order derivatives of the wave number are
related to the slope and curvature of the group velocity dispersion curve.
However, errors of this kind can be suppressed by increasing the frequency
resolution and sacrificing time resolution. This, of course, also
sacrifices precision in the group velocity measurement. With this approach,
a narrower band estimate of the spectral amplitude is obtained which is
more suitable for spectral amplitude estimation.
It was clear from the analysis carried out at the time that the
"residual dispersion" paper (Dziewonski et a 1. 1972) was written, that
errors in the determination of group velocity by any of the multiple filter
methods (e.g. Dziewonski et al. 19&9, Levshin et al. 1972) tended to be
large when the amplitude of the seismic signal varied rapidly with frequency
so that the change in amplitude between successive center frequencies was
large. In such cases the frequencies at which amplitudes are large leak
through into adjacent low amplitude frequencies (see Figure 2.1) unless
the filter parameter a is sufficiently large. The use of sufficiently
large a's avoids errors in both group velocity and spectral amplitude
estimation at the expense of time (group velocity) resolution.
The approach adopted in this thesis is to use filters with large
F i g u r e 2.1 PURITY OF FILTERED RAYLEIGH PHASES
-R, r e c o r d e d a t HNR has been f i l t e r e d w i t h a Gaussi an f i l t e r
A
o f t h e f o r m shown i n E q u a t i o n 2 . 3 w i t h A d i f f e r e n t v a l u e s o f t h e f i l t e r p a r a m e t e r a . Each f i l t e r e d t r a c e i s shown s t a r t i n g a t 1027 GMT on 13 O c t o b e r 19&3 w i t h r e l a t i v e a m p l i t u d e s o f e a c h pe a k i n each t r a c e shown i n l a r g e n u m b e r s and e f f e c t i v e p e r i o d s ( i n s e c o n d s ) me a s u r e d
f r o m a d j a c e n t z e r o c r o s s i n g s shown i n s m a l l n u mb e r s b e n e a t h e a c h z e r o c r o s s i n g . N o t e t h a t p e a k a m p l i t u d e s o f R^
f i l t e r e d w i t h a = 20 and AO o c c u r a t p e r i o d s c o n s i d e r a b l y d i f f e r e n t f r o m t h e c e n t e r p e r i o d o f t h e f i l t e r (3A0 s e c o n d s ) . A m p l i t u d e s o f p e a k s a d j a c e n t t o t h e maximum d e c a y more
[image:32.545.30.519.149.797.2]P
ha
s
e
F
il
te
re
d
a
t
3
4
0
16
maximum o f t h e e n v e l o p e o f t h e f i l t e r e d s i g n a l and t h e c e n t e r f r e q u e n c y o f t h e f i l t e r i s much l e s s t ha n t h e s e p a r a t i o n between c e n t e r f r e q u e n c i e s . S i n c e a l m o s t a l l p a t h s used i n t h i s s t u d y ( w i t h t h e e x c e p t i o n o f t h e P i c t o n e a r t h q u a k e d i s c u s s e d i n C h a p t e r 6) were o f l e n g t h s g r e a t e r t h a n
10, 000 km, t h e l o s s o f t i m e r e s o l u t i o n was n o t s e r i o u s and was more t h a n o f f s e t by t h e g a i n i n p u r i t y o f t h e s p e c t r a l a m p l i t u d e s .
I t i s p r o b a b l e t h a t a " r e s i d u a l d i s p e r s i o n / r e s i d u a l a m p l i t u d e
a n a l y s i s " u s i n g a s y n t h e t i c sei smogr am w i t h an a m p l i t u d e f u n c t i o n o f s p e c t r a l c o n t e n t w h i c h i s t he i n v e r s e o f t h e a m p l i t u d e s p e c t r u m o f t h e s e i s m i c s i g n a l t o be a n a l y s e d w o u ld p r o du c e a c r o s s - c o r r e l o g r a m w i t h m i n i m a l v a r i a t i o n w i t h f r e q u e n c y . T h i s w o u l d , in e f f e c t , be an i n v e r s e f i l t e r t e c h n i q u e and
s h o u l d e l i m i n a t e e r r o r i n measured d i s p e r s i o n due t o v a r i a t i o n o f t h e s i g n a l ' s a m p l i t u d e w i t h f r e q u e n c y as w e l l as d i s p e r s i o n . In a d d i t i o n , t h i s t e c h n i q u e s h o u l d , w i t h t h e i n c l u s i o n o f s o u r c e phase s h i f t i n t h e s y n t h e t i c , a l l o w t h e d i r e c t , a c c u r a t e and s i m u l t a n e o u s d e t e r m i n a t i o n s o f phase v e l o c i t y , g r o u p v e l o c i t y and s p e c t r a l a m p l i t u d e . Such c r o s s - c o r r e l o g r a m s can a l s o be s t a c k e d w i t h o u t w e i g h t i n g s i n c e each c r o s s -
SEISMIC DATA
Sec. 2.3.1 Computers
The routine processing and analysis programs used in this thesis
were developed for use on a small computer. Most were used on one of two
computers: a Datacraft 6024/4 with 32k (lk = 1024 words) of 750 nanosecond
24 bit core memory and a Scientific Arithmetic Unit (floating point
arithmetic hardware unit), or a Uni vac 1108 with 256k of 750 nanosecond 36
bit words (eventually upgraded to a Uni vac 1100/42 dual arithmetic processor
system). In general it was found that both the 6024/4 and 1108 computers
ran programs at comparable speeds, and that only programs for calculating
phase or group velocity partial derivatives were required to be run in
double precision on the 1108-1100/42 system. Approximately equal amounts
of time were used on both computers due to heavy usage of the 6024/4 and
availability of the 1108-1100/42 systems.
Sec. 2.3-2 Data, Digitization, Decimation and Detrending
All seismograms processed in this study were recorded by the
World Wide Standard Seismograph Network (WWSSN) or the High-Gain, Long-
Period Network (HGLP). Other data used in the focal mechanism determination
for the Picton earthquake of 9 March 1973 are listed in Chapter 6.
WWSSN long-period seismograms used for surface wave group
velocity determination were digitized using a DMAC digitizer at the
Commonwealth Scientific and Industrial Research Organization, Division of
Computing Research, Canberra, and later at the Division of Land Use
Research, Canberra. These seismograms were sampled at a variable rate
depending upon the complexity of the seismic trace, and interpolated to
18
of the 13 October 1963 Kurile Islands earthquake (M^ = 8.3) were low
pass filtered and decimated to 1 sample per b seconds. All records were
processed to remove linear trend and the mean.
Sec. 2.3.3 Fi1 tering
Since almost all of the programs used in this study were designed
to be run on a small computer the most direct (although sometimes somewhat
pedestrian) methods were employed which would require only a modest amount
of memory. For this reason filtering was performed in the time domain
using the filter described by Equation 2.3 truncated at 30 db amplitude
level of the envelope. Values of the filter parameter, a, were determined
in accordance with the philosophy described in Section 2.2 (see Figure 2.1).
Values of 40, 80, and 160 were found to produce adequately pure spectral
amplitudes for the period ranges 5 to 80, 60 to 200 and 100 to 600
seconds respectively. Center-frequencies, 03q , were chosen at 5 second
intervals in period for periods shorter than 100 seconds, at 10 second
intervals for periods between 100 and 200 seconds, and at 20 second
intervals for periods greater than 200 seconds. This ensured that any
particular frequency is passed by two or three filtrations since filters
have half amplitude filter widths of approximately two to four times the
interval between adjacent center periods for filtration. Redundancy in
the group velocities and spectral amplitude estimates was thus achieved.
Early versions of the filtering program were designed as a
single program, however, in later versions the functions of the Direct
Filtering Method program were combined with the filtering program so that
only selected group velocity windows in the time series were filtered. All
Rayleigh phases from one seismogram were filtered at one time with
Sec. 2 . 3 . ^ The D i r e c t F i l t e r i n g Me t h o d
F o r t h e d e t e r m i n a t i o n o f g r o u p v e l o c i t i e s , t h e D i r e c t F i l t e r i n g Met hod ( F i g u r e 2 . 2 ) l o c a t e s maxi ma i n t h e e n v e l o p e o f a f i l t e r e d
s e i s m o g r a m by l o c a t i n g s u c c e s s i v e maxi ma and m i n i m a w i t h i n a s p e c i f i e d g r o u p v e l o c i t y w i n d o w . E s t i m a t e s o f g r o u p a r r i v a l t i m e a r e made by
l e a s t - s q u a r e s f i t t i n g a p a r a b o l a t o a s p e c i f i e d number o f maxima and m i n i m a a b o u t e a c h r e c t i f i e d e n v e l o p e maximum. U s u a l l y b e t w e e n 5 and 11 p o i n t s a r e used i n t h e l e a s t s q u a r e s f i t . S t a n d a r d e r r o r s o f g r o u p a r r i v a l t i m e s a r e c a l c u l a t e d f r o m ( l ) r e g r e s s i o n s t a t i s t i c s f o r e a c h p a r a b o l a and ( 2) t h e h a l f - a m p l i t u d e w i d t h o f e a c h e n v e l o p e maximum ( a l s o c a l c u l a t e d f r o m t h e e q u a t i o n o f t h e p a r a b o l a w i t h i n ea c h g r o u p v e l o c i t y w i n d o w . Gr ou p t r a v e l t i m e s a r e c a l c u l a t e d as t h e d i f f e r e n c e b e t w e e n t h e U n i t e d S t a t e s C o a s t and G e o d e t i c S e r v i c e (USCGS) o r i g i n t i m e and t h e g r o u p a r r i v a l t i m e c o r r e c t e d f o r i n s t r u m e n t a l g r o u p d e l a y by H a g i w a r a ' s
1958) f o r m u l a e . F o r t h i s c o r r e c t i o n t h e o r e t i c a l v a l u e s f o r c o n s t a n t s f o r t h e WWSSN l o n g p e r i o d s e i s m o g r a p h s y s t e m w e r e a s s u m e d .
R e s u l t s o f a n a l y s e s f o r e a c h e n v e l o p e maximum a r e d i s p l a y e d i n l i n e p r i n t e r o u t p u t a s shown i n F i g u r e 2 . 3 . P a r t 1 o f t h e o u t p u t d i s p l a y s t h e r e s i d u a l s o f t h e p a r a b o l a f i t , g r o u p a r r i v a l t i m e e s t i m a t e , s t a n d a r d e r r o r e s t i m a t e s , c o e f f i c i e n t s o f t h e p a r a b o l a and t h e i r s t a n d a r d e r r o r s ,
t h e r e s u l t i n g g r o u p v e l o c i t y e s t i m a t e . c o r r e c t e d f o r i n s t r u m e n t a l g r o u p d e l a y s , and t h e t w o s t a n d a r d e r r o r e s t i m a t e s ( f r o m r e g r e s s i o n s t a t i s t i c s and e n v e l o p e maximum h a l f - w i d t h ) . P a r t 2 i s a g r a p h i c a l d i s p l a y o f
DIRECT FILTERING METHOD
O
J
F i g u r e 2 . 3 DIRECT FILTERING METHOD DISPLAY OF ENVELOPE MAXIMUM -(1) L e a s t s q u a r es p a r a b o l a r e s i d u a l s and f i t t o t h e e n v e l o p e maximum a r e shown w i t h t h e p o s i t i o n o f t h e maximum (XMAX) and two e s t i m a t e s o f t h e s t a n d a r d
e r r o r o f t h e maximum, c o e f f i c i e n t s o f t h e p a r a b o l a and t h e i r s t a n d a r d e r r o r s ( C ) , maximum o f t h e e n v e l o p e e s t i m a t e d f r o m t h e p a r a b o l a (YHAX) and f r o m t h e l a r g e s t peak (ACTUAL MAX). E s t i m a t e s o f g r o u p v e l o c i t y and i t s s t a n d a r d e r r o r s c a l c u l a t e d f r o m t h e two e s t i m a t e s o f s t a n d a r d e r r o r o f t h e p o s i t i o n o f t h e maximum,
(2) The e n v e l o p e maximum i s p l o t t e d w i t h " + " and i n d i c a t i n g t h e p o s i t i o n ( sampl e number) and h e i g h t o f each r e c t i f i e d maximum o r minimum.