by
Jayshree C. Theophilus
A thesis submitted for the Degree of Doctor of Philosophy
at the
Australian National University
John Curtin School of Medical Research
This thesis describes the results of research carried out in the Department of Human Biology, John Curtin School of Medical Research at the Australian National University since September 1977, under the supervision of Dr. R.L.Kirk.
The assistance received with unpublished HLA typing results is acknowledged in relevant sections of the thesis. The experimental work and analysis was otherwise performed by the author.
I am extremely grateful to the Australian National
University for the award of the ANU Ph.D. Scholarship, and to the Department of Human Biology, J.C.S.M.R. for enabling the study to be carried out.
I would like to thank my supervisor Dr R.L. Kirk for suggesting the topic and subsequently for careful and constructive guidance in the writing of this thesis.
For the HLA typing of the families of IDDM patients and the LCA data on the patients of Melbourne, I am indebted to Dr S. Serjeantson.
This work would have been impossible without the supply of patient samples provided by the various sources indicated below. To them I extend my deep gratitude.
Dr P. Zimmet for the samples of NIDDM patients from the Royal Southern Memorial Hospital, Melbourne.
Dr J. Court, for samples of IDDM patients from the Royal Children's Hospital, Melbourne.
Mr P. Kiely and Mrs S. Whitehouse for the HLA typing and the statistical analyses respectively.
Dr T. Welborn from the Sir Charles Gairdner Hospital,
Perth, for supplying the samples from Kalgoorlie, Geraldton and Perth.
Professor M.M.S. Ahuja of AIIMR New Delhi for the samples from North India.
Dr P. Bennett for the samples of Pima Indians living in Arizona.
blood donors of Canberra and Sydney blood banks.
Lastly, I would like to thank Dr Max Blake, Chris, Janis, M a r j , Anne and Pam for assistance provided during experimen tation in the laboratory.
The present investigation provides information on the genetics of susceptibility to diabetes. Patients and controls from five ethnic groups have been studied.
i
Australian Population: Patient series were available from hospital sources in Melbourne and from surveys in three localities in Western Australia (W.A.). Controls were blood bank donors in Canberra and Sydney.
For genetic markers on chromosome 6, the results
demonstrate a strong association for the Properdin factor B
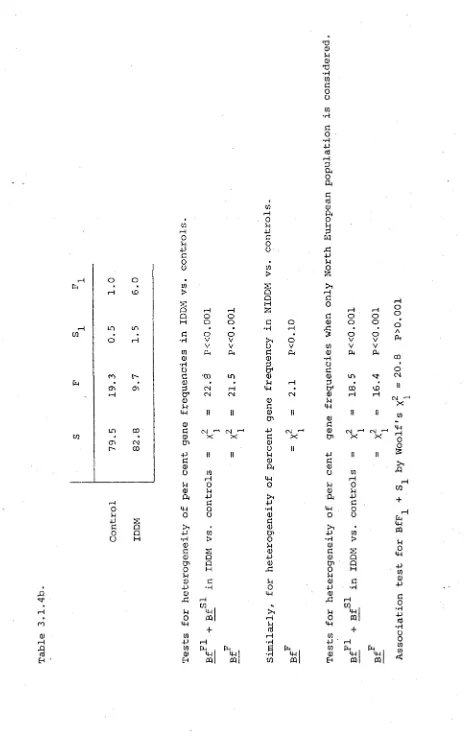
(Bf) factors BfF^ and BfS^ in the insulin dependent diabetes mellitus (IDDM) patients of Melbourne. Bf F is present in 1.0% of controls compared with 6.0% in the IDDM series. This is an
age-dependent association which declines at the older ages. The relative risk for BfS^ and BfF^ combined for patients below 10 years of age is 9.4. Another important feature is a significant decrease of BfF factor in the Western Australian non-insulin dependent diabetes mellitus (NIDDM) patients. This points to the importance of the Bf system, not only in IDDM, but also in NIDDM patients.
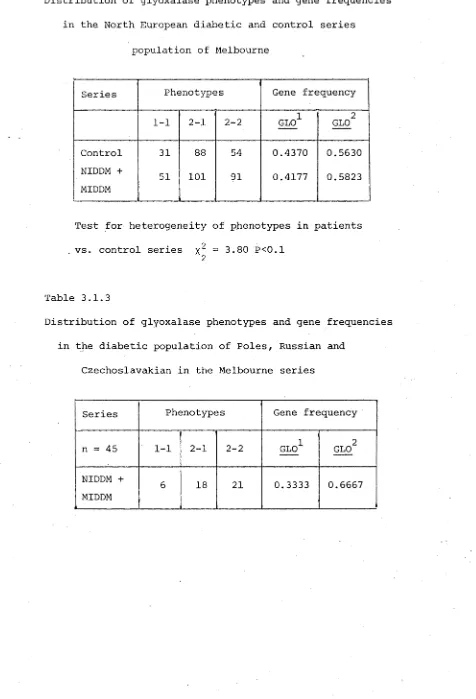
The complement C /2 system also shows a significant association with IDDM in the Melbourne series. A third chromosome 6 marker, the red cell enzyme Glyoxalase (GLO) shows an apparent association by an increase of the GLO 2-2 phenotypes among the NIDDM patients in Melbourne, but this is due to the ethnic stratification of the population.
A multivariate analysis of the genetic markers for the Australian series indicates genetic differences between the various patient series, as well as between these and the control series.
Indian Population: Among the Indian IDDM patients, the distri bution of the chromosome 6 marker Properdin B (Bf) differs
from that in Caucasian IDDM. Unlike the latter there is an absence of BfF^ in the Indian IDDM patients, but an associa tion with the other rare factor BfS^ (3.2% controls vs 11.4% IDDM) is noted. In the NIDDM series, there is an increase of the BfF factor. Typing of C^2 was not carried out for
this series. For red cell enzyme glyoxalase (GLO), an increase in the GLO 2-2 phenotype was noted and like the Australian series this is due to the ethnic stratification within the Indian population.
2 For the non-chromosome 6 markers there is an increase of PGM
---1
allele unlike that observed in NIDDM series of Australia.
Samoan Population: In the NIDDM series from Samoa, for the chromosome 6 markers there is a decrease of the common allele
F
Bf , which is similar to that for the Australian NIDDM series. The C^2 typing was not carried out for the Samoan series. At the GLO locus no significant disturbance in phenotypes or gene frequencies are observed. Among the
2
Nauru Population: For the chromosome 6 marker Properdin F
factor B (Bf), there is an increase of B£ among the NIDDM patients similar to the phenomenon noted in the Indian NIDDM series. The other markers on chromosome 6, C'2 and GLO, were not studied in this population.
Among the non-chromosome 6 markers, there is an 2
increase of the PGM^ allele, a reverse trend to that in the Australian NIDDM series. This may be due to the difference in the age structure of the population. A significant association with a non-chromosome 6 marker,
c
6GPD , was noted in the Nauru NIDDM series.
Pima Indian population: There is no significant distur bance in the distribution of the chromosome 6 markers Bf and GLO phenotypes or gene frequencies in the NIDDM series
2 of Pima Indians. For the C'2 system, an increase of C'2 allele is noted in the NIDDM series.
Among the non-chromosome 6 markers, there is a signifi-2
cant increase of PGM“ allele (8.4%) in the NIDDM series compared to controls. This is unlike the Australian NIDDM series, and may be due to the lower age of individuals in this population. The association of phosphoglycolate phosphatase (PGP) with NIDDM among Pima Indians, which has been claimed by other workers, is not supported by this study.
In conclusion, the study shows the importance of two markers (other than HLA) on chromosome 6 which are inform ative for indicating the risks of persons carrying the
In the NIDDM type of disease, association of the PGM markers requires further study for confirmation.
Table of Contents
Chapter 1 INTRODUCTION Page
Definition of Diabetes Mellitus. 1
Classification schemes. 2
Prevalence of diabetes mellitus in the world
populations. 5
Environmental factors influencing prevalence of
diabetes mellitus. 7
Genetic factors influencing prevalence of diabetes
mellitus. 14
Previous studies of genetics in diabetes mellitus. 16 Present status of genetic markers in diabetes
mellitus:
Part A: HLA associations with diabetes mellitus. 27 HLA associations with NIDDM and late onset
insulin-dependent diabetes. 32
Ethnic variation in HLA associations with
IDDM populations. 33
Genetic interpretation of HLA studies in
IDDM and NIDDM. 34
Part B: Associations of diabetes mellitus with ABO
and other blood groups. 38
Chlorpropamide alcohol flushing and
diabetes mellitus. 41
Scope of the present investigation. 42
Chapter 2 POPULATIONS STUDIED AND METHODS
Sources of samples. 44
Laboratory methods: handling and transport of samples. 46 Laboratory techniques. 47
Serum proteins. 48
Red cell enzyme systems. 53
Chapter 3 AUSTRALIAN POPULATION Page
Section 1 Melbourne
Chromosome 6 markers:
Glyoxalase I (GLO) 61
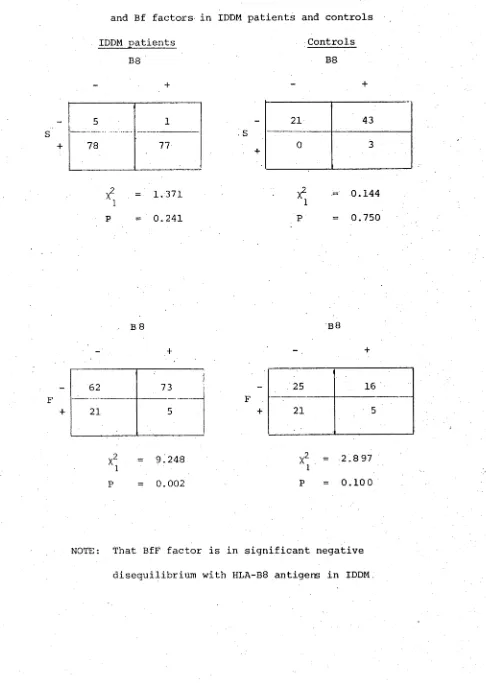
Complement factor Properdin factor B (Bf). 65 Age relationship between IDDM and rare alleles of
Properdin factor B. 69
Analysis of HLA and Bf factors. 70
Family investigations. 75
Complement component C^2. 79
Non-chromosome 6 markers: 82
Serum proteins. 85
Group Specific Component (Gc). 85
Haptoglobin (Hp). 88
Transferrin (Tf). 88
Ceruloplasmin (Cp). 90
Non-chromosome 6 markers;
Red cell enzymes. 90
Esterase-D (EsT-D). 90
Acid phosphatase (PHs). 93
Phosphoglucomutase (PGM) I and II. 93 Glutamic pyruvic transaminase (GPT). 100
Other enzymes. 100
Distance analysis. 100
Chapter 3 AUSTRALIAN POPULATION Page
Section 2 Western Australia
Chromosome 6 markers
Glyoxalase I (GLO). 108
Complement factor, Properdin factor B (Bf) 110
Complement component C^2. 112
Non-chromosome 6 markers - Serum proteins.
Group specific component (Gc). 115
Haptoglobin (Hp) 115
Transferrin (Tf). 117
Non-chromosome 6 markers: Red cell enzymes
Esterase-D (EsT-D). 117
Acid phosphatase (PHs). 121
Phosphoglucomutase (PGM) I and II. 124 Glutamic pyruvic transaminase (GPT). 124
Other systems. 127
Multivariate analysis. 127
Summary. 127
Chapter 4 INDIAN POPULATION 132
Chromosome 6 markers
Glyoxalase I (GLO). 133
Complement factor, Properdin factor B (Bf). 133
Complement component C^2. 137
Non-chromosome 6 markers - Serum proteins
Haptoglobin (Hp). 137
Transferrin (Tf). 139
Non-chromosome 6 markers: Red cell enzymes
Esterase-D. (Est-D) 139
Acid phosphatase (PHs). 139
Phosphoglucomutase (PGM) I and II. 142
Other systems. 144
Summary. 144
Chapter 5 PACIFIC ISLAND POPULATION
Section 1 Western Samoa
Chromosome 6 markers
Glyoxalase I (GLO). 147
Complement factor, Properdin B (Bf). 149
Complement component Cv2. 149
Non-chromosome 6 markers - Serum proteins
Group specific component (Gc). 152
Haptoglobin (Hp). 152
Transferrin (Tf). 152
Non-chromosome 6 markers: Red cell enzymes
Esterase-D (EsT-D). 152
Acid phosphatase (PHs). 154
Phosphoglucomutase (PGM) I and II 154
Other systems 454
Chapter 5 Pa9e
Section 2 NAURU 158
Chromosome 6 markers: 159
Complement factor, Properdin factor B (Bf) . 159
Non-chromosome 6 markers - Serum proteins.
Group specific component (Gc). 159
Haptoglobin (Hp) 159
Transferrin (Tf). 162
Non-chromosome 6 markers: Red cell enzymes.
Esterase-D (EsT-D) 162
Acid phosphatase (PHs) 162
Phosphoglucomutase (PGM) I and II. 164 6-Phosphogluconate dehydrogenase (6PGD). 164
Summary. 166
Chapter 6 PIMA INDIAN POPULATION 167
Chromosome 6 markers.
Glyoxalase I (GLO). 168
Complement factor, Properdin B (Bf). 168
Complement component C'2. 168
Non-chromosome 6 markers - Serum proteins
Group specific component (Gc). 170
Haptoglobin (Hp). 170
Page Non-chromosome 6 markers: Red cell enzymes
Esterase-D. (Est-D) 173
Acid phosphatase (PHs). 173
Phosphoglucomutase (PGM) I and II. 175
Glutamic pyruvic transaminase (GPT). 175
Phosphoglycolate phosphatase (PGP). 177
Other systems. 179
Summary. 179
Chapter 7 DISCUSSION 180
Chromosome 6 markers. 181
Non-chromosome 6 markers. 189
Multivariate / Distance analysis 197
BIBLIOGRAPHY 199
Number of tables and figures in each chapter
Chapter Nos. Total No. Tables
Total No. Figures
1 9
-2 -
-3.1 30 6
3.2 14 2
4 10
-5.1
1 9
-| 5.2 7
-6 12
Chapter 1
INTRODUCTION
The prevalence of diabetes ranks it as one of the leading health problems in the world. The notion that it is a disease only of affluent societies is erroneous, since many developing countries also show high prevalence rates of the disease. In fact, it is regarded as a universal problem affecting human societies at all stages of development (WHO, 1980).
Definition of Diabetes Mellitus
The effects of diabetes are recognised by the state of chronic hyperglycaemia, a consequence either of insulin lack or due to a number of factors which inhibit its action.
Since insulin is one of the major regulators of blood glucose concentration, an imbalance leads to abnormalities of carbo hydrate, protein and lipid metabolism. As the disease
progresses other effects may include characteristic symptoms, such as ketoacidosis, gradual degeneration resulting in disease of capillaries of the kidney and
retina, damage to the peripheral nerves and excessive arter iosclerosis (WHO, 1980). For long it was regarded as a single disorder of metabolism, For example, one of the standard medical textbooks defined diabetes as "... a disorder of carbohydrate metabolism characterized by hyper glycemia and glycosuria associated with a disturbance
of the normal insulin mechanism .... " (Bondy 1963). A more recent definition by Fajans et at. (1978), however, indicates a
is a genetically determined disorder of metabolism associated with absolute or relative insulin insufficiency which, in its
fully developed clinical expression, is characterised by fasting hyperglycaania, atherosclerotic and microangiopathic vascular disease and neuropathy". Apart from these essential characteristics Fajans et at, (1978) point out that variation in the clinical presentation may occur, such that the disease may be a mild form and without complications.
The basis for separation of diabetes into various types has been greatly stimulated by the discovery of associations between markers such as HLA and islet cell antibodies in some diabetic subjects and not in others. This has led to fresh attempts to classify diabetes on the basis of clinical and laboratory features.
Classification Schemes:
The first attempt at classification was made by a work shop on "Etiology and pathogenesis of insulin-dependent diabetes mellitus" (Philadelphia Workshop 1977) co-sponsored by the National Institute of Arthritis, Metabolism and
Digestive Diseases and the Juvenile Diabetes Foundation. The main emphasis of this workshop centered specifically on the juvenile type of diabetes with some reference to non insulin or maturity onset type of diabetes.
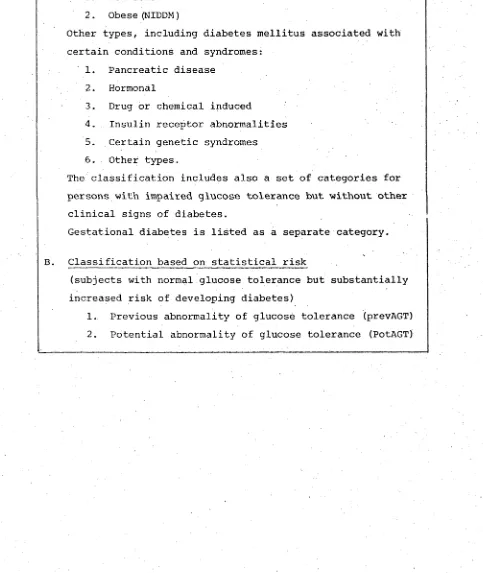
assistance to the National Diabetes Data Group (NDDG) of the National Institutes of Health which also published a report on classification and diagnosis of diabetes mellitus (NDDG/ 1979). This classification is the basis for that adopted in 1980 by the World Health Organization (WHO, 1980). Since this scheme is based on contemporary knowledge incorporating the heterogeneity of the syndrome, it will form the basis of this thesis. An outline of this classification, given in table 1.1, will be briefly described below.
Type I : Insulin dependent diabetes mellitus (IDDM), usually characterized clinically by abrupt onset of symptoms, insulin-opaenia and dependence on injected insulin to sustain life, and proneness to ketosis. Classically, this type of disease occurs in juveniles and was formerly termed juvenile diabetes. Since it can be recognized and becomes symptomatic at any age, diagnosis on an age basis is abolished. IDDM appears to be heterogeneous in terms of genetic and environmental factors which precipitate the disease (Rotter and Rimoin, 1978).
Genetic determinants are important in most patients, confirmed by the associated increased or decreased frequency of certain histocompatibility antigens (HLA) controlled by genes on chromosome 6 (Nerup et ais 1974; Cudworth and Wood-row, 1974).
corr-Table 1.1
National Diabetes Data Group: Classification of Diabetes Mellitus
A. Clinical Classes: DIABETES MELLITUS
Insulin dependent type (IDDM) Type I
Non-insulin dependent type (NIDDM) Type II 1. Non-obese
2. Obese (NIDDM)
Other types, including diabetes mellitus associated with certain conditions and syndromes:
1. Pancreatic disease 2. Hormonal
3. Drug or chemical induced
4. Insulin receptor abnormalities 5. Certain genetic syndromes 6. Other types.
The classification includes also a set of categories for persons with impaired glucose tolerance but without other
clinical signs of diabetes.
Gestational diabetes is listed as a separate category.
B. Classification based on statistical risk
(subjects with normal glucose tolerance but substantially increased risk of developing diabetes)
[image:19.522.22.505.236.809.2]ection of symptomatic or persistent fasting hyperglycaemia if this is not achieved by use of diet or oral agents. Ketosis may develop under stress or trauma. A range of insulin responses to glucose, from low to supranormal, has been found in patients of this class, many of whom do not have fasting hyperglycaemia.
Complications of diabetes, namely macro- and microangio pathy, neuropathy, retinal damage and cataracts, are often associated with Type II or NIDDM. NIDDM is also of a hetero geneous nature and use of age of onset is not recommended
(NDDG, 1979). NIDDM has a strong genetic basis, which is evidenced by a more frequent familial pattern of occurrence
(NDDG, 1979). Included under this type are families in whom diabetes occurs in children, adolescents and adults with an autosomal dominant inheritance known as MODY and described by Tattersall and Fajans (1975).
Intake of excessive calories leading to weight gain and obesity is probably an important factor in the pathogenesis of NIDDM. Although small changes in weight may be important, NIDDM has been subdivided according to the presence or
absence of obesity. 60%-90% of all NIDDM patients are obese, especially noted in the Western societies (NDDG, 1979).
Unlike IDDM, the NIDDM type of diabetes is not associated with HLA types and islet cell antibodies among Caucasians. However, recent reports from South Africa for the Xhosa tribe
Other types of diabetes: In this subclass, diabetes forms part of certain other conditions and syndromes which often have many clinical features not generally associated with the dia betic state. Only in some cases the co-occurrence of glucose tolerance and other features may be of some importance aetio-logically. In others, it can imply a causal relationship. This class has been further subdivided depending upon the known or suspected aetiologic relationship. (1) It may be second ary to pancreatic diseases or removal of pancreatic tissue,
(2) it may be due to endocrine disease such as acromegaly, Cushing's syndrome, pheochromocytoma, glucagonoma, somatas-tatinoma and primary aldosteronism, or (3) it may result from the administration of certain hormones, drugs and chemicals which cause hyperglycaemia.
Diabetes may also be associated with defects of the insulin receptors which may be caused either by abnormal ities in numbers or to affinity of insulin receptors or antibodies to receptors with or without associated immune disorders (Roth et al3 1979). As well carbohydrate intol erance is often seen in association with a number of genetic syndromes (Rimoin and Schimke, 1971; Rimoin, 1976). Finally, this class incorporates special types of diabetes found
among specific populations and environmental conditions, e.g. diabetes associated with malnourished people (NDDG, 1979).
Prevalence of diabetes mellitus in the world populations
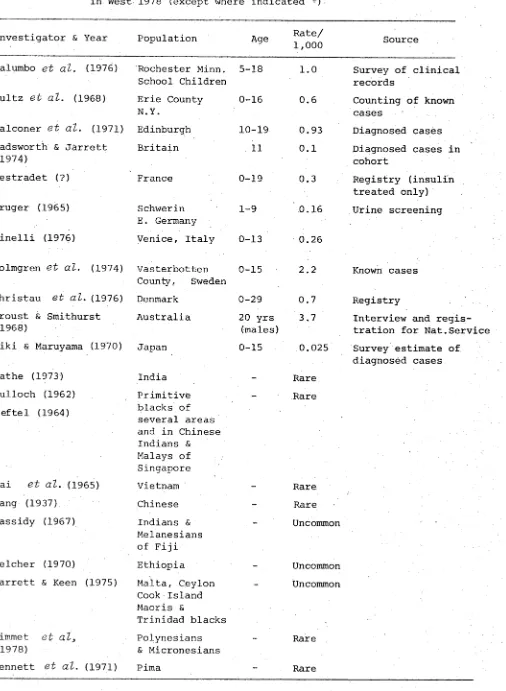
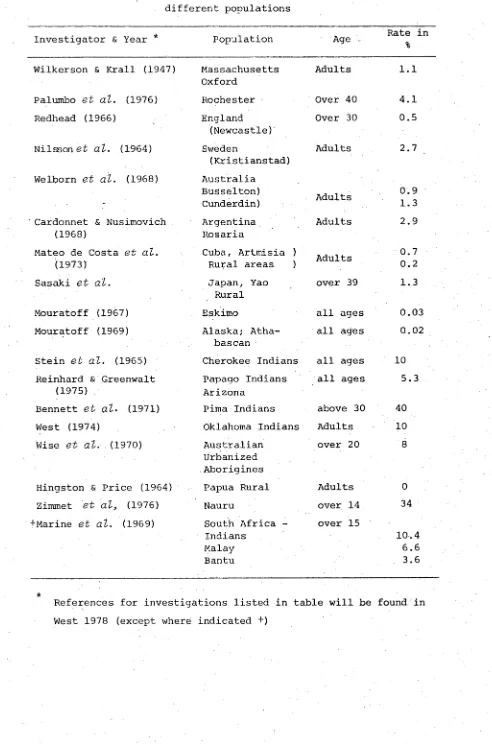
China, Japan, India and from Cappadocia (now called Iraq). More recently, epidemiological surveys have shown diabetes to be universally distributed among all populations. Rates for various parts of the world are summarized from West (1978) for IDDM in Table 1.2 and for NIDDM in Table 1.3. It should be remembered, however, that the rates have been determined by different methods and therefore are not always reliable.
The main points of interest which emerge from the survey of diabetes prevalence rates, as shown in these tables, is that there is a high rate of IDDM among Caucasian populations, ranging from 0.3 in France to 3.7 for 20 year-old conscripts in Australia , whilst in non-Caucasian populations IDDM has a very low rate. By contrast a high rate of NIDDM is commonly found among non-Caucasian populations whilst it is relatively low among Caucasians.
Recent interest has focussed on populations showing high prevalence rates of diabetes of the NIDDM type and also in situations where there is a striking contrast in diabetes prevalence rates among populations inhabiting the same geo graphical area.
The first focus of attention permits a discussion of possible environmental factors influencing the prevalence of diabetes, whilst the second suggests the possibility of environmental-genetic interaction. This possibility will be discussed below after examining environmental factors
alone.
Table 1.2 Prevalence rate of juvenile onset type of diabetes mellitus, or IDDM, in different populations. Note: Ref. for investigations listed in table will be found
in West 1978 (except where indicated +)
[nvestigator & Year Population Age Rate/
1,000 Source
Palumbo
e t a l .
(1976) Rochester Minn. School Children5-18 1.0 Survey of clinical records
>ultz
e t a l .
(1968) Erie County N. Y.0-16 0.6 Counting of known cases
falconer
e t al .
(1971) Edinburgh 10-19 0.93 Diagnosed cases Wadsworth & Jarrett(1974)
Britain 11 0.1 Diagnosed cases in
cohort
_,estradet (?) France 0-19 0.3 Registry (insulin
treated only) Cruger (1965) Schwerin
E. Germany
1-9 0.16 Urine screening >inelli (1976) Venice, Italy 0-13 0.26
iolmgren
e t al .
(1974) Vasterbotten County. Sweden0-15 2.2 Known cases ^hristau
e t a l .
(1976) Denmark 0-29 0.7 Registry houst & Smithurst(1968)
Australia 20 yrs (males)
3.7 Interview and regis tration for Nat.Service 1iki & Maruyama (1970) Japan 0-15 0.025 Survey estimate of
diagnosed cases
Sathe (1973) India - Rare
?ulloch (1962) Jeftel (1964)
Primitive blacks of several areas and in Chinese Indians & Malays of Singapore
Rare
lai
e t al .
(1965) Vietnam - Raretfang (1937) Chinese - Rare
Cassidy (1967) Indians & Melanesians of Fiji
Uncommon
Belcher (1970) Ethiopia - Uncommon
larrett & Keen (1975) Malta, Ceylon Cook Island Maoris &
Trinidad blacks
Uncommon
Sirnmet.
e t a l
3
(1978)Polynesians & Micronesians
- Rare
[image:23.522.12.518.113.804.2]Table 1.3 Prevalence of Adult onset diabetes, or NIDDM, among different populations
Population Rate in
Investigator & Year * Age
% Wilkerson & Krall (1947) Massachusetts
Oxford
Adults 1.1
Palumbo et at. (1976) Rochester Over 40 4.1
Redhead (1966) England Over 30 0.5
(Newcastle)
Nilsson et at. (1964) Sweden Adults 2.7
(Kristianstad) Welborn et at. (1968) Australia
Busselton)
Adults 0.9
- Cunderdin) 1.3
Cardonnet & Nusimovich Argentina Adults 2.9
(1968) Rosaria
Mateo de Costa et at. Cuba, Artmisia )
Adults 0.7
(1973) Rural areas ) 0.2
Sasaki et at. Japan, Yao over 39 1.3
Rural
Mouratoff (1967) Eskimo all ages 0.03
Mouratoff (1969) Alaska; Atha- all ages 0.02 bascan
Stein et at. (1965) Cherokee Indians all ages 10 Reinhard & Greenwalt Papago Indians all ages 5.3
(1975) Arizona
Bennett et at. (1971) Pima Indians above 30 40
West (1974) Oklahoma Indians Adults 10
Wise et at. (1970) Australian Urbanized Aborigines
over 20 8
Hingston & Price (1964) Papua Rural Adults 0
Zimmet et at> (1976) Nauru over 14 34
+Marine et at. (1969) South Africa -Indians
over 15
10.4
Malay 6.6
Bantu 3.6
■k
[image:24.522.18.510.60.804.2]South Australia (Wise et al} 1976).
These high rates seem to coincide with a change from a traditional to a 'Western' life style, associated with a high carbohydrate diet, often including excessive alcohol
intake and a reduced output of exercise, thus encouraging obesity
Environmental factors influencing prevalence of diabetes mellitus
Diet» obesity and exercise
The possibility that risk of diabetes is related to carbo hydrate consumption has been frequently suggested. This hypo thesis was based on several considerations. Although the ingestion of fat and protein also stimulates pancreatic beta cell function, the ingestion of carbohydrate presents a challenge to beta cells which is stronger, more direct and more immediate than when protein or fat are ingested alone.
Blood glucose, levels are higher immediately after ingestion of carbohydrates than after protein or fat. Improvement in diabetes is seen when the carbohydrate intake is restricted.
A very important issue is whether the increase in serum insulin levels is related mainly to obesity itself or to assoc iated factors such as indolence or the increased levels of food intake. Probably all three factors (obesity, overeating and inactivity) are significant (Grey & Kipnis 1971).
Himsworth (1935) cited evidence that high carbohydrate regimens might increase sensitivity to insulin. Perhaps Africans, who
are obese, are less hyperinsulinaemic than Americans who eat more fat and less carbohydrate (West 1978). Diet is a
variable factor in different ethnic groups, but it is not
the only index of variation in clinical features. For example, Rimoin & Schimke (1971) have shown variation in ketosis occurr ence in some countries when fat and carbohydrate consumption is the same (table 1.4).
For more than a century the dilemma of obesity causing diabetes or diabetes being the cause of obesity has been under intensive investigation. Vallence Owen (1962) and
Table 1.4
Ethnic variation in diabetes mellitus, (taken from Rimoin and Schimke 1971).
Ethnic Group
DIETARY
Fat Carbohydrate Ketosis Vascular Complications
European high high common common
Pima Indians (1 II
rare II
Seneca Indians I f If II II
Eskimo ft
low II
rare
Japanese low high If
uncommon
Indian II II If
common South African Zulu II I f
common rare
South African Indian It I t
rare very common
[image:27.522.18.510.101.805.2]group (Rao e t a l , 1966). Gupta e t a l , (1976) have shown diabetes to be 1.0% in thin persons and 9.3% in fat persons. Similar conclusions from other sources are compatible.
Evidence is set forth that much of the family aggregation of NIDDM is attributable to the family aggregation of obesity. This familiality of obesity has both genetic and non-genetic determinants. Observations of Baird (1973) illustrate the inter-relationships of the familiality of obesity and diabetes. Rates of diabetes were determined by testing
siblings of obese and non-obese diabetics. In obese siblings of non-obese diabeticsthe rate of diabetes was highest, while in the non-obese siblings of obese diabetics these rates were lowest (West 1978). Based on studies of populations such as New Zealand Maoris (Prior 1962), Hawaiians (Sloan 1963), urbanized Australian Aborigines (Wise e t a t , 1970) and Sumo Wrestlers of Japan (Kuzuva e t a l, 1975) , it is suggested
that obesity may precipitate diabetes in individuals
genetically susceptible to diabetes since, in other popula tions when obesity is rare, diabetes is rare (West 1978). The debate, however, can only be resolved by more detailed studies.
high levels of energy expenditure (Rubinstein et dl3 1969).
Age and Stress
The important relationship between age and diabetes,
although indicative of the physiological status of individuals, suggests either direct effects of aging itself or increasing susceptibility due to decreased resistance to infectious agents. Alternatively, it could reflect only secondary relationship with the disease.
Stress is reported to have some influence in precipita ting one form of diabetes. Claude Bernard's (1855) experi ments showed central nervous system lesions to produce diabetogenic effects. Interestingly, however, during World War I, despite stress of maximum degree, glycosuria was observed in only 2 of 40,000 American soldiers in a hospital centre in France. Similarly, the profound anxieties of civilian populations in Nazi-occupied territories during World War II were attended by substantial declines in the incidence of diabetes (Joslin et at, 1933).
Viral aetiology
One of the strongest suspected environmental components in the case of IDDM is virus infection. Viral suspects are many, but the main weakness to the hypothesis is the non isolation of the exact virus responsible. Some of the
1971).
Animal models, particularly in mice, have shown that a picorna virus-like coxsackie B and FMDV can produce a diabetes mellitus-like syndrome (Craighead and McLane, 1968; Boucher
and Notkins 1973) characterized by polydipsia and polyphagia. Mechanisms are known by which virus infections may trigger the subsequent development of immunological events in the
pancreas and other organs, progressing long after the acute infection (Nakhooda et at, 1977). The mechanism outlined by Freytag in 1974 shows the possibility that there can be a loss of immunologic tolerance so that the pancreatic islets are at risk to additional pancreatotropic viruses or to an ongoing smouldering, auto-immune process long after the initial infection subsides, leading to clinical diabetes mellitus
(Rayfield and Seto 1978).
years indicated a significant seasonal variation in inci dence (Gray et at, 1979). Evidence of diabetic cases
(IDDM) as a consequence of mumps infection have been reported since the last century (Stang 1864; Harris 1899) such that a direct causal relationship was suggested. Since then evidence for mumps preceding diabetes has been accummulating (Menser
et at, 1978; Craighead 1975).
In some patients with juvenile diabetes, especially early in the course of the disease, inflammatory cells have been observed in the islets of Langerhans (Gepts 1965). The number of insulin-producing beta cells is decreased and exogenous insulin is generally required. These features and the seasonal variation in the incidence of IDDM give support to the hypothesis that viruses are one cause of IDDM (Craighead 1975; Notkins 1977; Rayfield and Seto 1978).
Antibodies to coxsackie type B4 virus was more often found in diabetics than in controls in the same age group
The age-based correlation is known only for the coxsackie B4 viral incidence. Significance of infection in this age group can be due to a number of possibilities as suggested by Gamble (1976). Most viruses have their highest incidence at the age of 5 to 6 years, the infectivity of the virus may be low with a peak at 12-15 years. There may be a long period of latency between infection and development of overt diabetes. A single pancrea-trophic infection may produce sub-diabetogenic damage and several such infections may be required to produce overt diabetes. Alternatively, the infection may depend upon the strain of the virus, the passage history of the virus and the genetic background of the host (Notkins 1977).
Genetic factors influencing prevalence of diabetes mellitus
Having considered above the influence of environmental factors on the prevalence of diabetes, it was noted in the sections under diet and obesity that there is not always a high correlation between increased diet and prevalence of diabetes (table 1.4). This suggested to some investigators
(Zimmet 1979; Wise et als 1976 and Jackson 1970) , that environmental factors are not responsible alone for the manifestation of diabetes. Each ethnic group, therefore, may have a different predisposition to diabetes.
Two types of studies indicate the importance of this genetic/environmental interaction. The first is a compari
(1979) diabetes is rare in Melanesians, even when they become westernized but high diabetes prevalence rates have been reported in urbanized Polynesian and Micronesian populations. Diabetes is rare in Polynesians and Micronesian populations who have maintained a traditional life-style. They conclude, therefore, that the latter two groups may have a genetic susceptibility to diabetes which has been unmasked by the change from traditional to western life-style, in comparison with the former who, despite similar circumstances, show a low rate of diabetes.
The second type of study is concerned with the expression of diabetes in inbred strains of mice. Several distinct
recessive genes have been detected in mice which lead to a diabetes-like syndrome in the homozygous animal. Coleman and Hummel (1973)have shown that two of these recessive genes,
ob
anddb,
result in an identical syndrome when incor porated into strains with the same genetic background.However, the
db
gene on a BL/Ks background has a more severe diabetes-like condition with less pronounced obesity than thedb
gene on a BL/6 background. Thus the same genes may vary in their interaction with the environment when placed in a different general genetic background. Another valuable example is provided by the Japanese KK strain and Newremains moderately obese. These two distinct forms of genetic susceptibility to diabetes in the mouse demonstrate clearly the way in which they may differ in the response to changes in dietary patterns. Such differences could well be true for various ethnic groups in man. The following section will briefly consider the different approaches used in the genetic investigations in an attempt to uncover the mechanism of inheritance for the disease manifestation.
Previous studies of genetics in diabetes mellitus
The earliest record which exists suggesting a genetic basis and difference in types of diabetes, comes from Sanskrit trans lations. It is reported, by early Hindu physicians, that 'a person suffering from congenital Prameha (diseased urine) owing
to the fact that his birth from a father afflicted with
Mahumeha (honey urine) cannot be cured for the primary defect in the seed'. The disease was due to two causes, one,
attributable to use of injudicious diet and, the other, due to defect in the seeds of one's parent ^Sushruta Samhita , cited
in Simpson 1976). Rondoletius (1574) also reported the disease to be hereditary in nature.
In more recent studies, pooled family data has been examined for the best fit to Mendel's ratios of dominant, recessive and X-linked inheritance and analyses have utilized sib/parent and proband/sib incidence data to calculate the genetic pattern.
gene and early onset diabetes by a recessive gene, and that this was due to independent genes and these were not alleles, distinguishing between two types of diabetes (Cammidge 1928; 1934).
Mendelian expectations were applied to the data of off spring of parents, neither one or both of whom were affected The proportions obtained approximated values for recessive inheritance (Pincus and White 1933; Steinberg and Wilder 1952b) and further support for recessive inheritance came from Allan (1933) and Hanhart (1939). One study proposed X-linked inheritance (Penrose and Watson 1945) and received support (Barker et al3 1951) but was later altered to an autosomal recessive hypothesis.
From a study of 222 probands, without distinction into ages, however, a dominant gene with incomplete pene trance was proposed (Levit and Pessikova 1934; von Kries 1953). These conclusions were based on the fact that the frequency of diabetes among the parents of probands was about equal to that among the sibs. Young diabetics were more likely to have diabetic relatives than the older onset types, and thus early onset type of diabetes was due to a homozygous condition and late onset type due to a heterozygous
The attempt to estimate frequency of diabetes from the age of onset among parents was not successful due to the variable nature of diabetes and its mode of inheritance. Despite the lack of agreement on a clear-cut genetic basis for diabetes, family studies provide an empirical basis for estimating the risks of predisposition to the disease, particularly with respect to age of onset. Results from a study of 100 pairs of parent and child diabetics, showed that the average age at onset decreases 20 years per generation and that a child would rarely, if ever, become diabetic at a greater age than that when his parents became affected. This was known as 'anticipation' (Woodyatt and Spetz 1942). Since this was a statistical phenomenon and not a biological one, support was meagre (Steinberg and Wilder, 1950; 1952a).
Later methods were developed to improve estimation . such as K-ratio (Penrose 1953) used to estimate the familial/population frequencies of diabetes in the first degree relatives (Edwards 1960). In families of (IDDM) juvenile onset diabetes corrected for age by weighted means from the different age groups, familial incidence was much higher than incidence in the general population
(1965) used a quantitative approach to study the genetics of diabetes. This involved the use of 'heritability of liabili ties'. The method developed, utilised data on the incidence of diseases to answer the question of relative importance of heredity and environment.
The degree of genetic determination which, in the study of human populations is called heritability, is the fraction of variation between individuals which causes some to be affected and others not. This was applied to obtain an estimate of correlation or regression coefficient.
'Liability' was referred to as a hypothetical attribute that gave a graded scale of the degree of affectedness or of normality. This term was preferred to 'susceptibility'
because it expressed the susceptibility and whole combination of external circumstances which makes an individual more or
less likely to develop the disease, whereas susceptibility implies the innate tendency as distinct from the external circumstances (Falconer 1965).
Despite the sophisticated statistical approach, the method was not satisfactory in determining the mode of inheritance for diabetes mellitus.
Analysis by complex segregation among families was used to discriminate between the hypotheses of two allele single locus inheritance and multifactorial inheritance. Three situations were considered using age of onset for the
major gene action (Goodman and Chung 1975) whereas, when the families were divided into IDDM and NIDDM types, based on insulin treatment in the proband, for IDDM no evidence for a major locus was obtained (Zavala et at, 1979). However, for NIDDM or middle and late onset cases, the data fit both a single locus model and a multifactorial model (Goodman and Chung 1975). In some cases of NIDDM, a suggestion of
recessive inheritance was indicated and, in others, a strong evidence for a major locus was noted^avala et at, 1979).
Attempts to identify the 'diabetic genotype' were encouraged by use of glucose tolerance tests as an index
(Fajans and Conn 1954; Taylor et at, 1967; Köbberling 1969). For a single gene hypothesis one would expect bi modality in the distribution of blood sugar values among first degree relatives. However, a continuous distribution was obtained with no clear-cut division into normal and affected individuals (Thomson 1965). Since impaired glucose tolerance had a much higher frequency among the relatives of diabetics than in controls, an estimate was made to predict the risk of diabetes in children, based on age.
Different values were assumed by different authors. In some cases it was estimated that 100% of children would have impaired glucose tolerance if they lived long enough
mode of inheritance. Family studies of GTT in different ethnic groups gave fits to various genetic hypotheses.
Among the Pima Indians of North America, where a high frequency of impaired glucose tolerance prevails, a bimodal distribution of glucose levels was obtained. Steinberg et (1970) using a maximum likelihood method of classifying genotypes from a bimodal distribution showed a fit to recessive inheritance. Data on Seminole Indians of Oklahoma, however, with a similar analysis gives fits to both recessive and dominant modes of inheritance. But the Seminole Indians in Florida did not fit either hypothesis (Elston et al3 1974).
Family data on GTT among Caucasians from the U.S., Britain and Japan (Neel et al3 1965; Thomson 1965; Mimura et al> 1964) fit a multifactorial hypothesis. On the basis of a tolbutamide tolerance test on parents of early-onset patients, it was concluded that parents were heterozygous and children homozygous for a gene at the same locus (Braunsteiner et al3 1966), a conclusion similar to that of Harris (1950). Thus the results from GTT studies do not give a consistent explanation of the mode of
inheritance.
proportion of genes is estimated to be about 20% (Reed 1969). Accordingly, if IDDM is inherited in a recessive manner then its frequency in the U.S. Black population should be l/25th of the frequency in Caucasians. However, from the results of Macdonald's (1980) studies it is seen that the ratio of the frequency of IDDM in U.S. Blacks to that in Caucasians is of the same order as the ratio of Caucasian genes in the Black population and this data gives a better
fit to a dominant mode of inheritance than a recessive one. In response to the above hypothesis another study (Rotter and Hodge, 1980) showed that the data can also be explained by a three allele model taking into account the heterogeneity within IDDM. More data may perhaps enable assessment of the mode(s) of inheritance within IDDM more clearly.
Other studies have utilized data on destruction, production and rate of release of insulin among patients. One study showed that a high level of synalbumin, the
insulin antagonist, among diabetics was dominantly inherited (Vallence Owen 1966). In another study, it was suggested that NIDDM patients were heterozygous for a gene for increased synalbumin and IDDM patients were homozygous for the same gene (Ehrlich and Martin 1966). These results were, however, not reproducible.
Twin studies
the disease. This was further recognized on the basis of studies on twins whereby a genetic component was demonstrated. Since twins may be monozygotic (MZ), sharing the same genetic components and environment, the influence of genetic factors will be stronger as compared to that of ordinary sibs within a family. Dizygotic (DZ) twins, on the other hand, share a similar environment but not all the genetic components.
Early work on diabetic twins by May (1914), Curtis (1929) and Watson (1934) demonstrated the importance of the genetic component in diabetes through a difference in the concordance of diabetes between monozygotic and
Table 1.5
Clinical concordance rates for diabetic twins. (taken from Langenbeck and Jörgensen 1976)
Authors Monozygotic T. Dizygotic T.
Then Bergh 1938 17/36 9/50
Lemser 1938 9/12 3/14
White and Pincus 1946 16/33 2/63
Harvald and Hauge 1963 36/76 22/238
Gottlieb and Root 1968 9/30 2/60
Mean 87/187 38/425
= 46.5% = 8.9%
In juvenile IDDM familial incidence of the disease is higher among concordant MZ twins than in discordant twins
(Tattersall and Pyke 1972) confirming Luxenberger's expec tation (1935). This implies a predominantly exogenous cause among the discordant MZ twin pairs.
The question raised by discordance of twins, in the IDDM cases, may be related to the time between the diagnosis of the first twin and the development of diabetes in the other twin. Most concordant twins develop diabetes within a time span of 3-10 years of each other. However, in these studies the discordant pairs have remained so even beyond 32 years. The possibility of the discordant twins becoming con cordant over a period of longer time (Rosenthal et als
1976) did not receive support (Pyke et at3 1976). Therefore, it was concluded that early onset twin pairs will remain discordant, perhaps indefinitely, and the unaffected
The IDDM twins were investigated for HLA antigens (to be discussed more fully in the next section) and the relative risk for HLA-B 8 positive individuals was 1.5, whereas, for HLA Bwl5 = 3.5. Further analysis revealed an increase of Bwl5 antigens in both concordant and discordant twins whereas B8 was increased only in concordant pairs. No HLA association was seen among the NIDDM twin pairs (Nelson et aZ3
1975).
One study of identical triplets showed triplet A
became diabetic at age 13; triplet B, 8 years later, while C remained non-diabetic, showing normal glucose tolerance tests 11 years later. HLA-B15 was present in all three. The two diabetic triplets showed capillary basement membrane thickening but this was not true for the normal one (Ganda
et al3 1977) .
It can thus be concluded that the twin studies have
been important in indicating the different genetic contribution to the susceptibility to the two major types of diabetes.
(Gamble and Taylor 1969; Notkins 1977).
By contrast to the results in IDDM, twin data for NIDDM suggests a very strong genetic component. This is evidenced by Then Bergh's (1938) study, whereby identical twins above the age of 43 are 100% concordant for abnormal glucose metab olism. This phenomenon was further supported by another study of Pyke (1977) where in his large series, over the age of 45 years all twins are concordant for NIDDM, although he points out that other workers have found a few discordant twins with NIDDM.
These observations do not deviate significantly from that expected under recessive inheritance hypothesis.
According to Steinberg (1959) the individuals with a genetic susceptibility (which he determined on the basis of affected relatives present in a pedigree) will eventually become diabetic in their life span. Although Steinberg does not clearly state the type of diabetes, this mechanism could apply for the NIDDM type of diabetes due to a long natural history of the disease. However, careful studies are still necessary to examine whether the hypothesis can be accepted or rejected.
Present status of genetic markers in diabetes mellitus
This section will be discussed in two parts - A and B. Part A will deal briefly with HLA markers in diabetes
Part A
HLÄ associations with diabetes mellitus
The Major Histocompatibility Complex in man consists of at least 4 loci (A, B, C and D). The A, B and C loci were detected first using serological methods. The fourth locus, D, was designated initially on the basis of reactions in mixed leucocyte cultures (MLC). More recently, however, D locus antigens have been detected by serological tests against B lymphocytes. The locus controlling these antigens has
been termed DR and it is very close to or identical with the D locus controlling MLC reactions.
From the analogous studies in mice and monkeys, the MHC system has been found to control specific immune responsiveness to certain antigens (Benacerraf 1974; McDevitt and Benacerraf 1969). The fact that nearly all
associations so far observed between diseases and HLA are stronger with B or D series antigens than with A and C series antigens has been taken as evidence in favour of the existence of immune response (Ir) genes located between the B and D loci.
In an early study no HLA associations with IDDM were observed by Finkelstein et at. (1972). However, in a sample of unrelated Caucasian patients a slight increase in the B locus antigen, Bwl5 was noted by Singal and Blajchman (1973). Following this, reports from two independent sources, almost simultaneously, demonstrated significant association of IDDM with HLA-B8 and Bwl5 (Nerup
association of the HLA-D locus antigen Dw3 was noted (Thomsen
et at3 1975). A brief review of association with HLA antigens
will be considered, details of which are found in reviews by Cudworth (1978) and those in Creutzfeldt et at3 (1976).
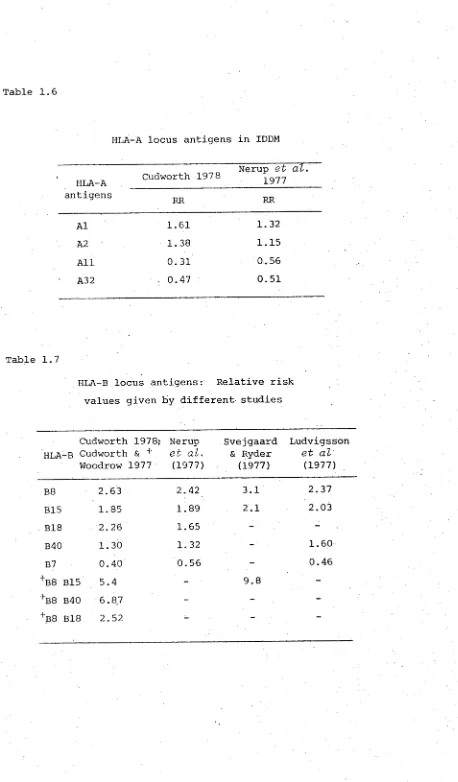
HLA-A locus antigens in IDDM
The frequency of HLA-A antigens in patients below 30 years of age indicate relative risks (RR) ranging from 1.61 for Al to 0.47 for A32 in Caucasians (table 1.6). This increase is secondary to the strong A1B8 linkage disequilib rium (LD). This is a phenomenon whereby, despite crossing over between the various loci of HLA, some HLA genes tend to occur together significantly more frequently in the same haplotype than would be expected under the assumption of equilibrium (Svejgaard et al3 1975). Similarly for A 2 , the
increase is due to LD with B15.
HLA All remains significantly decreased over all popula tions showing no heterogeneity between the results (Cudworth 1978; Nerup et al3 1977). Reports from other sources
(Svejgaard 1974; Seignalet et al3 1975) also showed a similar decrease of HLA All.
HLA-B locus antigens in IDDM
Table 1.6
HLA--A locus antigens in IDDM
HLA-A Cudworth 1978
Nerup et al. 1977 antigens
RR RR
Al 1.61 1.32
A2 1.38 1.15
All 0.31 0.56
A32 0.47 0.51
Table 1.7
HLA-B locus antigens: Relative risk values given by different studies
HLA
Cudworth -B Cudworth Woodrow
1978; & + 1977
Nerup et al.
(1977)
Svejgaard & Ryder
(1977)
Ludvigsson et al
(1977)
B8 2.63 2.42 3.1 2.37
B15 1.85 1.89 2.1 2.03
B18 2.26 1.65 -
-B40 1.30 1.32 - 1.60
B7 0.40 0.56 - 0.46
+B8 B15 5.4 - 9.8
-''B8 B40 6.87 - -
[image:47.522.47.505.22.804.2]In the Copenhagen data, B18 has a lower RR value of 1.65 compared to the Liverpool data of 2.26. HLA phenotype combinations have provided interesting high risk values for B8 + B15; B8 + Bw40 and B8 + B18 with 5.40, 6.87 and 2.52 respectively. Svejgaard and Ryder (1977) using combined data showed a RR = 9.8 for B8 + Bl5.
HLA-C locus antigens in IDDM
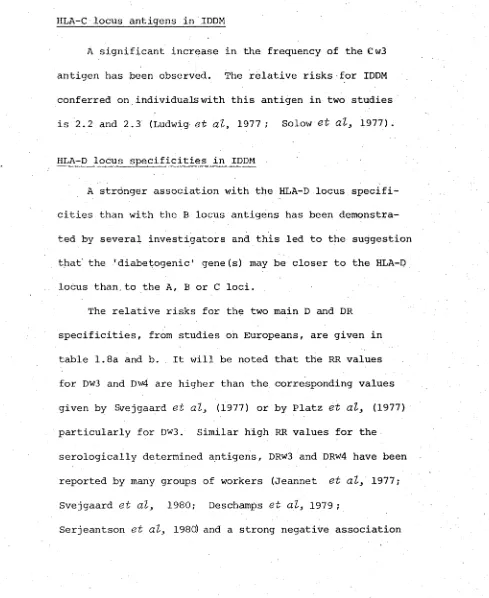
A significant increase in the frequency of the Cw3 antigen has been observed. The relative risks for IDDM conferred on individuals with this antigen in two studies is 2.2 and 2.3 (Ludwig et at, 1977 ; Solow et at, 1977).
HLA-D locus specificities in IDDM
A stronger association with the HLA-D locus specifi cities than with the B locus antigens has been demonstra ted by several investigators and this led to the suggestion that the 'diabetogenic' gene(s) may be closer to the HLA-D locus than.to the A, B or C loci.
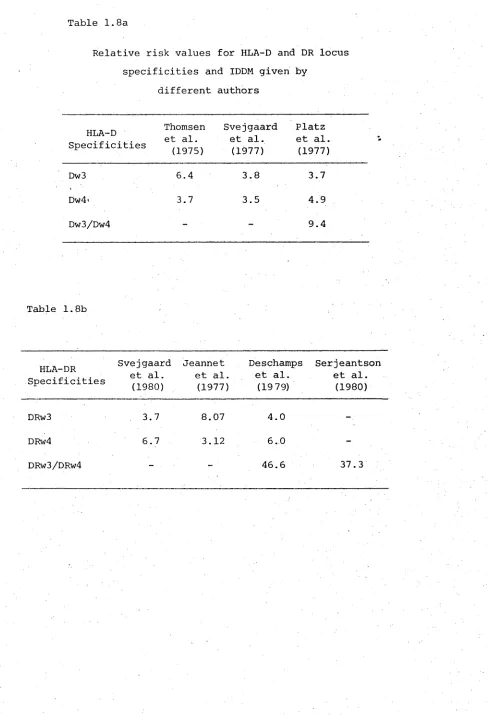
The relative risks for the two main D and DR specificities, from studies on Europeans, are given in table 1.8a and b. It will be noted that the RR values for Dw3 and Dw4 are higher than the corresponding values given by Svejgaard et at, (1977) or by Platz et at, (1977) particularly for Dw3. Similar high RR values for the serologically determined antigens, DRw3 and DRW4 have been reported by many groups of workers (Jeannet et at, 1977; Svejgaard et at, 1980; Deschamps et at, 1979;
[image:48.522.18.507.204.802.2]Table 1.8a
Relative risk values for HLA-D and DR locus specificities and IDDM given by
different authors
HLA-D Specificities
Thomsen et al.
(1975)
Svejgaard et al.
(1977)
Platz et al.
(1977)
Dw3 6.4 3.8 3.7
Dw4 3.7 3.5 4.9
Dw3/Dw4 - - 9.4
Table 1.8b
HLA-DR Specificities
Svejgaard et al.
(1980)
Jeannet et al.
(1977)
Deschamps et al.
(1979)
Serjeantson et al.
(1980)
DRw3 3.7 8.07 4.0
-DRw4 6.7 3.12 6.0
[image:49.522.22.510.84.799.2](with relative risk values of less than one) with DRw2 in IDDM (Platz et al3 1977; Mayr et al3 1977).
HLA associations with NIDDM and late onset insulin dependent diabetes
Among Caucasian non-insulin dependent diabetes mellitus (NIDDM) no disturbance in the frequencies of HLA antigens has been observed (Cudworth and Woodrow 1976; Nerup ct <2^ 1974). Recently, however, two studies have disclosed an HLA antigen association with NIDDM among non-Caucasian populations.
There is a significant increase in frequency of Bw35 and A2 among the IDDM and NIDDM patients of some South African Black populations (Xhosa) unlike the South African white population, relative risk being 2.92 and 2.34
respectively among NIDDM patients (Briggs et als 1980). For the Fiji Indian population, at the HLA-B locus there is a significant increase in Bw61, RR = 3.65 (Serjeantson
et al3 1980) .
Ethnie variation in HLA association with IDDM populations
HLA typing among Europeans and North American Caucasians have shown striking increase in A 1 , B8, B15, B18, Cw3, Dw3 and Dw4 antigens among the IDDM patients. In contrast, other antigens HLA Aw32, B5, B7 and Bw35 and particularly Dw2 are found less commonly in IDDM patients. Studies of the HLA system in non-Caucasian populations have revealed a variety of associations of HLA-B and D locus antigens among IDDM patients.
Among the South African Negro populations, mainly Zulus in Durban, an increased frequency of B8 and B14 are noted
(table 1.9). HLA-B7, which is considered a protective antigen among Caucasians, is increased in this population. However, Bw42 detected only in the Black populations, is seen to be lower (Hammond et dls 1980). In another study of South African IDDM patients (Hammond and Asmal 1980) Indians who originated in south India showed a positive association with B8 but not with B15, whilst Indians who originated in north India showed an increase of Bw52.
Among Chinese a strong association of DRw3 and DRw4 was noted in IDDM whereas for the B locus antigens there
was an increase only of B17 (Maeda et at. 1980). Previous results among the Japanese IDDM showed an increase of B12 (Nakao et at3
1977). Later, however, a split of Bw22-J (Bw54) was also shown to be increased (Okimoto et al3 1978).