by
Weldon Bailey Nance
A thesis submitted in fulfilment of the requirements for the degree of
MASTER OF SCIENCE
Statement
The analytical data and conclusions presented in this thesis are my own unless otherwise acknowledged in the text.
Archaean to Cenozoic, were analyzed for the rare earth elements in order to detect any secular changes in rare earth distribution. The abundances of Th, U, Hf, Ba and Cs were also determined. The samples analyzed were mainly shales, greywackes and subgreywackes.
Most of the samples show rare earth distribution patterns similar to those previously reported for composites of North American and European Palaeozoic shales. These samples, which range in age from Middle
Proterozoic to Cenozoic, show remarkably constant relative rare earth patterns and are hereafter referred to as the post-Archaean sediments. The post-Archaean sediments are characterised by almost constant negative Eu anomalies (average Eu/Eu* = 0.67 +_ 0.05) relative to chondrites. The ratios of light to heavy rare earths are also approximately constant
(average ELREE/EHREE = 9.7 +_ 1.8). In contrast to this, the Archaean
sediments of the Kalgoorlie area, Western Australia and a suite of Devonian volcanic greywackes show large enrichments in Eu relative to the post- Archaean sediments and values of ELREE/EHREE which are outside the range
shown by the post-Archaean sediments.
The absolute abundances of the rare earths are generally higher in the younger sediments than in the older sediments. There is a
suggestion that the absolute abundances of the rare earths in clastic sediments have gradually increased throughout time.
The almost constant nature of relative rare earth distribution patterns shown by the post-Archaean sediments is apparently due to the
ii
retention of Eu in the lower crust by plagioclase, since plagioclase is usually a stable mineral phase during partial melting at crustal depths. Since no secular change in relative rare earth distribution was detected in the post-Archaean sediments, a uniform process of crustal growth and evolution seems to have operated over the past 1500 million years. The trend of increasing absolute abundnaces of the rare earths through time, if real, may possibly be related to a gradual reduction in the average degree of partial melting in processes of magma genesis.
The rare earth distribution patterns shown by the Archaean sediments are consistent with the derivation of these sediments from bimodal mixtures of detritus from the mafic and Na-rich fel sic rocks in the Kalgoorlie area. The felsic rocks which served as source material for the sediments are characterized by large depletions in the heaviest rare earths and do not show negative Eu anomalies relative to chondrites. These features are interpreted as due to an origin of the felsic rocks by partial melting of tholeiitic basalts at depths greater than 40 km. The differences in rare earth distribution patterns between the Archaean and post-Archaean sediments suggest that the processes responsible for crustal development in the Archaean were not strictly analogous to those operating since the Middle Proterozoic.
TABLE OF CONTENTS
Page
Acknowledgements v
Chapter 1 Introduction 1
Thesis objective 1
Rare earth chemistry 2
Historical background 5
Geological time scale 10
Chapter 2 Sample Selection 13
Introduction 13
The Eastern Goldfields Province 14
Mt. Isa Group 16
Amadeus Basin 18
State Circle Shale 21
Baldwin Formation 21
Canning Basin 24
Perth Basin 24
Carnarvon Basin 27
Summary 27
Chapter 3 Analytical Methods 32
Sample crushing 32
Mass spectrography 32
Chapter 4 Experimental Results 36
Introduction 36
Eastern Goldfields Province 38
Mt. Isa Group 38
Amadeus Basin 45
State Circle Shale 45
Baldwin Formation 53
Canning Basin 53
Perth Basin 60
Carnarvon Basin 60
Chapter 5 Discussion 67
Variations in rare earth patterns 67
Introduction 67
Eu anomalies 67
ELREE/EHREE ratios 68
Absolute abundances 69
Summary 7 0
Rare earth fractionation in the sedimentary cycle 70
Archaean sediments 76
Introduction 76
Eu anomalies 78
Sediments depleted in the heaviest rare earths 81
Sediments depleted in the light rare earths 85
KII41 93
Rare earth distribution and stratigraphic
iv
Page Archaean crustal development in the Kalgoorlie 99
area
Post Archaean sediments 106
Introduction 106
The upper crustal rare earth pattern 107
Absolute abundances 107
Theories of crustal growth and evolution 113 Implications of the rare earth data for growth
and evolution of the continental crust 114 The sedimentary rare earth pattern and the
origin of tektites 122
Chapter 6 Conclusions 125
References 128
Acknowledgements
A study of rare earths in Australian sediments was suggested as a research project by Dr. S.R. Taylor. The project was jointly supervised by Drs. S.R. Taylor and J.A. Broomhead, and their advice and encouragement are gratefully acknowledged.
Dr. S.R. Taylor kindly provided the samples, and permitted me to use his unpublished major element data. The samples were collected by him from a variety of sources. The Bureau of Mineral Resources, Canberra and Mt. Isa Mines Ltd. provided drill core samples. Additional samples were donated by Drs. K.S. Heier and B.W. Chappell. Dr. C. Roddick provided a sample of the Kambalda Granite.
I am grateful to Mr. D.J. Whitford for permission to quote his unpublished data on calc-alkaline rocks, and for many stimulating discussions which influenced my thinking on the Archaean rocks. I also benefited from discussions with Drs. A.Y. Glikson and C. Roddick and Mr. K. Harris. The occasional help of numerous other people in the
Research School of Earth Sciences is also acknowledged. The expert typing of Mrs. N. Blundell assisted in the preparation of this thesis.
1
Chapter 1 Introduction
Thesis objective
This thesis reports the results of a study of rare earth element distributions in Australian sedimentary rocks. The primary object is to search for possible changes in rare earth distribution in the upper continental crust through time. Sediments represent the results of a crustal mixing process, and so are amenable to the study of compositional trends in the upper crust. Changes through time in major element chemistry of the important sedimentary rock types have been reported (Carrels and Mackenzie, 1971; Ronov, 1972).
It is not certain if some of these changes are due to sedimentary recycling, or to more fundamental changes in the composition of the crust. The rare earth distribution of sediments is assumed to represent that of the upper continental crust (Haskin et a l ., 1966). Thus, by analyzing sediments of different ages it may be possible to detect changes in the rare earth distribution of the upper crust. These changes might correspond to changes in the relative amounts of the different types of igneous rocks contributing to the crustal composition. Most common igneous rock types have distinct rare earth distribution patterns, and the well known chemical coherence of the rare earths makes them more resistant than other elements to
fractionation by weathering. Thus, the rare earths are sensitive to lithological change, and their distribution in the upper crust can be measured in sediments. This makes them unique among the elements, and suited for this type of study.
ancient sediments, in order to search for differences between the two extremes. No rare earth data on Australian sediments has appeared, although this continent has an abundance of ancient sediments. In this study I have included samples from nearly every major period in geologic time, in order to obtain a more detailed view of possible trends. The sediments range in age from about 2800 to 50 million years. In most previous investigations the object of sample selection has been to include as many different types of sedimentary rocks as possible (shales, various types of sandstones, carbonates and ores). Many of the samples were composites of rocks from different formations.
In this study I have attempted to use only clastic sediments. The use of composite samples has been avoided. Major element chemistry and bulk mineralogy were available for each sample used in the study.
Another important object of this thesis is to evaluate the usefulness of sedimentary rare earth data in solving other geological problems. The possibility of using the rare earths as indicators of sedimentary provenance is considered. The effect of weathering during deposition on rare earth distribution is also investigated.
The average sedimentary rare earth pattern deserves separate attention. If, as we assume, the sedimentary rare earth patterns are representative of the upper crust, then they may have implications for theories on the genesis of the upper and lower crust. This
possibility is explored in the light of recent theories of magma genesis.
Rare earth chemistry
3
group, because its geochemical behaviour is quite similar. The
chemical similarity of the lanthanides is due to the valence electron configuration remaining unchanged while the 4f electron energy level is being filled. The net effect of adding another proton to the nucleus and the shielding effect of another 4f electron, is a signif icant reduction in ionic radius with increasing atomic number. The
° 3+
ionic radii of the lanthanides thus decreases from 1.06 A for La to
0 3+
0.85 A for Lu (Templeton and Dauben, 1954). The ionic radius for
3+ °
Y is 0.88 A (Zachariasen, 1954), which should make it close to Er
o o
and Ho (0.88 A and 0.89 A) in geochemical behaviour. Fig.1.1 shows a plot of lanthanide atomic numbers versus ionic radii, and this clearly shows the nearly linear relationship which is the basis of rare earth geochemical behaviour. The only common exceptions to a stable +3 oxidation state for the rare earths in geological samples are Eu and Ce. Eu may be reduced to the +2 oxidation state, which causes its geochemical behaviour to resemble that of Sr^+ , since the ionic radius of both is about the same. The only common rock forming minerals known to selectively retain Eu in preference to the other rare earths are the feldspars (Schnetzler and Philpotts, 1970). Ce can be oxidized to the +4 oxidation state, but examples of this in rocks are rare.
The "light rare earths" (La-Sm) belong to that group of elements, which due to their large ionic radii and/or high charge, are strongly excluded from most major minerals during partial melting or fractional crystallization processes. They are partitioned into the melt, which results in them being concentrated in the last phases to crystallize. They are commonly found in geochemical association with elements such as Th, U, Rb, K and Zr. The smaller ionic radii of the "heavy rare earths" (Gd-Lu) enables them to occupy lattice sites in
2+
0 . 9 0
ATOMIC
NUMBER
5
is the only major element cation for which the heavy rare earths can substitute (Taylor, 1964). As a result, the heavy rare earths usually behave as a more coherent group, and are less enriched in the upper crust than the light rare earths. Eu, when not enriched or depleted due to its ability to enter the 2+ oxidation state, is transitional
between the two groups.
Historical background
Prior to 1960 most geochemists considered that the rare earth elements were not subject to serious fractionation in the earth. Thus it should still preserve its initial distribution pattern (for a discussion of early views see Taylor, 1960). Early studies of the rare earths, by Minami (1935) in sediments and by Noddack (1935) in chondrites, indicated that a large difference existed in rare earth distribution between the earths crust and chondrites. However, most geochemists dismissed the differences as probable analytical error. This had some justification, since chemists had experienced great difficulty in separating the elements by conventional techniques. In his explanation of the principles of geochemistry, Goldschmidt
(1937) had pointed out the importance of ionic radii to the geochemical distribution of the elements. The implications of this with respect to fractionation of the rare earths in rocks were only realized when the advent of sensitive analytical techniques, such as neutron
activation, produced data which proved that a major fractionation of these elements had occurred.
decided that although the rare earth distribution for the whole earth was probably similar to that of chondrites, an upward concentration of the light rare earths had enriched the crust in these elements.
He attributed this to a crystal chemical effect, due to the differences in ionic radii. The next major advance was made when Masuda (1962) and Coryell et a l . (1963) suggested normalizing rare earth abundances to those of chondritic meteorites in order to make comparisons of abundance data. This removed the saw tooth effect of the Oddo-Harkins rule (even Z abundances > odd Z abundances), and resulted in smooth distribution patterns when chondrite normalized abundances were plotted versus atomic numbers or ionic radii.
The credit for suggesting that rare earth abundances in sediments are typical of the upper continental crust is due to
Goldschmidt (1938). He considered that the mixing effect of weathering processes should result in a constant rare earth distribution for nearly all sediments. Later work by Ronov et a l . (1972) has shown that
Goldschmidt overestimated the degree of homogeneity of the rare earths in sediments. Sediments show differences in their rare earth distrib ution that reflect differences in both provenance and sedimentary rock type, but these differences are small when compared to the range in distribution shown by igneous rocks. Thus, sedimentary rocks are still considered as the best first approximation to the composition of the upper continental crust with respect to rare earth distribution. It
7
North American shales be taken as representative of the upper
continental crust. In recent years it has become popular to normalize rare earth abundances in sedimentary rocks to the North American
shbles rather than to chondrites. Chondrite normalized plots allow comparison to the presumed upper mantle distribution, while shale normalized plots allow comparison to the upper crustal distribution.
Haskin and Gehl (1962) determined rare earth abundances in ten sedimentary rocks, and noted that the three Precambrian sediments all had anomalous distribution patterns. They suggested that this could be due to either selective leaching or to a lesser degree of homogeneity in the Precambrian crust. This came at a time of renewed interest in the subject of chemical evolution of the continental crust. A case for change and growth of the continental crust was made by Engel (1963) and Hurley et a l . (1962), while the opposing view was put forward by Patterson and Tatsumoto (1964) and Condie (1967). The latter group held that the continents had achieved their present size and composition prior to about 3000 million years ago, and had changed very little since that time.
Balashov and Goryainov (1966) determined rare earth distributions in Lower Proterozoic metamorphic rocks, and observed that they were characterized by lower La/Yb ratios and much lower total rare earth contents than the North American shales. They attributed this to a gradual change from mafic to fel sic magmatism through time. Felsic rocks have a tendency to be more highly enriched in the light rare earths and to have a higher total rare earth
to the mafic character which they believed Archaean sediments to have, and they suggested that a sharp change in rare earth distrib utions would occur at the boundary between the Archaean and the
Lower Proterozoic. It has long been the contention of Ronov and his co-workers, that weathering products from granitic rocks only began to enter the sedimentary cycle in large amounts during the
large scale granitization event at the end of the Archaean (Ronov and Migdisov, 1970). Schnetzler and Philpotts (1967) determined the rare earth distributions in five Precambrian sediments, with the expressed purpose of looking for signs of a gradual development of rare earth distribution through time. They reasoned that
because the crust was enriched in the light rare earths, then the mantle might have become progressively depleted in these elements through time. According to this assumption, mantle derived rocks that were produced earlier in the earth’s history would be expected to show a higher degree of enrichment in these elements than rocks produced in later periods. No significant difference was detected between the Precambrian sediments and younger sediments as
represented by the North American shales. It was concluded that the rare earths might be concentrated into a small part of the mantle which serves as a source region for new crustal rocks, or that the
lower crust may be depleted in the rare earths. Either of these possibilities would make an evolutionary change in rare earth
distribution harder to detect. Using a similar approach, Goles (1968) failed to find any notable differences between Archaean and modern plutonic rocks. Haskin et al. (1968) reported that improved analytical
9
indicated they were enriched in Eu relative to the North American shales, and the degree of enrichment seemed to increase with age. In another important paper, Ronov et a l . (1972) reported that sediments from geosynclines exhibited a different rare earth distribution to sediments of platform areas. This was thought to be due to a higher mafic volcanic component in the geosyncline, and to differences in conditions for weathering. The Eu enrichment in Lower Proterozoic and Archaean sediments reported by Haskin et al.
(1968) was explained as being the result of a dominance of
geosynclinal sedimentation with a high mafic component in the Early Precambrian. Wildeman and Haskin (1973) and Wildeman and Condie
(1973) have confirmed the earlier report of anomalous Eu enrichment in ancient sediments with a study of rare earths in Lower Proterozoic and Archaean samples. Apart from the Eu enrichment and somewhat lower absolute rare earth abundances in the older rocks, they found the relative distribution patterns to be identical to that of the North American shales.
The effect of weathering during the sedimentary cycle on rare earth distribution was studied by Balashov et a l . (1964).
Weathering was not an important influence on the rare earth distrib ution in sediments formed under arid conditions, but in a humid environment the rare earths were concentrated in the clays and depleted in the sands.
La/Yb ratios were the same in clays, sands, and carbonates formed in an arid environment, but showed a progressive decrease from clays to sands to carbonates in a humid environment. In a later study
metamorphosed sediments from Maine. They also implied that Eu depletions were due to weathering effects. Roaldset (1973) has interpreted the rare earth distribution of clays from the Numedal area, Norway as being strongly influenced by environmental factors.
Even though some local differences may be due to climatic changes or other environmental factors, it is reasonable to assume that an overall balance in rare earth abundances will be maintained. The abundances of the rare earths in sea water are very low
(Wildeman and Haskin, 1965), so significant removal of the rare earths from continental areas does not seem likely. Much more work is needed before the role of weathering in distribution of the rare earth elements is known with any certainty.
The points on which previous investigators seem generally agreed can be summarized as follows.
1) Sediments have rather similar reltive rare earth distributions, although some variations occur.
2) Palaeozoic and younger sediments usually have a negative Eu anomaly relative to chondrites, while Early Precambrian
sediments often have no Eu anomaly relative to chondrites.
3) The average rare earth abundances in sediments reflect the average rare earth abundances in the crystalline rocks of the upper crust.
Geological time scale
11
Cenozoic: Quaternary:
Tertiary: Pliocene Miocene Oligocene Eocene Palaeocene
Mesozoic: Cretaceous 95
Jurassic 200
Triassic 240
Palaeozoic: Permian 280
Carboniferous 370
Devonian 415
Silurian 445
Ordovician 515
Cambrian 590
Upper Proterozoic: 1400
Middle Proterozoic: 1800
Lower Proterozoic: 2300
Archaean:
Age to base (millions of
years)
7 26 38 54 65
time presents a greater problem. Many different systems have been proposed for both world-wide (Vinogradov and Tugarinov, 1968) and Australian subdivisions (Dunn et al., 1966). Some terms such as "Archaean" and "Proterozoic" are in wide use, but there is no general agreement as to the age of the boundary between them (Rankama, 1971). The Precambrian subdivisions based on these terms shown in Fig. 1.2 were chosen because of their relevance to Australian stratigraphy
13
Chapter 2
Sample Selection
Introduction
The aim of sample selection was to obtain well preserved sedimentary rocks, and to cover the widest possible range in ages. Core samples were preferred, since they are less likely to have been altered by post depositional weathering than are rocks exposed in outcrop.
The ages of sedimentary formations listed in this chapter refer to the time of deposition. The time of deposition is known reasonably well for each of the sedimentary formations analyzed.
In this chapter the samples analyzed in this study are described. A brief description of the geology of each sampling area is given, and the major element chemistry of each sample is presented and discussed. The major element chemistry was provided by Dr. S.R. Taylor. The data was obtained with an X-ray fluorescence technique similar to that described by Norrish and Hutton (1969). Loss on ignition is the weight loss after heating to 1100°C.
A classification based on chemistry and petrography is given for each sample. The classification system used is that of Pettijohn
(1957). Greywacke is the term used to denote a sandstone which
sized particles (1/16 to 1/256 mm.), which contain only small amounts of matrix material. The term shale is used to denote similar rocks, but which contain more than about 25% clayey matrix and show fissility. More fundamental genetic differences are not meant to be implied by these terms as they are used here. Many of
the rocks analyzed in this study have been subjected to low grade metamorphism, but this is not expected to have altered the rare
earth distributions in any way. Hence, the equivalent metamorphic rock names are not used. A detailed description of sampling locations is given in the appendix. Fig. 2.1 shows the areas sampled.
The Eastern Goldfields Province
The oldest sediments analyzed in this study are those of the Kalgoorlie area of the Eastern Goldfields Province in the Yilgarn Block of Western Australia. The stratigraphy of the area has been discussed by Woodall (1965), Williams (1970), Travis et al. (1971), and Glikson (1971a). The region is composed of metamorphosed volcanics and sediments, which are enclosed by granites and granitic gneisses. The volcanics include ultra-mafic, mafic, and felsic rocks, and the sediments include greywackes, shales, and quartzites. The Province is considered to be Archaean in age (Compston and Arriens, 1968). It is part of what is usually referred to as a granite-greenstone terrain, and is similar to other Archaean granite-greenstone terrains in South Africa and North America (Anhaeusser, 1971a). These are among the oldest recognizable features on the earth’s surface, and understanding them is a key factor in understanding the origin and evolution of the continents.
15
Canning Basin
Mt. Isa Group
A ma d e u s Basin
Carnarvon Basin
Eastern Gold fields
Tarr.worth Trough
(Baldwin Formation) ;P
J
Perth Basin
State Circle Shale
-24 V
128 140
Coolgardie and Kalgoorlie has been well documented by Glikson (1971a) . Part of the sedimentary sequence in this area (the Mungari Beds) has been intruded by the Mungari Granite (Glikson 1971a). Rb-Sr dating of the Mungari Granite places a lower age limit of 2620 + _ 20 million years on the Mungari Beds (Compston and Turek, 1973). Sedimentary units sampled include the Mungari Beds, the Black Flag Beds (Woodall,
1965), and unnamed units which probably correspond to the Association IV- of Williams (1970). Ten Archaean samples from the Kalgoorlie area were analyzed. The major element chemistry of these samples is listed in Table 2.1. The samples were classified as follows. Kill is a
siliceous shale. KH21 is a high-alumina shale. KH30 is a dolomitic shale. KH32 and KH37 are shales, and both contain a very high silt content. KH36 is a subgreywacke. KH38 is an iron rich shale, and KH47 is a potassic shale. KH41 is a siliceous siltstone. KH44 is a greywacke. Most of the shales show enough recrystallization and fissility to be termed argillites or slates. Although many of the shales are nearly black in colour, they are probably not carbonaceous shales as defined by Pettijohn (1957).
Mount Isa Group
T abl e 2 . 1 Ma j o r e l e m e n t che mi str y o f Arch ae a n se dim en ts fr om t h e Kal go o rl i e a r e a 17
00 LO OO to oo to o i— l CM o to
r^ CM C'- LO ■cT LO to LO O o o 03
. . • . . • . . • • • •
X i— t o i— i o 1— t CM M3 o o r-- oo
NS M3 t-H 03
r^ oo M3 H 03 00 LO LO CM LO to 03
to c- o M3 rH MO 03 o o CM LO
• . . . • • • • . • • •
X o CM oo CM rH iH rH o o MO 03
X MO T—I 03
o '3- LO 00 r- to 03 rH LO 03
l— i o CM to 03 MO o O o o LO 03
. . • • • . • • 1 • • •
X oo o "vj- 03 O o O to o CM 03
NS r-- 1— 1 03
M3 o o •cf to o 00 CM 00
00 to 'tt rH O CM LO rH o o M3 03
to . . • • • • • • • • • •
X o rH MO iH o o CM o o o
NS LO i— l rH H o
rH
M3 o 03 tH MO o CM LO rH LO CM
03 LO O MO iH to CM o o rH LO
to • • • • • • • • • • • •
X M> o CM <73 O o o to o o r- o
N S MO rH o
iH
LO tH CM to to MO •Cf rH to LO
c-M3 i—i LO MO o o CM 00 o o o 03
to . • . • • • • • • • • •
X LO o CM rH o O to o o CM 03
N S c- rH 03
to r". CM O oo oo CM 00 rH M3 LO
CM MO ' to O rH to o rH rH
to . • • . . . • • 1 • • .
X o MO iH o o rH to o to o
N S r-~ l— t o
iH
CM C- rH 03 MO 00 CM CM oo o 03
o i— i to 03 CM to o LO MO Hj- o oo LO
to . . . • • . . • • • • •
X 03 o oo 00 oo CM o O o o o 03
N S to rH CM 03
LO o to OO C-- MO 'tt 03 1— 1 LO rH 03
rH c- 00 1— 1 C'- O MO CM o o to CM
CM • • . .
.
• • • . • • •X MO o CM o o o o -3- o o to 03
NS M3 CM 03
O lH 03 MO 03 C3
c-t“H
T* LO MO iH LO H CM LO o CM LO
5 LO O M3 CM o o o iH
1
o CM 03
00 03
c C O
* O *H
to to 4-> r-H
CM CM O o o LO t/3 *H 03
o O CM CM o o CM o o o </) c +-> •H •H r— t <13 <30 03 «3 CM c CM O <30 O
CO H < X U N S 2 X ►J *iH H T
The stratigraphy of the Mt. Isa Group from youngest to oldest formation is: Magazine Shale; Spear Siltstone, Kennedy Siltstone; Urquhart Shale; Native Bee Siltstone; Breakaway Shale; and Moondarra Siltstone. The group has enormous economic importance, since it is one of the world's largest known deposits of base metals. The Urquhart Shale contains all the known economic mineralization, but the whole group has been closely studied by mining company geologists. A geochemical study of the group has been made by Smith and Walker (1971).
One sample each of the Magazine Shale, Spear-Kennedy Siltstone, Native Bee Siltstone, and Breakaway Shale was analyzed in this study. The samples were supplied by Mt. Isa Mines Ltd., and were all core samples taken from depths ranging from 340 to 2900 ft. The major element chemistry of these samples is listed in Table 2.2. Examination of thin sections of these samples, and consideration of their major element chemistry leads to the following classifications. Mil is a siliceous shale. MI2 is a dolomitic siltstone. MI4 and MI5 are shales. Mil and in particular MI4 have high Na^O/K^O ratios, which is sometimes considered as evidence for a low degree of chemical
maturity.
Amadeus Basin
Upper Proterozoic sediments from the Amadeus Basin, Central Australia were chosen to complete the suite of Precambrian samples. The geology of the area has been described by Wells et a l . (1967). The crystalline rocks of the Arunta complex are overlain by a thick sedimentary sequence in the Amadeus Basin. The age of the rocks of the Arunta complex is uncertain, but is probably at least 1600 million years as deduced from a summary of age data on intruding granites
Ta ble 2 . 2 Ma jor e l e m e n t c h emi st ry o f M i d d l e Protero zo ic se di me n ts of t h e M t . I s a Gr o u p 19
VO LO o t-H MO co o CT) o CO oo
in co LO MO o to CM
KH . • • . • • • • • • • •
S LO o MO CM o o to o o O'»
vD r—i er»
O cn LO 00 00 o o 00 M0 00 O o
CO to CT) rt oo r^ 00 O tH
• • • • . • • « • • • «
2 CT> o to to rH o tH CM o o LO o
vO rH o
rH
LO MO i—t LO CM MO oo LO LO o
1— 1 CM O'! o CO o to to 1— 1 cn co
KH
S vO o MO C\1 CM to o o o to o
LO tH rH o
rH
r- LO o MO '3" r-- o tH 00 MO
rH CT> 00 CM M" to rH M0 o CM to MO
HH . • • • • . . • • • . •
2 o o to CM o rH to o o to O
t''- rH o
rH
e c O
•x O *H
to to 4-> rH
CM CM o o o LO CO «H CTj
o o Csl CM O o CM o o o co C +->
•T—( • H rH <D oo d ctf CM a CM O Ö0 O
CO H < P-, 2 u 2 2 £X ►—3 * H E- T
that, but no reliable older age limit has been set. The stratigraphy of the Precambrian sedimentary sequence from oldest to youngest rocks is: Heavitree Quartzite; Bitter Springs Formation; Areyonga
Formation; and Pertatataka Formation. Age data on the succession has been summarized by Compston and Arriens (1968). Shales of the
Pertatataka Formation cored from the Ooraminna No. 1 well have been dated by Rb-Sr at 790 million years. The same age was obtained for cores of the Pertatataka Formation from the Mt. Charlotte No. 1 well. Other shales from uncertain but perhaps higher stratigraphic positions from cores taken from various other wells have given isochrons of about 600 million years. Compston and Arriens (1968) regarded all of these as minimum ages of deposition, but concluded that these shales were not much older than 800 million years. Wells et al. (1967) quoted an
unpublished Rb-Sr age of 1170 million years for shales of the Bitter Springs Formation. Thus, it seems that no very precise dates for deposition of these sediments is available, although for the purposes of this study an age of about 850 million years will be assumed. The Pertaoorrta Group, which overlies the Pertatataka Formation, is consid ered to be Lower Cambrian by Wells et a l . (1967).
Wells et a l . (1967) have suggested that the provenance rocks for the Areyonga and Pertatataka Formations were older basement rocks uplifted during later tectonism. This means that a very large difference may exist between the age of the source rocks and the time of deposition of the sediments. Thus, the ages of the Mt. Isa and Amadeus Basin
sediments with respect to source rocks may be nearly the same.
21
a total of 9 samples. Table 2.3 lists the major element chemistry of these samples. A014 i s ‘a spilite (an altered igneous rock) which was intersected in the Bitter Springs Formation by the Ooraminna No. 1 well. Examination of thin sections and consideration of the chemistry of these samples leads to their classification as follows. A03, A04, and A05 are either subgreywackes or arkoses. Their high MgO contents favour their classification as subgreywackes. A06, A07, A09, A010 and A012 are shales. The amount of sand sized
detritus decreases with the depth from which these samples were taken in the well.
State Circle Shale
A suite of 7 samples from the State Circle Shale, Canberra were analyzed in this study. The geology of the area has been
described by Öpik (1958). The samples were taken from an Australian National University borehole on Camp Hill. The hole reached a total depth of 211 feet. The upper 100 feet of core was oxidized and iron stained, so the samples were taken from the lower 40 feet of core. Samples of the shale from this borehole were dated by Rb-Sr isochron at 445 +_ 7 million years by Bofinger et al. (1970). This places the age of deposition in the Lower Silurian. The samples have been subject to only a very low degree of metamorphism.
Table 2.4 lists the major element chemistry of these samples. The samples show very little variation in major element chemistry.
Examination of thin sections reveals that although the samples are shales, they contain a very high percentage of silt sized particles. This probably accounts for their high SiO^ contents and high SiO^/Al^O^ ratios.
Baldwin Formation
Tamworth-Tabl e 2 . 3 M ajo r e l e m e n t ch emistry o f U pp er P r ote ro zoi c a n d Pal aeozoic sed im e nt s f r o m
00 t"- o o to LO CM rH LO to CM
co r- MD 00 oo CM 00 LO rH rH 00 MD
rH . . • • • . • • . • .
o 00 tH to to t"- CO CM rH o o rH O
< 1— 1 rH O
rH
MD c d MD LO to to CM rH CM LO MD CO CM LO t'- MD r-~ rH rH oo o o CO rH
rH . . . • . . . • . . . .
o m d o o LO to o o CO o o to o
< LO CM o
rH
o. ■*3" 00 CM LO LO 00 rH CM
o CD oo 00 o CD CM CD rH o rH LO
t''-rH . . • • • . . • • • • •
O Cxi o LO rH o o M- o o LO CD
< MD tH CD
to CM p- c d O) o 00 MD rH 00 rH
c d CO r~- LO CM CD m d rH o CO CM
o . • . . • . . • . • • .
< LO o MD CM o o to o o O
MD rH o
rH
LO CM o rH O CM o CM LO MD f". r-^ LO 00 M0 CM 00 CM rH o MD
o • • • » • • • • . • • .
< rH o Tt r^ CM rH o ^r o o MD o
MD rH o
rH
to LO HT o OO LO to CM so M" MD rH M> LO oo n- CD to rH o CM
o • • . • • . . • • • • ♦
< rH o LO to CM o o o MD CD
MD rH CD
c
•H 00 o CM to 00 oo o CM CM t"~ 'Cf '3' m lo O to CM r-" to o o to
a o . . • • • « • • • • • •
C Q < CM o MD CM rH rH o to o o CM O
oo o in rH P CD ' P a
B CM to rH LO "3- oo to CM LO
< •3- CD LO CD oo O MD o rH rH rH
o . . . . • . • . • • » •
CD < t"- o rH CM CM o to o o rH
r C r-~ o
P rH
LO MD LO 00 to LO rH r^ c- rH CM rH tO CM LO 00 r-~ o rH Hf rH o rH MD o
o . • • • . • • • . • . •
< 00 O to o to o o o
MD o
rH e a o
* O *H
to to •P rH
CM CM o o o LO If) *rH aj
o O CM CM o o CM o o o in C P> •H •H rH CD oo a CtJ CM e CM O CxO O
CO H < tu s: CJ 2 PC «Ü o, r-D -H H T
T abl e 2 . 4 Major e l e m e n t chem is try o f P a la e o z oi c s e di m e n ts fr om t h e St a t e Ci rc l e S h a l e 23
00 CO rH CO to l—i "St O) CO CO CO 00 LO b- LO to LO CO LO o CO r—1 1-1 1—1
u • . . . . • • • • • • •
CO LO o lO LO CO o o o o to o
lD t—1 o
1-1
00 CO LO o to t"» LO o CO 1—1 r"- LO lO 1—1 1—1 OO CO to oo CO 1—1 CO •o
CJ • . • • . • • • • • • •
CO LO o lO CO o o to o o to o
\D i—l o
T—1
<o o cn 00 CO LO LO LO LO LO 1—1
LO to o <o LO CO CO rf- CO 1—1 CO to
u • • • • • • • • • • • •
CO LO o LO CO o o o o to o
lO l— i o
1— 1
LO o CO CO T—1 o LO o LO 00 ■o
LO r- LO LO co CO to T— 1 1— 1 CO
c j • . . • • • • • • • • •
CO •'3- o lO lO CO o o o o to O)
lO 1— 1 O)
to 00 CO l— l CO LO cn cr> LO O') o
to o lO to LO LO CO ■'3- lO to 1— 1 o CO
CJ • • • • • • • • • • • •
CO r^ o LO LO CO o o to o o to o
lO 1— 1 o
T—1
■o 1— 1 o LO to to LO to LO LO 00 to
CO to LO CO LO CO to CO <o 1-1 1— 1 CO
u . ■ . • . . • • • • • •
CO LO o LO LO CO o o ■'3- o o to o>
LO 1— 1 cn
o ■'3- LO 'tf LO 1— 1 T—1 ■o o o>
1— 1 o to LO r-~ co o '3' t-H CO 00
CJ . . . . • • . • • . • •
CO LO o LO LO CO o o o o to O)
LO l— l cn
G c o
* O *H
to to 4-> 1— 1
CO CO o o o LO If)"H oj
o o CO CO o o CO o o o m c ■M
•H •H T—H <D bO aj ui CO c CO O bO o
CO < CL, 2 u 2 Cu kJ *h H To
Barraba district, New South Wales. It was concluded that they were volcanic greywackes, which were formed by fast erosion and deposition of andesites. These greywackes are Upper Devonian in age. They were included in this study in order to provide a sample which was formed from a purely volcanic source.
Table 2.5 lists the major element chemistry of the seven samples from the Baldwin Formation used in this study. They were obtained from Dr. B.W. Chappell, and are the same specimens used in his study. Examination of thin sections of these samples clearly establishes their classification as volcanic greywackes.
Canning Basin
Seven samples of Palaeozoic sediments were taken from cores of the Langoora No. 1 well in the Canning Basin, Western Australia. The formations sampled include: Poole (Permian); Grant (Permian); and Laurel (Lower Carboniferous). The detailed stratigraphy is reported by Gardner (1963). The samples were taken from depths ranging from 1900 to 5100 feet. The sedimentary sequence lies over a Precambrian basement schist, which was encountered at 5240 feet by the Langoora No. 1 well. The samples were obtained from the Bureau of Mineral Resources, Canberra.
Table 2.6 lists the major element chemistry of these samples. Classification of the samples by examination of thin sections and major element chemistry is as follows. PL1 and PL6, are shales, and PL7 is a siltstone. PL3, PL4 and PL5 are orthoquartzites, and PL8 is an
arenaceous limestone.
Perth Basin
Palaeozoic and Mesozoic sediments were obtained from cores of the Wool Mulla No. 1 well, Perth Basin, Western Australia. The
T abl e 2 . 5 Ma jo r e l e m en t ch em is t r y o f Pa l a e oz o i c s e dim en ts f r o m t h e Bal dw in Fo rma ti on 25
LO o cn cn rf CM oo '3- c- MO
o LO to rH r H MO cn rH CM LO MO
rH . • • • • • • • • • • •
CQ to rH LO CM rt rf o o O to O
LO rH rH o
rH
Cn Cn CM cn MO o r H rH r H *=t to LO LO to c- 00 LO to to LO rH rH 00 LO
00 . . • • • • • • • • • •
CM 00 o MO MO CM LO LO o o o CM cn
2 LO rH cn
00 oo rH to o MO CM CM cn cn CM
O'* cn CM r- CM rH o O
oo • . . • • • • • • • • •
CM MO o MO c- CM MO o O o to o
2 LO rH o
rH
00 MO to rH rH C- o CM LO r H
to o rH rH to MO CO o to CM CM
oo . • • • • • • • • • • •
CM CM rH o to 00 o O o LO o
2 LO rH tH o
r H
cn 00 LO LO cn r H MO MO *3- MO L0
CM o rH to CM r- CM cn r H CM to to
CO . • • • • • • • • • • •
CM LO rH MO O to to LO o o O to o
2 LO r H rH o
r H
to to MO cn r H o to oo to o O
r - o to LO cn co o *3" LO r H CM LO MO
• • • • • • • • • • • •
CM rH LO rH to LO Ht o o o to O
2 LO rH rH o
rH
to cn vf o cn rH to o r
-MO rH CM MO to cn to rH 00 rH CM cn cn
rH • • • . • • • • • • •
(N rH rH LO LO o o o to i—
2 LO rH r H o
T—
G G O
* O *H
to to 4-> r—
CM CM o o o LO (/) *H Ctj
O O CM CM o o CM o o o Cf) C
4-•H •H rH <D bO Cj Ctj CM G CM O txO C
CO H < Uh 2 LO 2 2 a, ►—3 *H E- T
T abl e 2 . 6 Major e l e m e n t c h emi st ry o f P a lae oz oic s e d i m en ts fr om t h e Canni ng B a s i
n M3 04 o to O ^r r-H oo rH LO O o
oo 04 co 00 03 o rH o o O 03
i-j . . • • • • • • . • • •
Oh o O o o o O' o o o o O o
to to to o
rH
rH 03 03 rH 03 04 to co to rH O' to O' oo O' LO rf O' M3 LO LO o rH 04 LO
-3 . • . • « • . • • • • •
Oh M3 o M3 LO rH O o to o o o
M3 rH o
rH
00 00 O' to M3 to to O' LO o rH rH M3 o M3 M3 C3 oo O' *sf- o rH to to
_4 • . » • • . • • • • • •
Oh rH O LO rH o to o o O' o
vO rH o
rH
04 00 04 00 O 00 to 04 rH to rH
LO cn o 04 03 04 o o •'3- rH o vO O'
hJ . • • • • • • • • • • •
Oh rH o rH o O to o o o o 04 o
03 o
rH
04 M3 rH rH LO 04 O 03
Hj- O' O co 04 04 o o oo o 04 rH
03 • . • • . • • • 1 . • •
Oh M3 o rH O O o o o o O o
03 o
rH
M3 rH to kD oo O' M3 LO rH 04 LO
to rH rH to rH rH o O 04 o O'
03 • . • . . • • . 1 • • •
Oh LO o to o o o o rH o O o
03 o
rH
r-H to M3 rH to O' O' 03 00 to rH LO O' O' oo LO to rH o o o to
03 . • • • • . • • • • • •
Oh to o 00 LO rH o o o o 03
M3 rH 03
c
c o
* O *rH
to to P rH
04 04 o o o LO t/3 -H oj
O o 04 OI o o 04 o o o tn e P
•H •H rH <D bO oJ aJ 04 s 04 O b O O
co H < CLh s CJ 2 2 Cl, i-4 -H E— ■
27
Carynginia (Permian). The sediments overlie a basement of Precambrian metamorphic rocks. Seven samples from this well were analysed.
Table 2.7 lsits their major element chemistry. A classifica tion of these samples was made on the basis of an examination of thin section and their major element chemistry. PW4, PW5, and PW7 are normal shales. PW2 is an arkose. PW8, PW9, and PW10 are subgreywackes.
Carnarvon Basin
Cenozoic and Mesozoic sediments were obtained from the Learmonth No. 2 well in the Carnarvon Basin, Western Australia. The stratigraphy of the Carnarvon Basin was described by Condon (1968), and the detailed
stratigraphy at the well site by Pudowskis (1964). Four core samples were obtained from the Bureau of Mineral Resources, Canberra of the Giralia Calearenite (Eocene); and the Wogatti Sandstone (Lower Cretaceous).
The major element chemistry of these samples is listed in
Table 2.8. Examination of thin sections and major element chemistry leads to the following classifications. CL1 is a calcarenaceous sandstone
containing bright green glauconite. CL2 is a siliceous siltstone containing a large amount of amorphous silica. CL3 is a silty mudstone, with a very high percentage of silt and sand sized detrital quartz. CL4 is an iron rich mudstone containing pisolitic siderite.
Summary
All of the samples are listed in Table 2.9 according to their classification. Of the 54 samples, shales are the most abundant (28) followed by greywackes (8), subgreywackes (7), siltstones (3), quartzites
Tabl e 2 . 7 Major e l e m e n t c h em i s t ry o f Pa la eo z o i c a n d Mesoz oic sed im e nt s f r o m t h e
00 MO CD CD O to CM o CM CM CM to o CM c d to oo o LO oo ■'3- o rH r- rH
r-H . . • . • . • • • . • •
s= c d o LO to rH o o to o o to CD
Oh MO l— 1 CD
OO Ch MO CD 00 CM to LO rH
c d C- MO O 00 r^ rH to o o o
Cu vO CO rH to O o rH CM o o to o
rH o
rH
o LO LO MO to o LO rH t"~ LO 00 o 00 t"- rH 00 00 MO o o LO rH
. • • • • . . . . .
Oh CM o O') CM CM o rH o o LO o
c- o
rH
MO rH c- tH CD to oo CD rH LO 00 00 LO CD rH CD LO MO MO rH r H LO
2 • • • . . . • .
Oh o o O c d o rH o rH CM o o to O
LO rH rH o
rH
MO 00 CM 00 to 00 o LO rH o LO LO to OO o oo MO LO CO CM rH CM LO to
2 . . . • . .
Oh LO o CM 00 rH o o to o O LO CD
LO CM CD
MO c d MO CD O o o CD 00 CD LO rH
Tt 00 CD 00 00 CD CD o rH o \D
2 • . • . . . .
Oh o CM c- rH o O to o o O
LO CM O
rH
CM CM CD to CD to LO to to O CM MO 00 LO i— 1 rH O o o rH LO r-»
Oh to o MO o o o CM o o rH CD
00 CD
£ £ o
* O "H
to to to +-> rH
CM CM o o o LO CO "H £ o o CM CM o o CM O o o LO £ ■P •H ■H rH <U oo ccS CM e CM O W) O
CO H < Oh 2 u Z :z 2 Oh rJ -H H T
T a b le 2 .8 M aj o r e le m e n t c h e m is tr y o f M e s o z o ic a n d Cen oz oic s e d im e n ts fr o m th e 29
vO r-~ LO O ) t o o rH MO t o 0 0 o >
r ^ t o 0 > vO t o rH t o r H o o t o
— 1 . . . • • . . • . • • •
C J CD o o o o o o o o o 1^- o
"d- CM CM o
rH
t " - cr> o o CM t o t o •d- t o t o 0 0 o
t O *d- CO 0 0 LO r H o r H CM o t o CM
. • • • . • • • 1 • • .
u 1—1 LO 1—1 o o o o o MO o
vO CM o
r H
CT> 1 LO rH MO rH o M0 LO r H
CM CM CT) 'Cf r H o 0 0 "d- O LO CM
. . • . 1 . . .
u O'! O cD O o o o o o rH O
OG o
rH
CM vO CM rH rH LO t o rH CM t ^
■d-g rH LO CM 0 0 MO vD t o o ■d- o rH OO lD
• H . . . • . • • . • • • •
ts> u o O CM t o "d" 0 0 rH rH o o 0 0 rH
cd to rH rH o
CQ rH
G
O G
> G O
5-i * O *H
cd t o t o +-> rH
G CM CM O o o LO t/) " H cd
5h o O CM CM O O CM o o o c/> G 4->
cd • H •rH rH CD W) cd cd CM G CM O W) O
u CO E- < Uh s u 2 nc: S CL, r j - H H To
Table 2 Ages and classifications of the sedimentary rock samples
Sample Rock Type Age
Kill shale Archaean
KH21 shale i i
KH30 shale i i
KH32 shale i t
KH36 subgreywacke t i
KH37 shale i i
KH38 shale i t
KH41 siltstone i t
KH44 greywacke i i
KH47 shale i t
Mil shale Middle Proterozoic
MI 2 siltstone i t
MI4 shale i t
MI5 shale i t
AO 12 shale Upper Proterozoic
AO 10 shale i i
A09 shale i i
A07 shale i t
AO 6 shale i i
A05 subgreywacke Cambrian
A04 subgreywacke i t
AO 3 subgreywacke i i
SCI shale Silurian
SC2 shale i t
SC3 shale i t
SC4 shale i t
SC5 shale i t
Table 2.9 (continued)
Sample Rock Type Age
SC8 shale Silurian
M216 greywacke Devonian
M2 77 greywacke » 1
M2 8 2 greywacke i t
M2 8 3 greywacke i t
M2 84 greywacke n
BIO greywacke i t
PL8 arenaceous
limestone
Carboniferous
PL7 siltstone t t
PL6 shale i t
PL5 orthoquartzite Permian
PL4 orthoquartzite t t
PL3 orthoquartzite t t
PL1 shale I t
PW10 subgreywacke t t
PW9 subgreywacke I t
PW8 subgreywacke t t
PW7 shale Triassic
PW5 shale i t
PW4 shale t t
PW2 arkose t t
CL4 mudstone Jurassic
CL3 mudstone u
CL2 siltstone i t
CL1 calcarenaceous
sandstone
. CHAPTER 3
Analytical Methods
Sample crushing
All grinding and mixing operations were done in an agate ball mill. The agate ball and vial were treated with a dilute HF solution to remove all traces of rare earth contamination introduced by polishing operations during their manufacture. This is not a trivial matter, since the manufacturers of agate grinding implements have the undesirable
practice of using rare earth oxides as a polishing compound. The samples were ground for at least 20 minutes (double the normal time), in order to crush the very hard resistate minerals (e.g. zircon) which are common in sediments. This is usually adequate to reduce the particle size to less than 200 mesh.
Mass spectrography
The samples were analysed with an AEI MS7 spark source mass spectrograph. The method has been described by Taylor (1965, 1971), but some recent modifications have been made. Quantitative abundance data were obtained for: Th, U, Hf, Yb, Er, Ho, Dy, Tb, Gd, Eu, Sm, Nd, Pr, Ce, La, Ba, Cs and Y. The method utilizes the rare earth element Lu as an internal standard, so its abundance can not be directly determined. The rare earth Tm suffers a serious interference from a multiple carbon molecule, so its abundance is also not determined. The abundance of both Lu and Tm may be estimated from the rare earth pattern. The rare earth Pm has no stable isotopes, and so it is not detected.
33
The ion beam produced is collected on an Ilford Q-2 photographic plate. Up to 16 graded exposures are spaced across each plate. The
densities of mass lines are determined with a micro-photodensitometer. The photoplates are calibrated by plotting the densities of lines for
isotope pairs against their known abundance ratios. The slope of a line drawn through these points is used as the plate response to incident ions. The density of a mass line is plotted on a vertical Seidel scale, and a line with a slope determined as above is drawn through this point. The intercept of this line with a horizontal log scale is used as the intensity of this line. The ratio of the intensity of a mass line to the intensity of the internal standard line on the same exposure is directly related to element abundance. Calibration of this ratio to elemental abundance is achieved with rock standards such as W-l, G-l, BCR-1 and AGV-1.
The rare earth Lu is an ideal internal standard for the other 176
rare earths. Lu, which is used as the internal standard for high
176 176
exposure levels, has interference from Yb and Hf. This is corrected for by measuring the ' ^ Y b and * ^ H f lines, and converting these to '*'^Yb
176
precision of the method.
Accuracy and precision of the method are dependent upon the total number of exposures used to calculate the abundance of each element, as well as other factors. For this study two photoplates were exposed for each sample, each with about 15 exposures, and deter minations for many elements were based on more than one isotope.
This resulted in the measured abundance of each element being based on 8-20 determinations. The precision obtained for all elements was about +3% expressed as standard error. Results obtained by this technique on standard rocks and lunar samples have been compared with results obtained on the same samples by other well recognized methods. Table 3.1 shows such a comparison made by Taylor et a l . (1973) for a lunar soil sample. This and other comparisons indicate the accuracy of the method is about
+ 10%.
35
Table 3.1 Comparison of trace element
soil sample 15471.
data for Apollo 15 lunar
Element MS71 2345
(ppm)
Other
(ppm) Method Reference
Th 2.38 2.28 ID 2
U 0.61 0.62 ID 2
Hf 5.5 4.5 NA 3
Cs 0.18 0.12 NA 4
La 14.7 13.9 NA 5
Ce 38.4 34.4 NA 5
Nd 24.3 26 NA 5
Sm 6.6 7.1 NA 5
Eu 1.17 1.05 NA 5
Gd 8.2 8.7 NA 5
Tb 1.3 1.5 NA 5
Dy 8.8 10 NA 5
Ho 2.1 2.1 NA 5
Er 5.8 5.4 NA 5
Yb 5.8 5.1 NA 5
Y 54 52 XRF 6
1 Taylor et al., 1973
2 Silver, 1972
3 Wanke et al., 1972
4 Morgan et al., 1972
5 Helmke and Haskin, 1972
Experimental Results Introduction
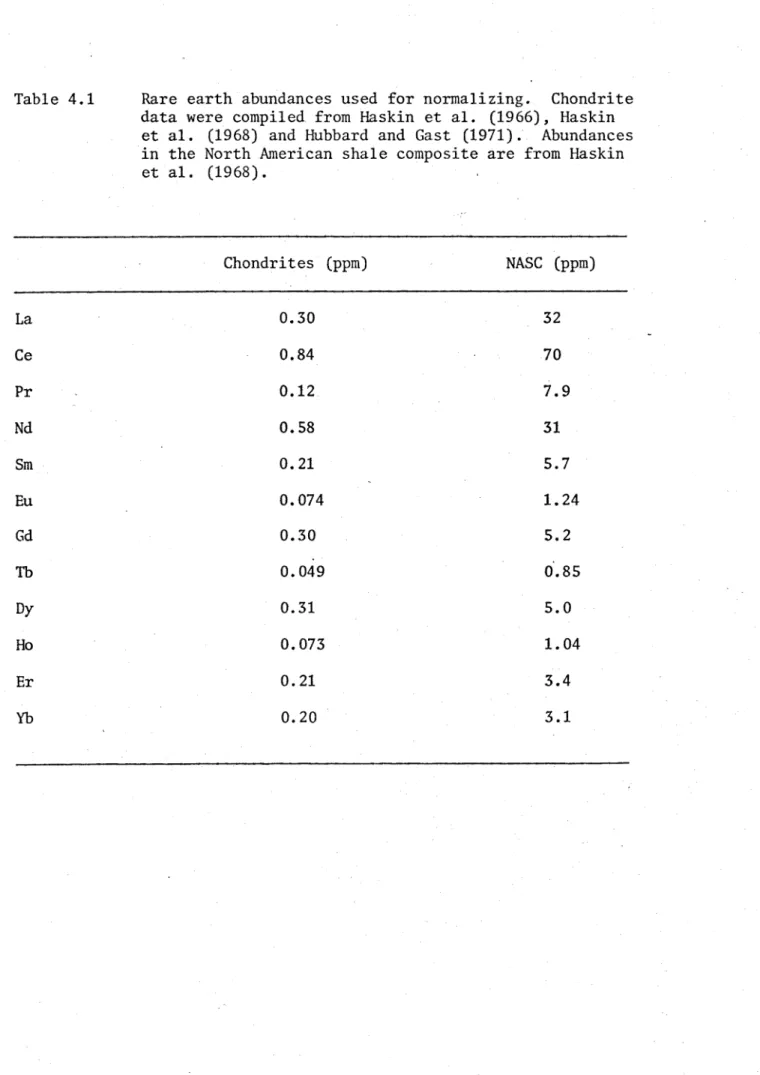
A total of 53 sedimentary rocks were analyzed for Th, U, Hf, La, Ce, Pr, Nd, Sm, Eu, Gd, Tb, Dy, Ho, Er, Yb, Ba, Cs and Y. Major element chemistry and the rock classification of each of these samples were reported in Chapter 2. In this chapter the trace element data are reported. All results are reported on a volatile free basis. The rare earth data are presented normalized to the abundances of those elements in both chondrites and the North American Shale Composite (NASC). Chondrites are assumed to represent the primordial solar abundances of these elements, and perhaps their abundances in the earth as a whole. The rare earth abundances in the NASC are frequently used as an approximation to those in the upper continental crust. The NASC is enriched in the light rare earths relative to the heavy rare earths when compared to chondritic abundances. The NASC is also depleted in Eu relative to the adjacent rare earths (Sm and GD). The values used for rare earth abundances in chondrites and the NASC are listed in Table 4.1.
*
The expression Eu/Eu is the ratio of the measured Eu abundance to that which is calculated for a smooth chondrite normalized rare earth pattern by interpolation between Gd and Sm. Thus, it is a measure of the
depletion or enrichment of Eu relative to the adjacent rare earths in a
*
chondrite normalized distribution pattern. Values of Eu/Eu must differ from unity by an amount greater than normal analytical variation to be considered significant Eu anomalies. For the data presented here, values
•k
37
Table 4.1 Rare earth abundances used for normalizing. Chondrite
data were compiled from Haskin et al. (1966), Haskin et al. (1968) and Hubbard and Gast (1971). Abundances in the North American shale composite are from Haskin et al. (1968).
Chondrites (ppm) NASC (ppm)
La 0.30 32
Ce 0.84 70
Pr 0.12 7.9
Nd 0.58 31
Sm 0.21 5.7
Eu 0.074 1.24
Gd 0.30 5.2
Tb 0.049 0.85
Dy 0.31 5.0
Ho 0.073 1.04
Er 0.21 3.4
ELREE/EHREE ratio of about 1.8, and for the NASC it is 8.0.
Eastern Goldfields Province
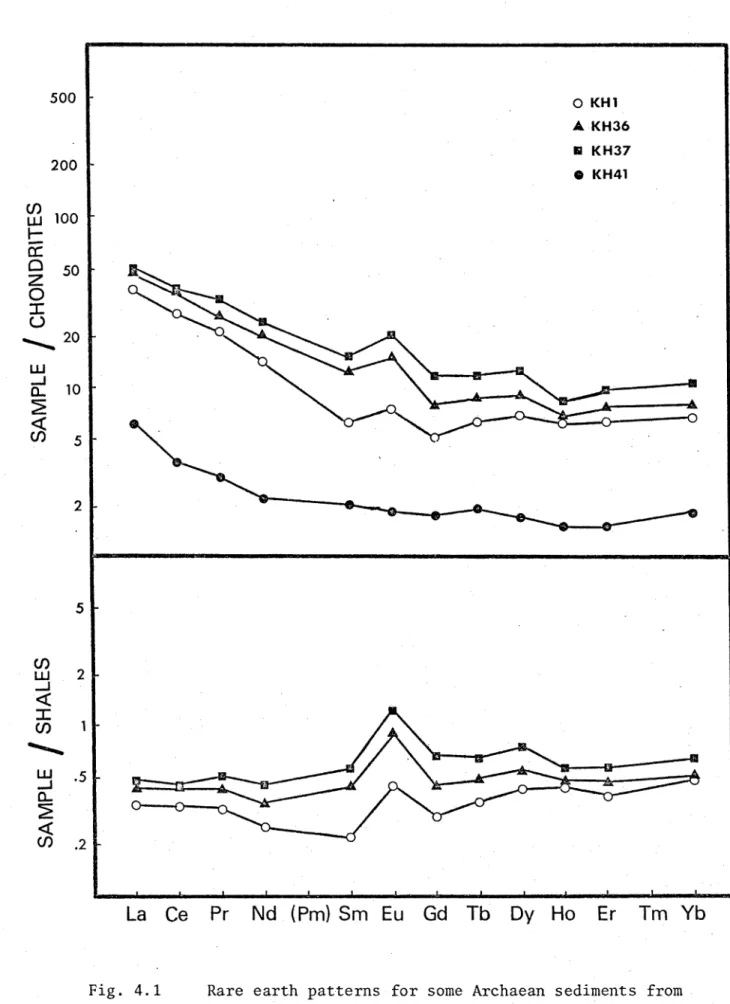
The trace element abundances in the Archaean sediments from the Kalgoorlie area are listed in Table 4.2, along with some important elemental ratios. Figs. 4.1, 4.2, and 4.3 present chondrite and shale normalized rare earth patterns for these samples. Seven of the samples show significant enrichments of Eu relative to chondrites. The
remaining three samples do not have significant enrichments or depletions in Eu relative to chondrites. All of these samples are significantly enriched in Eu relative to the NASC. KH41 has a very low total rare earth abundance (ZREE) of only 9 ppm, and a low ELREE/EHREE of 3.5. The relative rare earth patterns of KH1, KH36, KH37, KH38, KH44, and KH47 are all similar to each other. They are depleted in the lightest rare earths relative to the NASC, with ELREE/EHREE in the range 5.4 - 6.7. EREE range from 53 ppm to 110 ppm, which are considerably lower than EREE for the NASC (166 ppm). KH21, KH30, and KH32 are depleted in the heaviest rare earths relative to the NASC. ELREE/EHREE for these samples ranges from 11 to 18, and EREE ranges from 91 ppm to 162 ppm. The Archaean sediments can thus be divided into two groups
(excluding KH41) on the basis of ELREE/EHREE ratios.
Mt. Isa Group
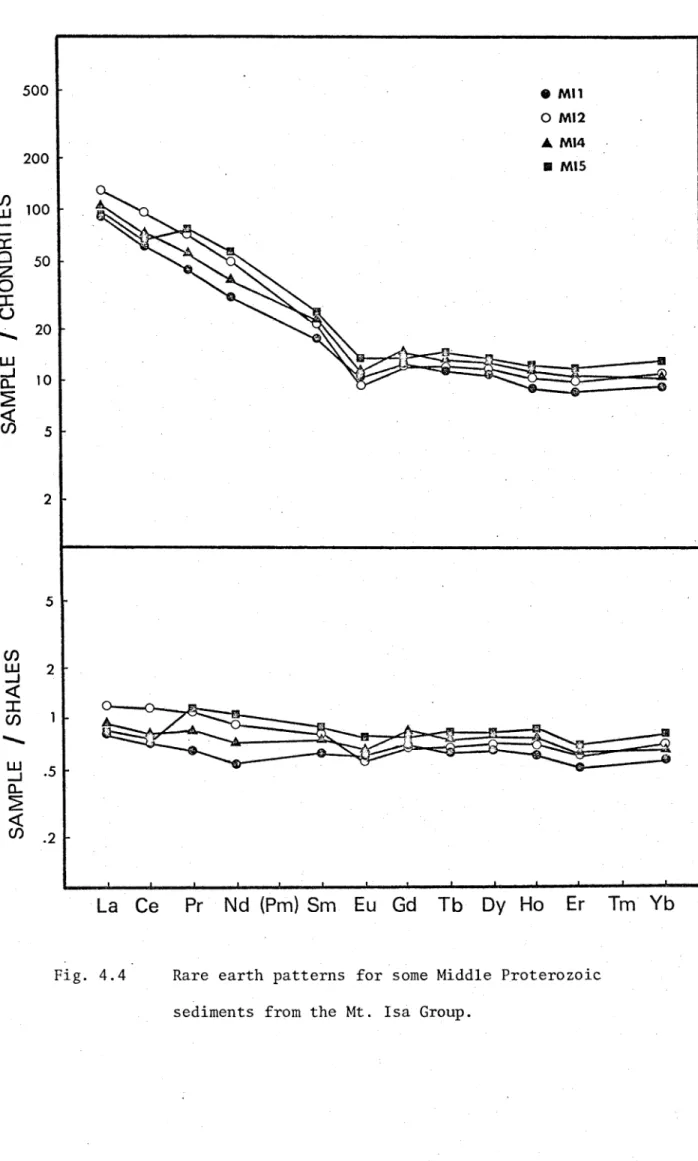
Table 4.3 lists the trace element abundances for the Middle Proterozoic sediments from the Mt. Isa Group. Fig. 4.4 shows the chondrite and shale normalized rare earth patterns for these samples.
All four samples show significant depletions in Eu relative to chondrites, but are nearly normal relative to the NASC. ELREE/EHREE ranges from 9.0