congruence across competing reconstructions of the neoavian explosion
.
White Rose Research Online URL for this paper:
http://eprints.whiterose.ac.uk/143199/
Version: Published Version
Article:
Franz, N.M. orcid.org/0000-0001-7089-7018, Musher, L.J.
orcid.org/0000-0003-3490-0341, Brown, J.W. orcid.org/0000-0002-3835-8062 et al. (2
more authors) (2019) Verbalizing phylogenomic conflict: Representation of node
congruence across competing reconstructions of the neoavian explosion. PLoS
Computational Biology, 15 (2). e1006493. ISSN 1553-734X
https://doi.org/10.1371/journal.pcbi.1006493
[email protected] https://eprints.whiterose.ac.uk/ Reuse
This article is distributed under the terms of the Creative Commons Attribution (CC BY) licence. This licence allows you to distribute, remix, tweak, and build upon the work, even commercially, as long as you credit the authors for the original work. More information and the full terms of the licence here:
https://creativecommons.org/licenses/
Takedown
If you consider content in White Rose Research Online to be in breach of UK law, please notify us by
Verbalizing phylogenomic conflict:
Representation of node congruence across
competing reconstructions of the neoavian
explosion
Nico M. FranzID1*, Lukas J. MusherID2, Joseph W. BrownID3, Shizhuo Yu4,
Bertram Luda¨scher5
1School of Life Sciences, Arizona State University, Tempe, Arizona, United States of America,2Richard Gilder Graduate School and Department of Ornithology, American Museum of Natural History, New York, New York, United States of America,3Department of Animal and Plant Sciences, University of Sheffield, Sheffield, United Kingdom,4Department of Computer Science, University of California at Davis, Davis, California, United States of America,5School of Information Sciences, University of Illinois at Urbana-Champaign, Urbana-Champaign, Illinois, United States of America
Abstract
Phylogenomic research is accelerating the publication of landmark studies that aim to resolve deep divergences of major organismal groups. Meanwhile, systems for identifying and inte-grating the products of phylogenomic inference–such as newly supported clade concepts– have not kept pace. However, the ability toverbalizenode concept congruence and conflict across multiple, in effect simultaneously endorsed phylogenomic hypotheses, is a prerequi-site for building synthetic data environments for biological systematics and other domains impacted by these conflicting inferences. Here we develop a novel solution to the conflict ver-balization challenge, based on a logic representation and reasoning approach that utilizes the language of Region Connection Calculus (RCC–5) to produce consistentalignmentsof node concepts endorsed by incongruent phylogenomic studies. The approach employs clade concept labels to individuate concepts used by each source, even if these carry identi-cal names. Indirect RCC–5 modeling ofintensional(property-based) node concept defini-tions, facilitated by the local relaxation of coverage constraints, allows parent concepts to attain congruence in spite of their differentially sampled children. To demonstrate the feasibil-ity of this approach, we align two recent phylogenomic reconstructions of higher-level avian groups that entail strong conflict in the "neoavian explosion" region. According to our repre-sentations, this conflict is constituted by 26 instances of input "whole concept" overlap. These instances are further resolvable in the output labeling schemes and visualizations as "split concepts", which provide the labels and relations needed to build truly synthetic phyloge-nomic data environments. Because the RCC–5 alignments fundamentally reflect the trained, logic-enabled judgments of systematic experts, future designs for such environments need to promote a culture where experts routinely assess the intensionalities of node concepts pub-lished by our peers–even and especially when we are not in agreement with each other.
a1111111111 a1111111111 a1111111111 a1111111111 a1111111111 OPEN ACCESS
Citation:Franz NM, Musher LJ, Brown JW, Yu S, Luda¨scher B (2019) Verbalizing phylogenomic conflict: Representation of node congruence across competing reconstructions of the neoavian explosion. PLoS Comput Biol 15(2): e1006493. https://doi.org/10.1371/journal.pcbi.1006493
Editor:Sergei L. Kosakovsky Pond, Temple University, UNITED STATES
Received:December 13, 2017
Accepted:September 10, 2018
Published:February 15, 2019
Copyright:©2019 Franz et al. This is an open access article distributed under the terms of the Creative Commons Attribution License, which permits unrestricted use, distribution, and reproduction in any medium, provided the original author and source are credited.
Data Availability Statement:Data files related to the manuscript are available directly as Supporting Information and have also been deposited at this linkhttps://doi.org/10.5061/dryad.8206227.
Funding:Support for NMF research on this manuscript (as PI): National Science Foundation;
award DEB-1155984;https://nsf.gov/awardsearch/
showAward?AWD_ID=1155984National Science
Foundation; award DBI-1342595;https://www.nsf.
Author summary
Synthetic platforms for phylogenomic knowledge tend to manage conflict between differ-ent evolutionary reconstructions in the following way: "If we do not agree, then it is either our view over yours, or we just collapse all conflicting node concepts into polytomies". We argue that this is not an equitable way to realize synthesis in this domain. For instance, it would not be an adequate solution for building a unified data environment where authors can endorse and yet also reconcile their diverging perspectives, side by side. Hence, we develop a novel system forverbalizing–i.e., consistently identifying and aligning–incon-gruent node concepts that reflects a more forward-looking attitude: "We may not agree with you, but nevertheless weunderstandyour phylogenomic inference well enough to
expressour disagreements in a logic-compatible syntax. We can therefore maximize the translatability of data linked to our diverging phylogenomic hypotheses". We show that achieving phylogenomic synthesis fundamentally depends on the application of trained expert judgment to assert parent node congruence in spite of incongruently sampled children.
Introduction
Three years ago, Jarvis et al. (2014; henceforth 2014.JEA) [1] published a landmark reconstruc-tion of higher-level bird relareconstruc-tionships. Within 12 months, however, another analysis by Prum et al. (2015; henceforth 2015.PEA) [2] failed to support several of the deep divergences recov-ered in the preceding study, particularly within the Neoaves sec. (secundum= according to) Sibley et al. (1988) [3]. Thomas (2015) [4] used the term "neoavian explosion" to characterize the lack of congruence between inferences of early-diverging lineages (see also [5]). Similarly, after reviewing six phylogenomic studies, Suh [6] concluded that the root region of the Neoaves constitutes a "hard polytomy". Multiple analyses have dissected the impact of differen-tial biases in terminal and genome sampling, as well as evolutionary modeling and analysis constraints, on resolving this complex radiation [7,8,9]. Suh [6] argues that a well resolved consensus is not imminent (though see [10]). Brown et al. (2017) [11] analyzed nearly 300 avian phylogenies, finding that the most recent studies "continue to contribute new edges".
These recent advancements provide an opportunity to reflect on how synthesis should be realized in the age of phylogenomics [11,12,13]. The neoavian explosion can be considered a use case where multiple studies provide strong signals for conflicting hierarchies. Resolution towards a single, universally adopted tree is unlikely in the short term.
Rather than focusing on the analytical challenges along the path towards unitary resolution [9], we turn to the issue of how the persistence of conflict affects the design of synthetic data infrastructures. In other words, how do we build a data service for phylogenomic knowledge in the face of persistent conflict? This question is of broad relevance to systematists, compara-tive evolutionary biologists, and designers of biological information services interested in robust, reproducible, and reusable phylogenomic data. And it turns on the issue of improving identifiers and identifier-to-identifier relationships for this domain.
Particularlyverbalrepresentations of the neoavian explosion are not well designed for con-flict representation and synthesis [14]. To alleviate this, some authors use tree alignment graphs in combination with color and width variations to identify regions (edges) of phyloge-nomic congruence and conflict [15]. Other authors may show multiple incongruent trees side-by-side, using color schemes for congruent clade sections [9]. Yet others may use tanglegrams postdoc): National Science Foundation; award
DEB-1207915;https://www.nsf.gov/awardsearch/
showAward?AWD_ID=1207915Support for BL research on this manuscript (as PI): National
Science Foundation; award IIS-1118088;https://
www.nsf.gov/awardsearch/showAward?AWD_ID= 1118088National Science Foundation; award
DBI-1147273;https://www.nsf.gov/awardsearch/
showAward?AWD_ID=1147273The funders had no role in study design, data collection and analysis, decision to publish, or preparation of the manuscript.
that are enhanced to highlight congruence [4], rooted galled networks [16] or neighbor-net visualizations [17] that show split networks for conflicting topology regions, or simply provide a consensus tree in which incongruent bifurcating branch inferences are collapsed into polyt-omy [6].
Verbalizing phylogenomic congruence and conflict in open, synthetic knowledge environ-ments [13] constitutes a novel challenge for which traditional naming solutions in systematics are inadequate. The aforementioned studies implicitly support this claim. All use overlapping sets of Code-compliant [18] and other higher-level names in the Linnaean tradition, with sources including [19] or [20]. To identify these source-specific name usages, we will utilize thetaxonomic concept labelconvention of [14]. Accordingly, name usages sec. 2014.JEA are prefixed with "2014.", whereas name usages sec. 2015.PEA are prefixed with "2015."
We diagnose the verbalization challenge as follows. (1) In some instances, identical clade names are polysemic–i.e., have multiple meanings–across studies. For instance, 2015.Pelecani-formes excludes 2015.Phalacrocoracidae, yet 2014.Pelecani2015.Pelecani-formes includes 2014.Phalacrocora-cidae; reflecting on two incongruent meanings of "Pelecaniformes". (2) In other cases, two or more non-identical names have congruent meanings, e.g., 2015.Strisores and 2014.Caprimul-gimorphae. (3) Names that are unique to just one study–e.g., 2015.Aequorlitornithes or 2014. Cursorimorphae–are not always reconcilable in meaning without additional human effort, thereby adding an element of referential uncertainty to the apparent conflict. (4) Lastly, many of the newly inferred and conflicting edges are not named at all. There is an implicit preference for labeling edges when suitable names are already available. However, unnamed edges can create situations where conflict cannot be verbalized and reconciled in a data environment, due to the lack of syntactic structure ("names").
Jointly, the effects of polysemic names, synonymous names, exclusive yet hard-to-reconcile names, and conflicting unnamed edges are symptomatic of an information culture that is not ready for the identifier and identifier-to-identifier relationship challenges inherent in repre-senting phylogenomic conflict. Suppose we wish to build a collaborative knowledge environ-ment towards inferring "the tree of life" (though see [12]). The design should allow us to individually represent and at the same integrate conflicting hierarchies, from the tips to the root. The system should respond to name-based data queries across these hierarchies, and return whether they are congruent or how they conflict in meaning. Clearly, the name usages of each individual source are not suited for this integration task. Traditional, Linnaean con-ventions allow for names to have evolving phylogenomic meanings across hierarchies and are therefore too under-powered for our purpose [21].
At root, this is a novelconceptualchallenge for systematics and comparative evolutionary biology, made imperative by the accelerated generation and ingestion of phylogenomic trees into open, dynamic knowledge bases for reliable integration and re-use [11,13,22,23,24]. The services that such environments aspire to provide require an appropriate theory ofnode identity, and hence a conception of multi-node congruence or incongruence across individual trees and entire synthesis versions.
Here we propose a solution to the phylogenomic conflict representation challenge. This solution requires collaboration between systematic experts, platform designers, and users of phylogenomic information. It is an extension of prior "concept taxonomy" research [14,25,
a novel answer to our central question: "how to build a synthetic knowledge environment in the face of persistent phylogenomic conflict?" The discussion focuses on the feasibility and desirability of creating such an integration service, emphasizing the role of trained expert judg-ment in providing them [30].
Methods
Syntactic and semantic conventions
1. Taxa are models, concepts are mimics.We typically refrain from using the terms "taxon", "taxa", or "clade(s)". We take taxa to constitute evolutionary, causally sustained entities whose members are manifested in the natural realm. The task for systematics is to successively approximate the identities and limits of these entities. Thus, we assign the status of ’models’ to taxa, which systematists aim to ’mimic’ through empirical theory making. This perspective allows for realism about taxa, and also for the possibility to let our representationsstand for
taxa [31], at any given time and however imperfectly, to support evolutionary inferences. In reserving a model status for taxa, we can create a separate design space for the human theory- and language-making domain. In the latter, we speak only of taxonomic or phyloge-nomicconcepts–the products of inference making [21].
2. Sameness is limited to the same source.Therefore, for the purpose of aligning the neoa-vian explosion use case, we need not speak of the "same taxa" or "same clades" at all. Similarly, we need not judge whether one reconstruction or the other more closely aligns with deep-branching avian taxa, i.e., which is (more) ’right’? Instead, our alignment is only concerned with modeling congruence and conflict across two sets ofconcepthierarchies. The concepts arelabeledwith the "sec." convention to maintain a one-to-one modeling relationship between concept labels and concepts (clade identity theories). Accordingly, there is also no need to say that, in recognizing each a concept with the taxonomic name Neornithes, the two author teams are authoring "the same concept". Instead, we model the two labels 2015.Neornithes and 2014.Neornithes, each of which symbolizes an individually generated phylogenomic theory region. As an outcome of our alignment, we may say that these two concepts arecongruent, or not, reflecting the intensional alignment (to be specified below) of two phylogenomic theories. But, by virtue of their differential sources (authorship provenance), the two concepts 2015. Neornithes and 2014.Neornithes are never "the same". "Sameness" is limited in our approach to concepts whose labels contain an identical taxonomic nameandwhich originate from a sin-gle phylogenomic hierarchy and source. That is, 2015.Neornithes and 2015.Neornithes are (labels for) the same concept.
Knowledge representation and reasoning
The methods used herein are consistent with [14,26,32]. They utilize three core conventions: (1) taxonomic concept labels to identify concepts; (2)is_arelationships to assemble single-source hierarchies via parent/child relationships; and (3) RCC–5 articulations to express the relative congruence of concept regions across multi-sourced hierarchies. The RCC–5 articula-tion vocabulary entails (with corresponding symbol): congruence (= =), proper inclusion (>), inverse proper inclusion (<), overlap (><), and exclusion (!).Disjunctionsof these articula-tions are a means to express uncertainty; as in: 2015.Neornithes {= =or>or<} 2014.Neor-nithes. All possible disjunctions generate a lattice of 32 relationships (R32), where the "base five" are the most logically constraining subset [33].
needed for modeling tree hierarchies, these input constraints are then submitted to a logic rea-soner that provide two main services. First, the rearea-soner infers whether all input constraints are jointly logically consistent, i.e., whether they permit at least one "possible world". Second, if consistency is attained, the reasoner infers the set ofMaximally Informative Relations(MIR). The MIR constitute that unique set of RCC–5 articulations for every possible concept pair across the input sources from which the truth or falseness of any relationship in the R32lattice can be deduced [14,26,33]. Many toolkit options and functions are designed to encode vari-able alignment input and output conditions, and to interactively obtain adequately constrained alignments. The toolkit also features a stylesheet-driven alignment input/output visualization service that utilizes directed acyclical graphs [28]. A step-wise account of the user/toolkit work-flow interaction is provided in [26].
Special challenges for multi-phylogeny alignments
Aligning phylogenomic trees entails several special representation and reasoning challenges. We address three aspects here that have not been dealt with extensively in previous
publications.
1. Representing intensional parent concept congruence via locally relaxed coverage.The first challenge relates directly to the issue of parent node identity. Unlike comprehensive classi-fications or revisions [14,26,34], phylogenomic reconstructions typically donotaspire to sam-ple low-level entities exhaustively. Instead, select exemplars are samsam-pled among all possible low-level entities. The aim is to represent lower-lever diversity sufficiently well to infer reliable higher-level relationships. Often, terminal sampling is not only incomplete for any single reconstruction, but purposefully complementary to that of other analyses. Generating infor-mative genome-level data remains resource-intensive [10]. This makes it prudent to coordi-nate terminal sampling globally, by prioritizing the reduction of gaps over redundant terminal sampling. In the case of 2015.PEA (198 terminals) versus 2014.JEA (48 terminals), only 12 spe-cies-level concept pairs have labels with identical taxonomic names.
By default, the logic toolkit applies acoverage constraintto every input concept region. Cov-erage means that the region of a parent is strictly circumscribed by the union of its children [35]. However, this constraint is relaxable, either globally for all concepts, or locally for select concepts. To relax coveragelocally, the prefix "nc_" (no coverage) is used in the input, as in 2014.nc_Psittacidae. This means:eithera parent concept’s referential extension is circum-scribed by the union of its explicitly included children,orthere is a possibility of additional children being subsumed under that parentbut not mentionedin the source phylogeny. Either scenario can yield consistent alignments. In other words, if a parent concept has relaxed cover-age, it can attain congruence with another parent concept in spite of each parent having incon-gruent sets of child concepts.
Managing coverage in the toolkit input is not trivial. Relaxing coverage globally is akin to saying "anything goes", i.e., any parent could potentially include any child. This would yield innumerable possible worlds, and therefore has no value for our purpose. On the other hand, applying coverage globally means–counter-intuitively in the case of phylogenomic trees–that only parents with completely congruent sets of children can themselves attain congruence. The challenge for experts providing the input is thus to relax coveragelocally, and strictly in the service of ’neutralizing’ lower-level sampling differences between trees that should not yield conflict at higher levels.
Nestor is redundantly sampled, yet with the articulation: 2015.Nestor_meridionalis ! 2014.Nes-tor_notabilis at the child level. Therefore, if no species-level concept sec. 2015.PEA has an explicitly sampled and congruent region in 2014.Psittaciformes, and, vice-versa, no species-level concept sec. 2014.JEA has such a region in 2015.Psittaciformes, then under global appli-cation of the coverage constraint we obtain the alignment: 2015.Psittaciformes ! 2014.Psittaci-formes (Fig 2). The absence of even partial concept region overlap at the terminal level ’propagates up’ to the highest-level parent concepts, which are therefore also exclusive of each other.
[image:7.612.43.576.78.180.2]Asserting higher-level node congruence in light of lower-level node incongruence requires a conception of node identity that affirms counter-factual statements of the following type: if 2014.JEA had sampled 2014.Psittacus_erithacus, then the authors would have included this species-level concept as a child of 2014.Psittacidae. This is to say that 2015./2014.Psittacidae, and hence their respective parents, areintensionallydefined [25,36,37].
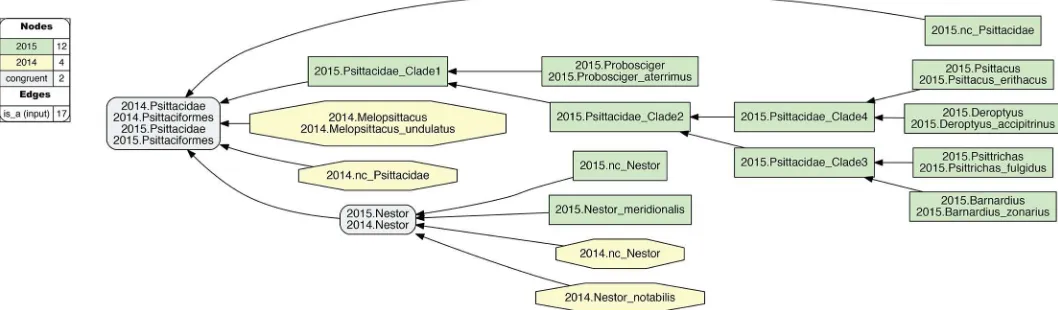
Fig 1. Input visualization for the 2015./2014.Psittaciformes alignment, with coverage globally applied.In all toolkit visualizations, the input and aligned, non-congruent concepts sec. 2015.PEA are shown as green rectangles (T2−18 concepts). Input and aligned, non-congruent concepts sec. 2014.JEA are shown as yellow
octagons (T1−6 concepts). Congruent sets of aligned, multi-sourced concepts (first shown inFig 4) are rendered in gray rectangles with rounded corners. In this input
visualization, each phylogenomic tree is separately assembled via parent/child (is_a) relationships (solid black arrows). All species-level concepts sec. 2015.PEA and 2014.JEA are exclusive of each other. Under strict application of the coverage constraint, this is represented by asserting eight articulations (dashed magenta arrows) of disjointness (!) of each species-level concept from the other-sourced order-level concept. The legend indicates the numbers of nodes and edges for each input tree, parent/child relationships, and expert-asserted input articulations. See alsoS1 File.
https://doi.org/10.1371/journal.pcbi.1006493.g001
Fig 2. Alignment visualization for the 2015./2014.Psittaciformes alignment, with coverage globally applied.This alignment corresponds to theFig 1input, and shows reasoner-inferred non-/congruent concepts and articulations (see legend)–i.e., none in this particular case. The reasoner infers 108 logically implied articulations that constitute the set of MIR. See alsoS2 File. Although the input and alignment of Figs1and 2 are empirically defensible, they fail to capture certain intuitions we have regarding the higher-level 2015./2014.Psittaciformes relationship. For instance, we may wish to say: "Sure, the author teams sampled complementary species-level concepts. Yet these trees are not actually in conflict. At higher levels, there likely is agreement that parrots are parrots, and non-parrots are non-parrots". That is: 2015. Psittaciformes = = 2014.Psittaciformes. To obtain this intuitive alignment, we have tolocallyrelax coverage at select lower levels (Fig 3). In particular, 2015.PEA include five genus- and species-level concepts under 2015.Psittacidae that have no corresponding region under 2014.Psittacidae. However, if we relax coverage for 2014. Psittacidae–i.e., we assert 2014.nc_Psittacidae as an input constraint–then we can include each of these; for instance: 2015.Probosciger_aterrimus<2014.Psittacidae,
2015.Psittacus_erithacus<2014.Psittacidae, etc. Conversely, if we locally relax coverage for 2015.Psittacidae (2015.nc_Psittacidae), we can specify 2014.
Melopsittacus_undulatus<2015.Psittacidae. At the genus level, we can align 2015.Nestor = = 2014.Nestor if we relax coverage for each (2015.nc_Nestor, 2014.
nc_Nestor), in spite of the mutually exclusive species-level concepts sampled. Jointly, thesefourinstances of relaxing coverage render the articulation 2015.Psittacidae = = 2014.Psittacidae consistent, and hence also 2015.Psittaciformes = = 2014.Psittaciformes (Fig 4).
[image:7.612.39.576.466.577.2]Using a combination of published topological information (and support), more or less direct reiterations of phenotypic traits (cf. discussions and supplementary data of 2015.PEA and 2014.JEA), and trained judgment [30], we align these concept regions as if there are con-gruentpropertycriteria that each region entails, i.e., something akin to an implicit set of synap-omorphies or uniquely diagnostic features. Of course, the phylogenomic data provided by 2015.PEA and 2014.JEA do not signal intensional definitions directly. But neither do their genome-based topologies for parrots provide evidence to challenge the status of such defini-tions as previously proposed [38]. In addition, particularly 2015.PEA (supplementary informa-tion; sections on "detailed justification for fossil calibrations" and "detailed phylogenetic discussion; pp. 3–21) provide a provide an in-depth account of how their preferred topology relates to published, property-centered circumscriptions of dozens of higher-level clade
Fig 4. Alignment visualization for the 2015./2014.Psittaciformes alignment, with coverage locally relaxed.Compare withFig 2. Local relaxing of coverage, and assertions of congruence of paired higher-level concepts (Fig 3), will yield the intuitive alignment of 2015.Psittaciformes = = 2014.Psittaciformes, 2015.Psittacidae = = 2014.Psittacidae, and 2015.Nestor = 2014.Nestor; in spite of wholly incongruent sampling of species-level concepts. The reasoner infers 160 logically implied articulations that constitute the set of MIR. See alsoS4 File.
[image:8.612.45.574.498.653.2]https://doi.org/10.1371/journal.pcbi.1006493.g004
Fig 3. Input visualization for the 2015./2014.Psittaciformes alignment, with coverage locally relaxed.Compare withFig 1. Here, coverage is relaxed for two family-level concepts (2015./2014.nc_Pittacidae) and two genus-family-level concepts (2015./2014.nc_Nestor). The eight species-family-level concepts of the alignment are correspondingly included as members of these higher-level concepts. In addition, three instances of congruence are asserted for 2015./2014.{Psittaciformes, Psittacidae, Nestor}. See also
S3 File.
concepts. We have to assume, fallibly and non-trivially, that such topology-to-synapomorphy relations are also implied by JEA.2014, as reflected (inter alia) in their discussion.
Three clarifications are in order. First, Region Connection Calculus is at best a means of
translatingthe signal of an intensional definition. The congruent (= =) symbol means, only: two regions are congruent in their extension. The RCC–5 vocabulary is obviously not appro-priate for reasoning directly over genomic or phenomic property statements. The reasoner does not assess whether 2015.Psittacidae, or any included child or aligned concept, has ’the rel-evant synapomorphies’. Doing so would not be trivial even if property-based definitions were provided for all higher-level node concepts, because we would still have to make theory-laden assumptions about their congruent phylogenomic scopes [26,39,40]. Second, we are not pro-viding detailed textual narratives that wouldjustifyeach assertion of higher-level congruence. Such narratives are possible, and even needed to understand disagreements, because they explain the reasoning process behind an expert-made assertion. However, our main objective here is to focus on the issue of RCC–5 translation of systematic signals; not on a character-by-character dissection of each congruent articulation. Third, a sensible intensional alignment strategy uses aminimalnumber of instances of locally relaxed coverage in order to compensate for differential child sampling at lower levels, so that parent coverage canremain in placeat higher levels to expose incongruent node concepts. The benefits of this strategy will be shown below.
2. Representing clade concept labels.Our modeling approach requires that every region in each source tree receives a taxonomic or clade concept label. However, the source publica-tions only provide such labels for a subset of the inferred nodes. In particular, 2015.PEA (p. 570:Fig 1) obtained 41 nodes above the ordinal level. Of these, 17 nodes (41.5%) were explicitly labeled in either the published figure or supplement (pp. 9–12). The authors also cite [20] as the primary source for valid name usages, yet that list is not concerned with supra-ordi-nal names. Similarly, 2014.JEA (p. 1322:Fig 1) inferred 37 nodes above the ordinal level, of which 23 nodes (62.2%) were given an explicit label. They provide an account (cf. supplemen-tary materials SM6: 22–24) of their preferred name usages, sourced mainly to [20] and [41].
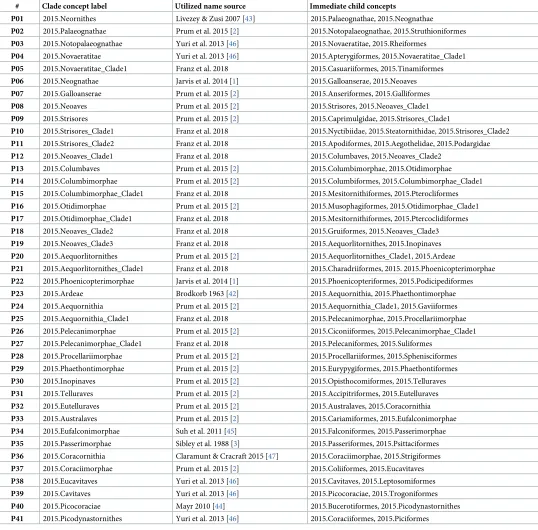
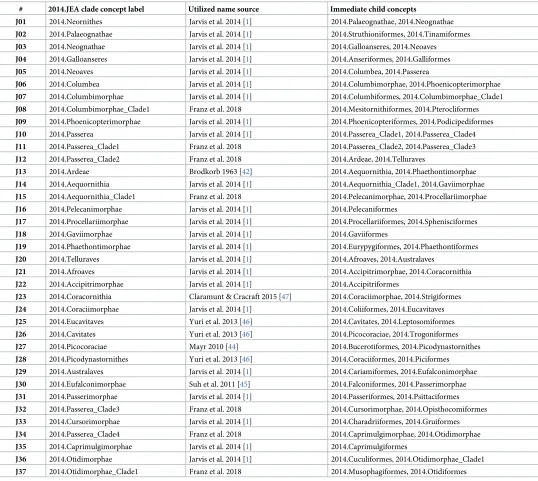
In assigning clade concept labels at the supra-ordinal level when the authors may have failed to do so (consistently), we nevertheless made a good faith effort–through examination of the supplementary information and additional sources [1,3,42,43,44,45,46,47]–to represent the authors’ preferred name usages. Where usages were not explicit, we selected the only or most commonly applied clade concept name at the time of publication. This effort yielded 13 additional labels for 2015.PEA (Table 1), and 7 such labels for 2014.JEA (Table 2).
If no suitable label was available, we chose a simple naming convention of adding
"_Clade1", "_Clade2", etc., to the available and immediately higher-level node label, e.g. 2014. Passerea_Clade1. The numbering of such labels along the tree topology starts with the most immediate child of a properly named parent, and typically follows down one section of the source tree entirely ("depth-first"), before continuing with the higher-level sister section. Using this approach, we added 11 labels for 2015.PEA (Table 1) and 7 labels for JEA.2014 (Table 2). If greater numbers of labels need to be generated, including siblings, then it is sensible to have a rule for ordering sibling nodes, e.g. by assigning the next-lowest number to the sibling whose child’s name appears first in the alphabet. Our numbering of the labels 2014.Passerea_Clade2 (child with first-appearing letter: 2014.Ardeae) and 2014.Passerea_Clade3 (child: 2014.Cursor-imorphae) adhere to this rule.
primary aim of 2014.JEA. The same applies to 2015.PEA, who sampled 104/125 family-level concepts with only 1–2 children.
[image:10.612.38.576.99.629.2]3. Representing phylogeny/classification paraphyly.A third, relatively minor challenge is the occurrence of clade concepts in 2015.PEA’s phylogenomic tree that are not congruently
Table 1. Supra-ordinal clade concept labels used for the phylogenomic tree of 2015.PEA, with sources from which the names were obtained."Franz et al. 2018" means: the label was assigned pragmatically in this study. See main text for further detail.
# Clade concept label Utilized name source Immediate child concepts
P01 2015.Neornithes Livezey & Zusi 2007 [43] 2015.Palaeognathae, 2015.Neognathae
P02 2015.Palaeognathae Prum et al. 2015 [2] 2015.Notopalaeognathae, 2015.Struthioniformes
P03 2015.Notopalaeognathae Yuri et al. 2013 [46] 2015.Novaeratitae, 2015.Rheiformes
P04 2015.Novaeratitae Yuri et al. 2013 [46] 2015.Apterygiformes, 2015.Novaeratitae_Clade1
P05 2015.Novaeratitae_Clade1 Franz et al. 2018 2015.Casuariiformes, 2015.Tinamiformes
P06 2015.Neognathae Jarvis et al. 2014 [1] 2015.Galloanserae, 2015.Neoaves
P07 2015.Galloanserae Prum et al. 2015 [2] 2015.Anseriformes, 2015.Galliformes
P08 2015.Neoaves Prum et al. 2015 [2] 2015.Strisores, 2015.Neoaves_Clade1
P09 2015.Strisores Prum et al. 2015 [2] 2015.Caprimulgidae, 2015.Strisores_Clade1
P10 2015.Strisores_Clade1 Franz et al. 2018 2015.Nyctibiidae, 2015.Steatornithidae, 2015.Strisores_Clade2
P11 2015.Strisores_Clade2 Franz et al. 2018 2015.Apodiformes, 2015.Aegothelidae, 2015.Podargidae
P12 2015.Neoaves_Clade1 Franz et al. 2018 2015.Columbaves, 2015.Neoaves_Clade2
P13 2015.Columbaves Prum et al. 2015 [2] 2015.Columbimorphae, 2015.Otidimorphae
P14 2015.Columbimorphae Prum et al. 2015 [2] 2015.Columbiformes, 2015.Columbimorphae_Clade1
P15 2015.Columbimorphae_Clade1 Franz et al. 2018 2015.Mesitornithiformes, 2015.Pterocliformes
P16 2015.Otidimorphae Prum et al. 2015 [2] 2015.Musophagiformes, 2015.Otidimorphae_Clade1
P17 2015.Otidimorphae_Clade1 Franz et al. 2018 2015.Mesitornithiformes, 2015.Ptercoclidiformes
P18 2015.Neoaves_Clade2 Franz et al. 2018 2015.Gruiformes, 2015.Neoaves_Clade3
P19 2015.Neoaves_Clade3 Franz et al. 2018 2015.Aequorlitornithes, 2015.Inopinaves
P20 2015.Aequorlitornithes Prum et al. 2015 [2] 2015.Aequorlitornithes_Clade1, 2015.Ardeae
P21 2015.Aequorlitornithes_Clade1 Franz et al. 2018 2015.Charadriiformes, 2015. 2015.Phoenicopterimorphae
P22 2015.Phoenicopterimorphae Jarvis et al. 2014 [1] 2015.Phoenicopteriformes, 2015.Podicipediformes
P23 2015.Ardeae Brodkorb 1963 [42] 2015.Aequornithia, 2015.Phaethontimorphae
P24 2015.Aequornithia Prum et al. 2015 [2] 2015.Aequornithia_Clade1, 2015.Gaviiformes
P25 2015.Aequornithia_Clade1 Franz et al. 2018 2015.Pelecanimorphae, 2015.Procellariimorphae
P26 2015.Pelecanimorphae Prum et al. 2015 [2] 2015.Ciconiiformes, 2015.Pelecanimorphae_Clade1
P27 2015.Pelecanimorphae_Clade1 Franz et al. 2018 2015.Pelecaniformes, 2015.Suliformes
P28 2015.Procellariimorphae Prum et al. 2015 [2] 2015.Procellariiformes, 2015.Sphenisciformes
P29 2015.Phaethontimorphae Prum et al. 2015 [2] 2015.Eurypygiformes, 2015.Phaethontiformes
P30 2015.Inopinaves Prum et al. 2015 [2] 2015.Opisthocomiformes, 2015.Telluraves
P31 2015.Telluraves Prum et al. 2015 [2] 2015.Accipitriformes, 2015.Eutelluraves
P32 2015.Eutelluraves Prum et al. 2015 [2] 2015.Australaves, 2015.Coracornithia
P33 2015.Australaves Prum et al. 2015 [2] 2015.Cariamiformes, 2015.Eufalconimorphae
P34 2015.Eufalconimorphae Suh et al. 2011 [45] 2015.Falconiformes, 2015.Passerimorphae
P35 2015.Passerimorphae Sibley et al. 1988 [3] 2015.Passeriformes, 2015.Psittaciformes
P36 2015.Coracornithia Claramunt & Cracraft 2015 [47] 2015.Coraciimorphae, 2015.Strigiformes
P37 2015.Coraciimorphae Prum et al. 2015 [2] 2015.Coliiformes, 2015.Eucavitaves
P38 2015.Eucavitaves Yuri et al. 2013 [46] 2015.Cavitaves, 2015.Leptosomiformes
P39 2015.Cavitaves Yuri et al. 2013 [46] 2015.Picocoraciae, 2015.Trogoniformes
P40 2015.Picocoraciae Mayr 2010 [44] 2015.Bucerotiformes, 2015.Picodynastornithes
aligned with higher-level concepts of [20]. We highlight these instances here because they rep-resent a widespread phenomenon in phylogenomics. It is useful to understand how such dis-crepancies can be modeled with RCC–5 alignments (Figs5and6).
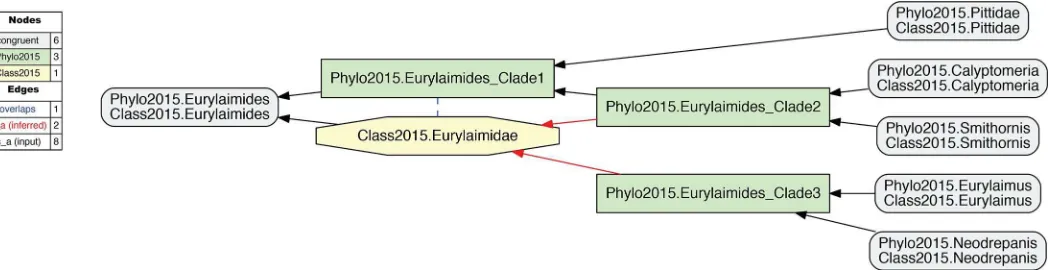
[image:11.612.37.575.96.577.2]Fig 5exemplifies the phylogenetic tree/classification incongruence observed in 2015.PEA. The authors state (supplementary Table 1, p. 1): "Taxonomy follows Gill and Donsker (2015; fifth ed)". As shown inFig 5, their phylogeny accommodates four sampled genus-level con-cepts that would correspond to children of the family-level concept Eurylaimidae sec. Gill & Donsker (2015) [20]. However, these concepts are arranged paraphyletically in relation to the
Table 2. Supra-ordinal clade concept labels used for the phylogenomic tree of 2014.JEA, with sources from which the names were obtained."Franz et al. 2018" means: the label was assigned pragmatically in this study. See main text for further detail.
# 2014.JEA clade concept label Utilized name source Immediate child concepts
J01 2014.Neornithes Jarvis et al. 2014 [1] 2014.Palaeognathae, 2014.Neognathae
J02 2014.Palaeognathae Jarvis et al. 2014 [1] 2014.Struthioniformes, 2014.Tinamiformes
J03 2014.Neognathae Jarvis et al. 2014 [1] 2014.Galloanseres, 2014.Neoaves
J04 2014.Galloanseres Jarvis et al. 2014 [1] 2014.Anseriformes, 2014.Galliformes
J05 2014.Neoaves Jarvis et al. 2014 [1] 2014.Columbea, 2014.Passerea
J06 2014.Columbea Jarvis et al. 2014 [1] 2014.Columbimorphae, 2014.Phoenicopterimorphae
J07 2014.Columbimorphae Jarvis et al. 2014 [1] 2014.Columbiformes, 2014.Columbimorphae_Clade1
J08 2014.Columbimorphae_Clade1 Franz et al. 2018 2014.Mesitornithiformes, 2014.Pterocliformes
J09 2014.Phoenicopterimorphae Jarvis et al. 2014 [1] 2014.Phoenicopteriformes, 2014.Podicipediformes
J10 2014.Passerea Jarvis et al. 2014 [1] 2014.Passerea_Clade1, 2014.Passerea_Clade4
J11 2014.Passerea_Clade1 Franz et al. 2018 2014.Passerea_Clade2, 2014.Passerea_Clade3
J12 2014.Passerea_Clade2 Franz et al. 2018 2014.Ardeae, 2014.Telluraves
J13 2014.Ardeae Brodkorb 1963 [42] 2014.Aequornithia, 2014.Phaethontimorphae
J14 2014.Aequornithia Jarvis et al. 2014 [1] 2014.Aequornithia_Clade1, 2014.Gaviimorphae
J15 2014.Aequornithia_Clade1 Franz et al. 2018 2014.Pelecanimorphae, 2014.Procellariimorphae
J16 2014.Pelecanimorphae Jarvis et al. 2014 [1] 2014.Pelecaniformes
J17 2014.Procellariimorphae Jarvis et al. 2014 [1] 2014.Procellariiformes, 2014.Sphenisciformes
J18 2014.Gaviimorphae Jarvis et al. 2014 [1] 2014.Gaviiformes
J19 2014.Phaethontimorphae Jarvis et al. 2014 [1] 2014.Eurypygiformes, 2014.Phaethontiformes
J20 2014.Telluraves Jarvis et al. 2014 [1] 2014.Afroaves, 2014.Australaves
J21 2014.Afroaves Jarvis et al. 2014 [1] 2014.Accipitrimorphae, 2014.Coracornithia
J22 2014.Accipitrimorphae Jarvis et al. 2014 [1] 2014.Accipitriformes
J23 2014.Coracornithia Claramunt & Cracraft 2015 [47] 2014.Coraciimorphae, 2014.Strigiformes
J24 2014.Coraciimorphae Jarvis et al. 2014 [1] 2014.Coliiformes, 2014.Eucavitaves
J25 2014.Eucavitaves Yuri et al. 2013 [46] 2014.Cavitates, 2014.Leptosomiformes
J26 2014.Cavitates Yuri et al. 2013 [46] 2014.Picocoraciae, 2014.Trogoniformes
J27 2014.Picocoraciae Mayr 2010 [44] 2014.Bucerotiformes, 2014.Picodynastornithes
J28 2014.Picodynastornithes Yuri et al. 2013 [46] 2014.Coraciiformes, 2014.Piciformes
J29 2014.Australaves Jarvis et al. 2014 [1] 2014.Cariamiformes, 2014.Eufalconimorphae
J30 2014.Eufalconimorphae Suh et al. 2011 [45] 2014.Falconiformes, 2014.Passerimorphae
J31 2014.Passerimorphae Jarvis et al. 2014 [1] 2014.Passeriformes, 2014.Psittaciformes
J32 2014.Passerea_Clade3 Franz et al. 2018 2014.Cursorimorphae, 2014.Opisthocomiformes
J33 2014.Cursorimorphae Jarvis et al. 2014 [1] 2014.Charadriiformes, 2014.Gruiformes
J34 2014.Passerea_Clade4 Franz et al. 2018 2014.Caprimulgimorphae, 2014.Otidimorphae
J35 2014.Caprimulgimorphae Jarvis et al. 2014 [1] 2014.Caprimulgiformes
J36 2014.Otidimorphae Jarvis et al. 2014 [1] 2014.Cuculiformes, 2014.Otidimorphae_Clade1
J37 2014.Otidimorphae_Clade1 Franz et al. 2018 2014.Musophagiformes, 2014.Otidiformes
reference classification. There is no parent concept that can be labeled 2015.Eurylaimidae and would not also (1) include 2015.Pittidae, i.e., 2015.Passeriformes_Clade1 inFig 6, or (2) just represent aligned subset of the Eurylaimidae sec. Gill and Donsker (2015) [20], i.e., 2015.Pas-seriformes_Clade2 or 2015.Passeriformes_Clade3 inFig 6. The concept Eurylaimidae sec. Gill and Donsker (2015) [20] has an overlapping (><) articulation with 2015. Passeriformes_ Clade1.
In summary, our approach represents non-monophyly as an incongruent alignment of the phylogenomic tree and the source classification used to provide labels for that tree’s monophy-letic clade concepts. There are four distinct regions in the phylogeny of 2015.PEA where such alignments are needed: {Caprimulgiformes, Eurylaimidae, Hydrobatidae, Procellariidae, Tityr-idae} sec. Gill & Donsker (2015) [20]. Each of these is provided in theS7–S9Files.
Configuration of input constraints and alignment partitioning
The source phylogenies specify 703 and 216 clade or taxonomic concepts, respectively. The fre-quent instances of locally relaxed coverage increase the reasoning complexity in relation to multi-classification alignments [14], making specialized RCC–5 reasoning useful [48]. The rea-soning and visualization challenges commend a partitioned alignment approach. To keep the Results concise, we show visualizations of the larger input and alignment partitions only in the Supporting Information. A detailed account of the input configuration and partitioning work-flow is given below.
[image:12.612.46.579.81.145.2]Underlying all alignments is the presumption that at the terminal (species) level, the taxonomic concept labels of 2015.PEA and 2014.JEA are reliable indicators of either pairwise congruence or exclusion [14,26,32]. That is, e.g., 2015.Cariama_cristata = = 2014.Cariama_ cristata, or 2015.Charadrius_hiaticula ! 2014.Charadrius_vociferus. Because the time interval
Fig 5. Input visualization of the alignment of the phylogenomic reconstruction of passeriformcladeconcepts sec. 2015.PEA–prefixed with "Phylo2015"–with the correspondingclassificationconcepts sec. Gill & Donsker (2015) [20]–prefixed with "Class2015".The phylogenomic topology renders that of Class2015. Eurylaimidae paraphyletic, and hence the name "Eurylaimidae" is not represented in any clade concept label sec. 2015.PEA. See also Prum et al. (2015). See alsoS5 File. https://doi.org/10.1371/journal.pcbi.1006493.g005
Fig 6. Alignment visualization corresponding toFig 5.The alignment shows an overlapping articulation (dashed blue line) between the phylogenomic clade concept sec. 2015.PEA (Phylo2015.Passeriformes_Clade1) and the Eurylaimidae sec. Gill & Donsker (2015) [20] (Class2015.Eurylaimidae). The two dashed red arrows symbolize reasoner-inferred relationships not explicit in the input constraints. See alsoS6 File.
[image:12.612.52.576.543.678.2]separating the two publications is short in comparison to the time needed for taxonomic revi-sions to effect changes in classificatory practice, the genus- or species-level taxonomic concepts are unlikely to show much incongruence; though see [49] or [50]. We note that 2015.PEA (p. 571) use the label 2015.Urocolius(_indicus) in their phylogenomic tree, which also corre-sponds to the genus-level name endorsed in [20] Gill & Donsker (2015). However, in their Supplementary Table 1 the authors use 2015.Colius_indicus. We chose 2015.Urocolius and 2015.Urocolius_indicus as the labels to apply in the alignments.
The toolkit workflow favors a partitioned, bottom-up approach [29]. The process of gener-ating, checking, and regenerating input files must be handled ’manually’ on the desktop (note: improved workflow documentation and semi-automation of input-output-input changes are highly desirable). The performance of different toolkit reasoners was benchmarked in [28].
To work efficiently, the large problem of aligning all concepts at once is broken down into multiple smaller alignment problems, e.g. 2015./2014.Psittaciformes (Figs3and4). To manage one particular order-level alignment, we start with assembling each input phylogeny sepa-rately, with relaxed coverage applied as needed (Fig 3). The RCC–5 articulations for low-level concept pairs are provided incrementally, e.g., in sets of 1–5 articulations at a time. Following such an increment, the toolkit reasoning process is re-/deployed to validate input consistency and infer the number of possible worlds. There is an option to specify that only one possible world is sought as output, which is equivalent tojustchecking for input consistency, as opposed to inferring all possible worlds. Doing so saves time as long as the input remains (vastly) under-specified. The stepwise approach of adding a small number of articulations at a time leads to increasingly constrained alignments, while minimizing the risk of introducing many new. difficult-to-diagnose inconsistencies.
Once a set of small, topographically adjacent alignment partitions is well specified, these can serve as building blocks for the next, larger partition. Hence, the basic sequence of building up larger alignments is: (1) obtain a well-specified low- (order- or family-) level alignment; (2) record the inferred parent-level articulations from this alignment; (3) propagate the latter– now as low-levelinputarticulations–for the next, more inclusive alignment; (4) as needed, prune the lowest-level (sub-ordinal) input concepts and articulations of (1) from this align-ment; (5) repeat (1) to (4) for another paired region; (6) assemble the more inclusive alignment by (manually) connecting the pruned, propagated concepts and articulations from two or more lower-level alignments, by adding to them the higher-level concepts from each input phylogeny. Depending on the interplay between (ranked) higher-level names recognized in each phylogeny and the number of terminal concepts sampled, steps (1) to (6) may be iterated once (e.g., 2015./2014.{Falconiformes, Psittaciformes}) or multiple times (e.g., seriformes) to cover a supra-/ordinal alignment. An example of the latter is the 2015./2014.Pas-serimorphae alignment, which includes two order-level concepts and their children in each source phylogeny. Such mid-level partitions eventually form the basis for the largest alignment partitions, e.g. 2015./2014.Telluraves.
Sometimes, coverage will have to be relaxed even at higher levels. In all, 2014.JEA sample children of 34 level concepts in their phylogeny, whereas 2015.PEA recognize 40 order-level concepts. The latter authors represent four order-order-level concepts for which no analogous children are included in 2014.JEA, i.e.: 2015.{Apterygiformes, Casuariiformes, Ciconiiformes, Rheiformes}. Three of these are assigned to 2015.Palaeognathae, whereas 2015.Ciconiiformes are subsumed under 2015.Pelecanimorphae–in each case under relaxed parent coverage. The remaining 36 order-level concepts sec. 2015.PEA show some child-level overlap with those of 2014.JEA.
and4. The largest order-level partition is 2015./2014.Passeriformes, with 148 x 22 input con-cepts, seven instances of relaxed parent coverage, and 101 input articulations. This alignment completes in less than 15 seconds on an individual 2.0 GHz processor, yielding 3,256 MIR.
As the partitions grew, we configured the following six, non-overlapping alignments as building blocks for the global alignment: 2015./2014.Palaeognathae (34 x 12 input concepts, four instances of relaxed coverage, and 25 articulations; same data sequence used for following alignments), 2015./2014.Galloanserae (49, 16, 7, 46), 2015.Columbaves/2014.Columbimorphae + 2014.Otidimorphae (53, 37, 13, 37), 2015.Strisores/2014.Caprimulgimorphae (44, 17, 8, 32), 2015./2014.Ardeae (100, 55, 19, 75), and the largest partition of 2015./2014.Telluraves (316, 104, 37, 241).
At the next more inclusive level, the inferred congruence of 2015.Telluraves = = 2014.Tell-uraves presented an opportunity to partition the entire alignment into two similarly sized regions, where the complementary region includes all 2015./2014.Neornithes concepts (392, 174, 58, 259),exceptthose subsumed under 2015./2014.Telluraves, which are therein only rep-resented with two concepts labels and one congruent articulation. These two complements are the core partitions that inform our use case alignment, globally. The correspondingS10and
S11Files include the input constraint (.txt) and visualization (.pdf) files, along with the align-ment visualization (.pdf) and MIR (.csv).
The two large partitions yield unambiguous RCC–5 articulations from the species concept level to that of 2015./2014.Neornithes. They can be aggregated into a synthetic, root-to-order level alignment, where all subordinal concepts and articulations are secondarily pruned away (see above). Such an alignment retains the logic signal derived from the bottom-up approach, but represents only congruent order-level concept labels as terminal regions, except in cases where there is incongruence. We present this alignment as an analogue to Fig 1 in [4] (p. 515), and compare how each conveys information about congruent and conflicting higher-level clade concepts.
Lastly, we further reduce the root-to-order alignment to display only 5–6 clade concept lev-els below the congruent 2015./2014.Neoaves. This region of the alignment is the most conflict-ing, and therefore forms the basis for our Discussion.
Results
Higher-level congruence
Our alignments show widespread higher-level congruence across the neoavian explosion use case; along with several minor regions of conflict and one strongly conflicting region between concepts placed immediately below the 2015./2014.Neoaves.
under strict coverage. Correcting for the redundant 2015./2014.Telluraves region, we ’gain’ 85 congruent parent node regions across the two phylogeniesifnode identity is encoded intensionally (Figs3and4). Indeed, this approach yields the intuitive articulation 2015. Neornithes = = 2014.Neornithes at the highest level.
Two kinds of conflict: Differential granularity and overlap
We now focus on characterizing the conflict between 2015.PEA and 2014.JEA. Phylogenomic incongruence can be divided into two general categories: (1) differential granularity or resolu-tion of clade concepts (RCC–5 translaresolu-tion:<or>), and (2) overlapping clade concepts (RCC–5 translation:><).
The first of these is less problematic from a standpoint of achieving integration: for a given alignment subregion, the more densely sampled phylogeny will entail additional, more finely resolved clade concepts in comparison to its counterpart. Typically, this distinction belongs to the phylogeny of 2015.PEA, due to the 4:1 ratio of terminals sampled. There are 83 above spe-cies-level clade concepts sec. 2015.PEA that can be interpreted ascongruent refinementsof the 2014.JEA topology (seeS10andS11Files). Conversely, only two such instances of added reso-lution are contributed by 2014.JEA: (1) 2014.Passeriformes_Clade3 which entails 2014.Passeri-dae and 2014.Thraupi2014.Passeri-dae; and (2) 2014.Haliaeetus with two subsumed species-level concepts. Nevertheless, the joint 97 congruent node regions and 85 refining node regions cover a large section of the alignment where integration is either reciprocally (= =) or unilaterally (<or>) feasible.
Topological overlap
The remaining 38 instances of overlapping articulations between constitute the most profound conflict. These instances are clustered in four distinct regions, i.e.: 2015./2014.Pelecanimor-phae (8 overlaps;Fig 7andS12 File); 2015.Passeri/2014.Passeriformes_Clade2 (3 overlaps;Fig 8andS13 File); 2015.Eutelluraves/2014.Afroaves (1 overlap; Figs9and10, andS14andS15
Files); and finally, 2015./2014.Neoaves (26 overlaps; Figs11–13, andS16–S18Files). We will examine each of these in sequence.
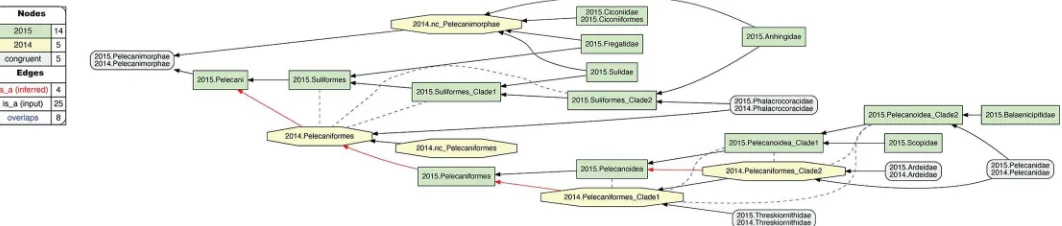
[image:15.612.46.577.559.672.2]1. 2015./2014.Pelecanimorphae.The two author teams sampled four family-level concepts congruently for this alignment region (Fig 7). However, 2015.PEA’s phylogeny entails six addi-tional family-level concepts that have no apparent match in 2014.JEA. Moreover, the latter authors recognize only one order-level concept, 2014.Pelecaniformes, under which all four family-level concepts are subsumed, including 2014.Phalacrocoracidae. In contrast, 2015.PEA infer an intensionally less inclusive concept of 2015.Pelecaniformes, and place their congruent
Fig 7. Alignment visualization for the 2015./2014.Pelecanimorphae alignment, with eight overlapping relationships.See text for further detail. The reasoner infers 200 logically implied articulations that constitute the set of MIR. See alsoS12 File.
2015.Phalacrocoracidae in the order-level concept 2015.Suliformes. This is the first instance where we may plausibly reject the proposition: "Had 2014.JEA sampled 2014.Phalacrocoraci-dae, they would have assigned this concept to 2014.Suliformes". The assertion is no longer counter-factual: 2014.JEAdidsample the corresponding child concept (2014.Phalacrocoraci-dae), but didnotassign it to a parent concept separate from 2014.Pelecaniformes. Accordingly, we obtain three overlapping, ’cascading’ articulations between concepts that form the 2015. Suliformes higher-level topology and 2014.Pelecaniformes. Meanwhile, the uniquely sampled 2015.Ciconiiformes are subsumed under 2014.Pelecanimorphae with relaxed parent coverage.
Within 2015.Pelecaniformes, we obtain five additional overlapping articulations between five concepts that make up the 2015/2014 supra-familial topologies in this alignment (Fig 7). This conflict is due to the differential assignment of 2015./2014.Pelecanidae. Specifically, 2015. PEA inferred a sister relationship of 2015.Pelecanidae with 2015.Balaenicipitidae, for which 2014.JEA have no sampled match. Meanwhile, the latter authors inferred a sister relationship of 2014.Pelecanidae with 2014.Ardeidae. The latter conceptismatched in 2015.PEA with 2015. Ardeidae, though not as the most immediate sister concept of 2015.Pelecanidae. Of course, we may posit that a 2015.Ardeidae/2015.Pelecanidae sister relationship is what 2015.PEAwould
[image:16.612.40.577.74.193.2]have obtained, had these authors not also sampled 2015.Balaenicipitidae and 2015.Scopidae. But they did, and hence obtained two clade concepts that include 2015.Pelecanidae yet exclude 2015.Ardeidae; i.e., 2015.Pelecanoidea_Clade1 and 2015.Pelecanoidea_Clade2. While relaxing parent coverage for 2014.Pelecaniformes_Clade2 could serve to mitigate this conflict, we deem the overlapping relationship to better represent 2015.PEA’s phylogenomic signal, which hap-pens to ’break up’ the lowest supra-familiar clade concept supported by 2014.PEA.
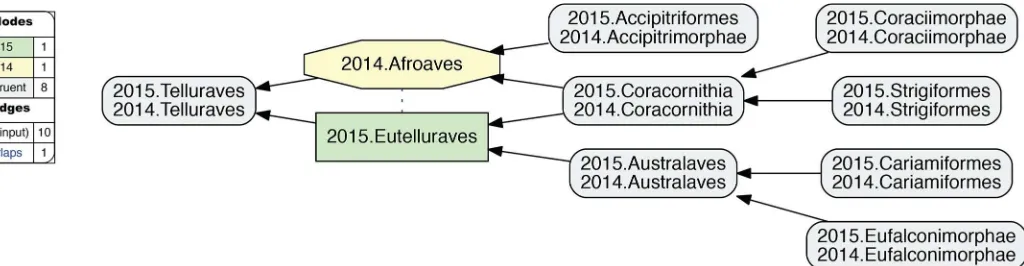
Fig 9. Alignment visualization for the 2015./2014.Telluraves alignment, under whole-concept resolution, with one overlapping relationship.Compare withFig 10; see text for further detail. The reasoner infers 81 logically implied articulations that constitute the set of MIR. See alsoS14 File.
[image:16.612.62.574.554.687.2]https://doi.org/10.1371/journal.pcbi.1006493.g009
Fig 8. Alignment visualization for the 2015.Passeri/2014.Passeriformes_Clade2 alignment, with three overlapping relationships.See text for further detail. The reasoner infers 135 logically implied articulations that constitute the set of MIR. See alsoS13 File.
2. 2015.Passeri/2014.Passeriformes_Clade2.This alignment region is another instance where relaxing parent coverage can only partially mitigate conflict (Fig 8). In this case, 2015. PEA and 2014.JEA sampled two sets of family-level concepts that are wholly exclusive of each other,exceptfor 2015./2014.Corvidae. Regarding the only two additional family-level concepts recognized in 2014.JEA–i.e., 2014.Passeridae and 2014.Thraupidae–we may posit counter-fac-tually that these would be subsumed under 2015.Passeroidea with relaxed coverage [47]. How-ever, further assertions of congruence are difficult to justify, given the limited sampling of 2014.JEA. Thus, in our current representation, 2014.Passeriformes_Clade2 shows an overlap-ping relationship with 2015.Passeroidea, its immediate parent 2015.Passerida, and also with 2015.Corvoidea.
3. 2015.Eutelluraves/2014.Afroaves.A single overlap occurs just within the congruent par-ent concepts 2015./2014.Telluraves (Fig 9). Two levels below this paired parent region, both author teams recognize three congruent children; viz. 2015./2014.{Australaves, Coracornithia, Accipitrimorphae/Accipitriformes}. However, 2015.Prum group the former two concepts under 2015.Eutelluraves, with 2015.Accipitriformes as sister; whereas 2014.JEA cluster the lat-ter two concepts under 2014.Afroaves, with 2014.Australaves as sislat-ter. This is the first occur-rence of conflict thatcannotjustifiably be resolved by relaxing parent coverage, but instead reflects divergent phylogenomic signals.
Whole-concept and split-concept resolution
How tospeakof such overlap? InFig 9, we utilize clade concept labels that pertain to each input phylogeny. In the resulting alignment, the articulation 2015.Eutelluraves><2014. Afroaves is visualized as a dashed blue line between these regions. YetFig 9also specifies the extent of regional overlap at the next lower level. Accordingly, only the region 2015./2014.Cor-acornithia is subsumed under each of the overlapping parents. This is indicated by the two inclusion arrows that extend ’upward’ from this region. The other two paired child regions are respectively members of one parent region.
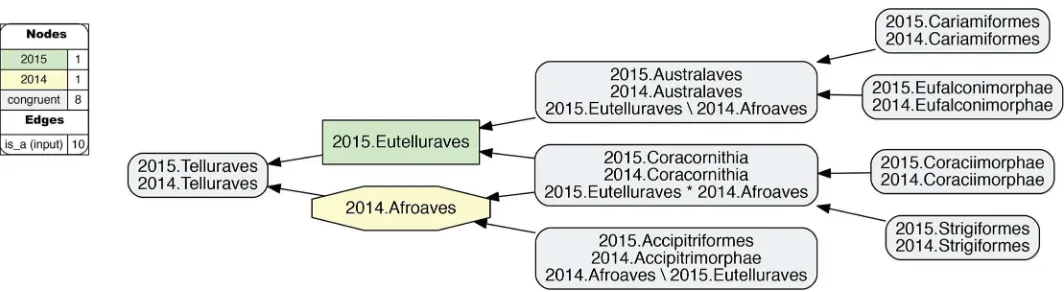
If we call the input regions 2015.Eutelluraves "A" and 2014.Afroaves "B", we can use the fol-lowing syntax to identify output regions that result from overlapping input concepts [26]: A�
B (read: "AandB") constitutes the output region shared by two parents, whereas A\b ("A,notb") and B\a ("B,nota") are output regions with only one parent. We call this more granular syntax
split-concept resolution("merge concepts" in [26]), as opposed towhole-concept resolution
[image:17.612.44.576.74.220.2]which preserves the syntax and granularity provided by the input concept labels.
Fig 10. Alignment visualization for the 2015./2014.Telluraves alignment, under split-concept resolution, resolving the overlapping relationship.Compare with
InFig 10, the 2015./2014.Telluraves overlap is represented with split-concept resolution. This eliminates the need to visualize a dashed blue line between 2015.Eutelluraves and 2014. Afroaves (Fig 9). Moreover, in this case the split-concept resolution syntax is redundant or unnecessary, because each of the three resolved regions under "A" (2015.Eutelluraves) and "B" (2014.Afroaves) is congruent with two regions already labeled in the corresponding input phy-logenies. We will see, however, that this granular syntax is essential for verbalizing the out-comes of more complex alignments that contain many overlapping regions.
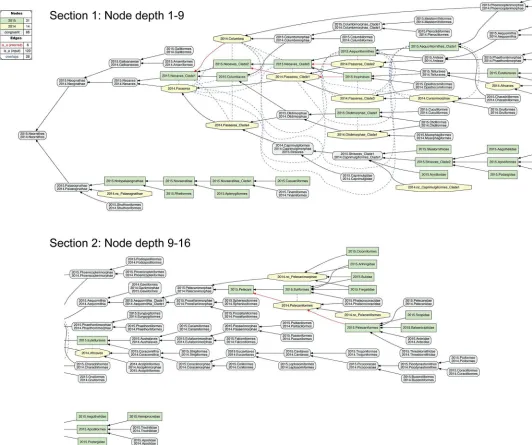
Fig 11. Alignment visualization for the 2015./2014.Neornithes alignment, under whole-concept resolution, ranging from the root to the ordinal level (with exceptions where needed), and with 28 overlapping relationships.Compare with Figs7,9and10; see text for further detail. The reasoner infers 8,051 logically implied articulations that constitute the set of MIR. See alsoS16 File.
Zooming in on the neoavian explosion
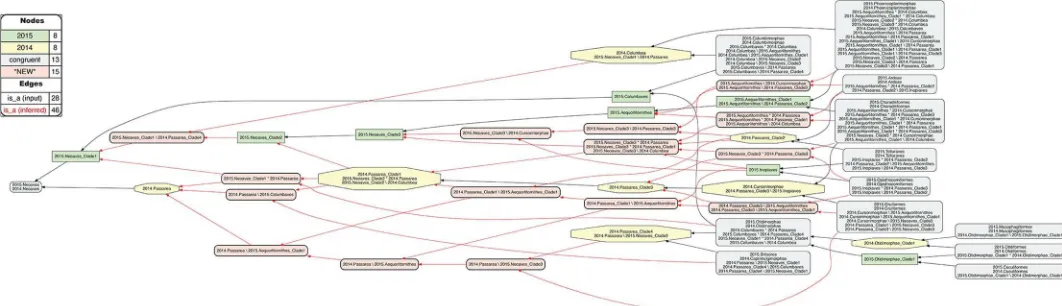
4. 2015./2014.Neoaves.The remaining 26 instances of overlap are shown under different alignment visualizations in Figs11–13. They occur 1–5 levels below the congruent concept pair 2015./2014.Neoaves, and jointly make up the primary region of conflict between these reconstructions. Because parent coverage was already and selectively applied at lower levels, none of the 26 overlaps in the alignment are caused by differential child sampling. Therefore parent coverage mustholdhere, resulting in genuine conflict in the higher-level arrangement of congruent sets of children.
[image:19.612.54.576.82.252.2]OurFig 11is intended to be an RCC–5 alignmentanalogueto Fig 1 in [3]. The alignment reaches from the root to the ordinal level, and to the family level in the two subregions where order-level concepts are conflicting (seeFig 4andS12 File). The visualization provides an intu-itive signal of the distribution of in-/congruence throughout the alignment. In all, 66/111 regions (59.5%) are congruent, of which 22 are located in the 2015./2014.Telluraves; 15 are contained in the 2015./2014.Ardeae; and 5 are part of the 2015./2014.Columbimorphae.
Fig 12. Alignment visualization for the 2015./2014.Neoaves alignment, under whole-concept resolution, limited to the main conflict region, and with 26 overlapping relationships.Compare withFig 11. The reasoner infers 441 logically implied articulations that constitute the set of MIR. See alsoS17 File. https://doi.org/10.1371/journal.pcbi.1006493.g012
Fig 13. Alignment visualization for the 2015./2014.Neoaves alignment, under split-concept resolution, limited to the main conflict region, and resolving the 26 overlapping relationships.Compare withFig 12; the 15 salmon-colored regions areonlyidentifiable via split-concept resolution labels. Compare withFig 12and
[image:19.612.43.574.513.666.2]Outside of the 2015./2014.Neoaves, 8 such regions are present. In other words, the two phylog-enies are congruent at the highest level and also in several intermediate regions above the ordi-nal level.
Fig 12shows just the neoavian explosion region under whole-concept resolution. Each phy-logeny contributes 21 input concepts to this ’zoomed-in’ alignment, which yields 13 congruent regions. Of these, only 2015./2014.Neoaves and 2015./2014.Otidimorphae represent non-ter-minal concepts.
Unpacking the complexity of this conflict region requires a stepwise analysis. From the per-spective of 2015.PEA, the 2015.Neoaves are split into a sequence of three unnamed, higher-level clade concepts, i.e. 2015.{Neoaves_Clade1, Neoaves_Clade2, Neoaves_Clade3}, with 2015.{Strisores, Columbaves, Gruiformes} as corresponding sister concepts. The two children of 2015.Neoaves_Clade3 are 2015.{Aequorlitornithes, Inopinaves}. The authors accept the nomenclature of [44] for 2015.Strisores, with is congruent with 2014.Caprimulgimorphae; and the region 2015./2014.Gruiformes is congruent as well. However, the remaining six high-level concepts of 2015.PEA are in conflict with the two highest-level neoavian concepts of 2014.JEA, i.e. 2014.{Columbea, Passerea}, and also with any of the four unnamed clade concepts below 2014.Passerea. In particular, the node sequence 2015.{Neoaves_Clade3, Aequorlithornites, Aequorlithornites_Clade1} participates in 16/26 overlaps, as summarized inTable 3. Loosely corresponding to this sequence are the concepts 2014.{Passerea_Clade1, Passerea_Clade2, Cursorimorphae}, jointly with 10 overlaps. These overlaps are grounded in the incongruent assignment of five paired, lower-level concept regions; viz. 2015./2014.{Ardeae, Charadrii-formes, OpisthocomiCharadrii-formes, Phoenicopterimorphae, Telluraves}. Two conflicting placements contribute most to the number of overlaps: (1) 2015./2014.Charadriiformes in 2015.Aequor-lithornites_Clade1 (sister to 2015.Phoenicopterimorphae) versus 2014.Cursorimorphae (sister to 2014.Gruiformes); and (2) 2015./2014.Phoenicopterimorphae in 2015.Aequorlithornite-s_Clade1 versus 2014.Columbea (sister to 2014.Columbimorphae). The newly proposed yet unnamed 2015. Aequorlithornites_Clade1, consisting of certain "waterbirds", in effect causes the most topological incongruence with 2014.JEA. This concept, together with its four super-seding parents, ’triggers’ 20/26 overlaps with the phylogenomic tree of 2014.JEA.
[image:20.612.35.576.89.225.2]Two additional clusters of conflict are identifiable inFig 12. The first concerns the align-ment of the two concepts 2015.Inopinaves and 2014.Passerea_Clade2, which share the child regions 2015./2014.Telluraves, yet which differentially accommodate the congruent regions 2015./2014.Ardeae and 2015./2014.Opisthocomiformes. This further contributes to the abun-dance of overlaps along the respective 2015.Neoaves_Clade{1–3}/Aequorlithornites/_Clade1 and 2014.Passerea/_Clade{1–3}/Cursorimorphae chains. Second, the two paired regions
Table 3. Overview of 26 pairwise 2015/2014 concept overlaps in main neoavian conflict region.See also Figs11and12.
Clade concept label 2014.
Passerea 2014. Columbea
2014.Passerea _Clade3
2014.Cursori-morphae
2014.Passerea _Clade1
2014.Passerea _Clade2
2014.Passerea _Clade4
2014.Otidimor-phae_Clade1
Totals
2015.Aequorlithornites >< >< >< >< >< >< 6
2015.Aequorlithornites_Clade1 >< >< >< >< >< 5
2015.Neoaves_Clade3 >< >< >< >< >< 5
2015.Columbaves >< >< >< 3
2015.Neoaves_Clade1 >< >< 2
2015.Neoaves_Clade2 >< >< 2
2015.Inopinaves >< >< 2
2015.Otidimorphae_Clade1 >< 1
Totals 6 5 4 3 3 2 2 1 26
2015./2014.Columbimorphae and 2015./2014.Otidimorphae are incongruently assigned to three overlapping parents, i.e. 2015.Columbaves and 2014.{Columbea, Passerea_Clade4}. From the perspective of 2015.PEA, 2014.JEA’s bifurcation of 2014.Columbea and 2014.Pas-serea is the most conflicting, as these two concepts participate in 11 overlaps. A third and more minor incongruence concerns the placement of three concept regions within the 2015./2014. Oditimorphae.
Split-concept resolution for the neoavian explosion
InFig 13, the same ’zoomed-in’ alignment is shown under split-concept resolution. This per-mits identifying all output regions created by the 26 overlaps of the neoavian explosion (see
Table 4). The entire set consists of 78 labels; i.e., 26 labels for each split-resolution product {A�
B, A\b, B\a} for one instance of input region overlap. Not all of these split-concept resolu-tion labels are semantically redundant with those provided in the input. Specifically, 51 labels are generated ’in addition’ for the 12 terminal congruent regions (compare withFig 12). These are indeed unnecessary synonyms for regions already identified in the input. However, the rel-ativenumberof additional labels generated per input region is telling. This number will be highest for regions whose differential placements are the primary drivers of incongruence. As explained above, these are: 2015./2014.{Phoenicopterimorphae, Charadriiformes, Columbi-morphae}, respectively with 14, 8, and 7 additional labels. Six redundant split-concept resolu-tion labels are further produced for input regions that are unique to one phylogeny; e.g., 2014. Columbea is also labeled 2015.Neoaves_Clade1 \ 2014.Passerea (where the "\" means: not).
The remaining 21 split-concept resolution labels identify 15 salmon-colored alignment regions– 11 uniquely and 4 redundantly with 2–3 labels each–for which there arenosuitable labels in either of the phylogenomic input trees (Table 4). Forty-six additional articulations are inferred to align these regions to those displayed inFig 12. Although these novel regions are not congruent with any clade concepts recognized by the source phylogenies, they are needed to express how exactly the authors’ respective clade concepts overlap.
Three distinct reference services are gained by generating the split-concept resolution labels. First, in cases where no whole-concept resolution labels are available, we obtain appro-priately short and consistent labels to identify the split regions caused by overlapping clade concepts. Second, the {A�
B, A\b, B\a} triplets have an explanatory function, by using the same syntactic set of input labels (A, B) to divide complementary alignment subregions of an over-lap. If we focus on one label of a triplet, we can find the two complements, and thereby system-atically explore the ’reach’ of each split in the alignment. Third, the clade concept labels (A, B) used in the split-concept resolution labels will be exactly those that identify overlapping regions across the source phylogenies.
Analysis of clade
name
performance
We can now also ask to what extent the clade names (syntax) used by the two author teams succeed or fail to identify congruent and incongruent concept regions (semantics). Such name:meaning (read: "name-to-meaning") analyses were carried out in three previous align-ment use cases, with rather unfavorable outcomes for the respective names in use [14,32,51]. Here, based on the alignment ofFig 11, the 97 x 83 input concepts yield a set of 8,051 MIR (S16 File). Of these, 384 MIR involve one of four "no coverage" regions added to 2014.JEA con-cepts. We therefore restrict the name:meaning analysis to the remaining 7,667 MIR (Table 5).
Table 4. Overview of 15 newly inferred split-concept resolution regions and labels (or label clusters) for the neoavian conflict region that lack appropriate input clade concept labels.See alsoFig 13. For each split-concept resolution label (or label cluster), we provide the two immediate children or constituent concepts 1 and 2 –i.e., what is jointly subsumed ’underneath’ the split–as well as the set of lower-level concept regions (using whole-concept resolution labels) that are differentially distributed by the split between the two source phylogenies.�
= Two children listed.
# Split-concept label(s) Constituent clade concept 1 Constituent clade concept 2 Lower-level concept regions differently
assigned by the split 1 2015.Neoaves_Clade1�
2014. Passarea_Clade4
2015.Neoaves_Clade2 2014.Columbea 2015./2014.Otidimorphae, 2015.Strisores/2014. Caprimulgimorphae
2 2015.Neoaves_Clade1� 2014. Passerea
2015./2014.Otidimorphae 2014.Passerea_Clade1 2015.Strisores/2014.Caprimulgimorphae, 2014. Columbea
3 2014.Passerea \ 2015.Columbaves 2015.Strisores/2014. Caprimulgimorphae
2014.Passerea_Clade1 2015./2014.Columbimorphae, 2015./2014. Otidimorphae
4 2014.Passerea \ 2015. Aequorlitornithes_Clade1
2015.Aequorlitornithes \ 2014. Passerea
2014.Passerea_Clade1 \ 2015. Aequorlitornithes_Clade1
2015./2014.Charadriiformes, 2015./2014. Phoenicopterimorphae
5 2014.Passerea \ 2015. Aequorlitornithes
2014.Passera \ 2015. Neoaves_Clade3
2014.Passerea_Clade1 \ 2015. Aequorlitornithes
2015./2014.Ardeae, 2015./2014.Charadriiformes, 2015./2014.Phoenicopterimorphae
6 2015.Neoaves_Clade3 \ 2014. Cursorimorphae
2015.Inopinaves 2015.Neoaves_Clade3 \ 2014. Passerea_Clade3
2015./2014.Charadriiformes, 2015./2014. Gruiformes
7 2014.Passerea \ 2015. Neoaves_Clade3
2015./2014.Gruiformes 2014.Passerea_Clade4 2015./2014.Ardeae, 2015./2014.Charadriiformes, 2015./2014.Opisthocomiformes,
2015./2014.Phoenicopterimorphae, 2015./2014. Telluraves
8 2014.Passerea_Clade1 \ 2015. Aequorlitornithes_Clade1
2014.Passerea_Clade1 \ 2015. Aequorlitornithes
2014.Passerea_Clade2 2015./2014.Charadriiformes, 2015./2014. Phoenicopterimorphae
9 {2015.Neoaves_Clade3 \ 2014. Columbea,
2015.Neoaves_Clade3� 2014. Passerea,
2015.Neoaves_Clade3�2014. Passerea_Clade1}
{2015.Aequorlitornithes \ 2014. Columbea,
2015.Aequorlitornithes� 2014. Passerea,
2015.Aequorlitornithes�2014. Passerea_Clade1}, 2015.Neoaves_Clade3� 2014. Passerea_Clade3� 2015.Inopinaves, 2014.Passerea_Clade2� 2015./2014.Columbimorphae, 2015./2014. Gruiformes, 2015./2014.Otidimorphae, 2015./2014. Phoenicopterimorphae, 2015.Strisores/2014. Caprimulgimorphae
10 2015.Neoaves_Clade3 \ 2014. Passerea_Clade3
{2015.Aequorlitornithes \ 2014. Cursorimorphae,
2015.Aequorlitornithes \ 2014. Passerea_Clade3}
2014.Passerea_Clade2 2015./2014.Ardeae, 2015./2014.Charadriiformes, 2015./2014.Gruiformes, 2015./2014.
Opisthocomiformes,
2015./2014.Phoenicopterimorphae, 2015./2014. Telluraves
11 2014.Passerea_Clade1 \ 2015. Aequorlitornithes
2014.Passerea_Clade3 \ 2015. Aequorlitornithes,
2014.Passerea_Clade3 \ 2015. Aequorlitornithes_Clade1}
2015.Inopinaves 2015./2014.Ardeae, 2015./2014.Charadriiformes, 2015./2014.Gruiformes, 2015./2014.
Opisthocomiformes,
2015./2014.Phoenicopterimorphae, 2015./2014. Telluraves
12 {2015.Aequorlitornithes \ 2014. Cursorimorphae,
2015.Aequorlitornithes \ 2014. Passerea_Clade3}
2015./2014.Phoenicopterimorphae 2015./2014.Ardeae 2015./2014.Gruiformes, 2015./2014. Opisthocomiformes
13 {2015.Aequorlitornithes \ 2014. Columbea,
2015.Aequorlitornithes�2014. Passerea,
2015.Aequorlitornithes� 2014. Passerea_Clade1}
2015./2014.Ardeae 2015./2014.Charadriiformes 2015./2014.Columbimorphae, 2015./2014. Gruiformes, 2015./2014.Opisthocomiformes, 2015./2014. Otidimorphae, 2015./2014.Phoenicopterimorphae, 2015.Strisores/2014.Caprimulgimorphae, 2015./2014.Telluraves
14 2015.Neoaves_Clade3� 2014. Passerea_Clade3
2015./2014.Charadriiformes 2015./2014.Opisthocomiformes 2015./2014.Ardeae, 2015./2014.Gruiformes, 2015./2014.Phoenicopterimorphae, 2015./2014. Telluraves
15 {2014.Passerea_Clade3 \ 2015. Aequorlitornithes,
2014.Passerea_Clade3 \ 2015. Aequorlitornithes_Clade1}
2015./2014.Gruiformes 2015./2014.Opisthocomiformes 2015./2014.Ardeae, 2015./2014.Charadriiformes, 2015./2014.Phoenicopterimorphae