Int. J. Electrochem. Sci., 11 (2016) 4245 – 4252, doi: 10.20964/2016.06.81
International Journal of
ELECTROCHEMICAL
SCIENCE
www.electrochemsci.orgThe Efficiency of Alpha1-antitrypsin Deficiency Detection by
Isoelectric Focusing Phenotypes in Relation to Serum Protein
Concentrations in COPD Patients
Noura Al-Jameil1, Sree R. Isac1, Rana Hassanato2, Basma Al-Maarek1, Eman Al-Ajian1, Amina A. Hassan1,*
1
Collage of Applied medical sciences, King Saud University, Riyadh, KSA 2
King Khalid University, Hospital, Riyadh, KSA *
E-mail: aminaalyhassan@yahoo.com
Received: 4 February 2016 / Accepted: 19 April 2016 / Published: 4 May 2016
Alpha 1- antitrypsin (AAT) deficiency is one of the most hereditary disorders in the world, but there is misdiagnosis for this deficiency. There are about 100 different AAT variants cannot be easily detected by the known methods such as genotyping which reveals only the most common deficiency alleles Z and S. These underscore the need of phenotyping to determine both common and rare deficiency variants. The traditional method used in hospitals for diagnosis is the quantification of serum AAT level. Our work is an attempt to evaluate serum AAT concentration in comparison to phenotyping. 300 Chronic obstructive pulmonary disease (COPD) patients were subjected to the determination of Pi protein phenotypes by isoelectric focusing electrophoresis (IEF) and serum AAT concentrations using nephelometry. The patients were classified according to their AAT levels into 3 groups, less than 89 mg/dl (deficiency, group1), 90-140 mg/dl (intermediate, group2) and more than 141 mg/dl (normal, group3). Phenotypes of the deficient group were MZ, ZZ, SZ and SS, while the majority of phenotypes in the intermediate and normal groups were MM with the presence of some at risk variants MS, MZ, SS. Where, the rare deficiency variants FS and FM phenotypes were observed in the intermediate group. The presence of some deficiency alleles in the intermediate and normal groups which have relatively high AAT levels reflects that serum AAT concentration was not sufficient to be used for the detection of AAT deficiency indicating the importance of using other methods such as phenotyping.
Keywords: Isoelectric focusing; AAT; COPD; Phenotype
1. INTRODUCTION
constituents [1]. Deficiency of this inhibitor causes degradation of the alveolar elastin and increases pulmonary damage. Some liver diseases produced from the aggregation of gene product deficiency variants of AAT protein, such as the Z gene [2]. 10% of neonates and one third of adult men with Pi ZZ will develop hepatitis and liver cirrhosis, respectively [3], this deleterious phenotype represents 1 in 300 individuals in the United State [4].
The highly polymorphic nature of AAT indicates that the gene locus is also highly variable;
approximately 100 different alleles have been identified to date. The Z and S alleles consider the most common deleterious mutations where the Z allele is the severest one in patients with AAT
deficiency, while the M allele represents complete antiproteolytic effect.
Individuals who possess two deleterious AAT alleles (such as the relatively common Z and S deficiency variants) are at significant risk for developing symptoms related to AAT deficiency due to insufficient circulating AAT protease inhibitor (Pi) [5,6]. In people who have one deleterious allele, the risk of clinically significant symptoms has not been detected before age of 40 or 50 years [7].
AAT deficiency is under-recognized, despite the establishment of World Health Organization guidelines regarding testing criteria [8,9], this underscores the need for effective testing to increase detection of individuals at risk [10]. Using quantitative determination of AAT deficiency is not enough and there is need to other techniques such as phenotyping and genotyping [11]. The purpose of this study was to evaluate, serum AAT concentrations as diagnostic tool to detect AAT deficiency in relation to isoelectric focusing phenotypes in Chronic Obstructive Pulmonary Disease (COPD) Saudi patients.
2. MATERIAL AND METHODS
Our research was performed on 300 COPD patients from the outpatient clinic of King Khalid University Hospital, Riyadh (Saudi Arabia). Informed consent was obtained from all participants in the study. This work was accepted by the institutional review board (IRB) of the above hospital.
Clinical data (age, gender, history of smoking and tobacco intake) were collected and the diagnosis of COPD based on fixed airflow obstruction was determined by a forced expiratory volume in one second (FEV1), forced vital capacity (FVC) and the ratio between the two (FEV1/ FVC). The detection was carried out using a Micro Plus spirometer and the predicted data was less than 70% which related to AAT deficiency.
The tobacco intake was calculated by smoking pack years from the mode of smoking, daily consumption and total years smoked. For our knowledge, 20 cigarettes smoked per day for one year consider as one pack years and the tobacco intake was defined as 0 for non-smokers.
Nephelometric determination of serum AAT levels was performed using BN prospect Immune Nephelometry (Siemens Health Care, USA). Serum samples were analyzed for the phenotypes of AAT by isoelectrical focusing (IEF) on 5% polyacrylamide gels with a pH of 4-5, electrophoresed, and fixed before staining with Coomassie Brilliant Blue stain. The AAT phenotypes were determined by visual inspection and compared with known patterns.
3. STATISTICAL METHODS
SPSS PC+ version 21.0 statistical software were used to analyze data. To describe the quantitative study and the outcome variables (mean and standard deviation) were utilized. To compare the mean values of quantitative result variables, one-way analysis of variance was used for the three groups (deficiency, intermediate, and normal level of AAT) followed by Tukey’s multiple comparison test for pairwise comparison of groups. Student’s t-test was used to compare the mean values of quantitative variables between smokers and non-smokers of the intermediate and normal level of AAT study patients. A p-value of <0.05 and 95% confidence intervals were hired to report the statistical significance and accuracy of results. Also parametric chi-square test were used to study the correlations between categorical variables.
4. RESULTS
[image:3.596.44.561.453.683.2]Phenotypes, AAT concentrations were evaluated for 300 COPD. The patients were classified into groups according to their AAT levels in compliance produced by the American Thoracic Society (ATS) in collaboration with the European Respiratory Society (ERS) [12], where the suggested AAT levels, less than 89 mg/dL (deficiency); 90-140 mg/dL(intermediate); and more than 141 mg/dL(normal).
Table 1. Comparison of mean values of study and outcome variables across the three study groups
Study & Outcome variables Mean±SD F-value p-value
Group 1 (Deficiency of enzymes)
Group2 (Intermediate level of enzymes)
Group3 (Normal level
of enzymes) Age
Tobacco intake (pack-years) AAT
FVC FEV1 FEV1/FVC
60(6.07) 46.3(2.3)
0.5(0.2) 55.5(7.6) 41.3(3.0) 48.9(5.1)
52.4(3.9) 39.1(5.9) 1.2(0.7) 64.0(7.9) 48.3(6.5) 56.6(6.9)
45.9(5.3) 30.2(5.1) 1.6(0.4) 69.5(8.1) 51.9(9.5) 60.3(8.1)
140.06 43.39 32.10 26.90 12.58 16.35
<0.0001 <0.0001 <0.0001 <0.0001 <0.0001 <0.0001
with deficiency and intermediate level of AAT is statistically significantly higher than the subjects with normal level of enzyme. The mean age is significantly different with each other across these three groups. The mean years of tobacco intake is statistically significantly different with each other across the three groups, in which the mean value of subjects with AAT deficiency is significantly higher than the subjects with intermediate and normal level of AAT. The mean values of AAT, FVC, FEV1 and FEV1/FVC of subjects with deficiency of enzyme are statistically significantly lower when compared with subjects with intermediate and normal level of AAT. The mean values of AAT and FVC are significantly different with each other across the three groups, whereas no significant difference in the mean values of FEV1 and FEV1/FVC between the groups with intermediate and normal level of AAT (Table 1).
Table 2. Comparison of mean values of study and outcome variables between smoker and non-smokers of study subjects with Intermediate level of AAT
Study & Outcome variables
Smokers Non-smokers
t-value p-value 95% confidence interval for difference of means Age AAT FVC FEV1% FEV1/FVC 52.7(4.1) 1.31.1) 54.3(5.6) 39.2(3.5) 47.8(4.9) 52.3(3.8) 1.2(0.2) 67.4(5.4) 51.5(3.8) 59.5(4.5) 0.50 0.30 -11.5 -15.7 -12.0 0.62 0.76 <0.0001 <0.0001 <0.0001 (-1.20,2.01) (-0.23,0.39) (-15.33,-10.83) (-13.80,-10.69) (-13.65,-9.78)
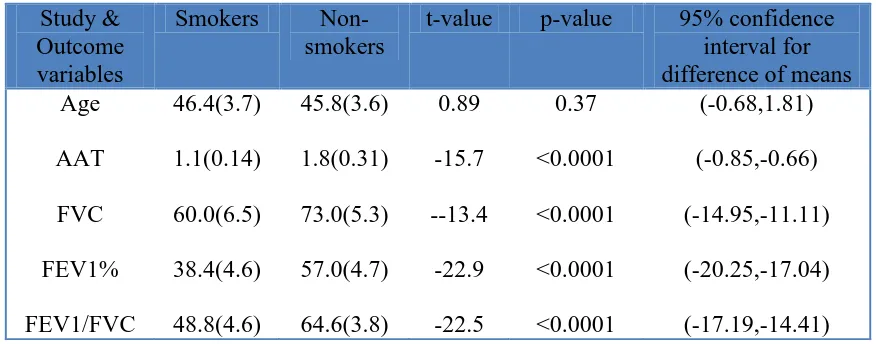
Table 3. Comparison of mean values of study and outcome variables between smokers and non-smokers of study subjects with Normal level of AAT
Study & Outcome variables
Smokers Non-smokers
t-value p-value 95% confidence interval for difference of means Age AAT FVC FEV1% FEV1/FVC 46.4(3.7) 1.1(0.14) 60.0(6.5) 38.4(4.6) 48.8(4.6) 45.8(3.6) 1.8(0.31) 73.0(5.3) 57.0(4.7) 64.6(3.8) 0.89 -15.7 --13.4 -22.9 -22.5 0.37 <0.0001 <0.0001 <0.0001 <0.0001 (-0.68,1.81) (-0.85,-0.66) (-14.95,-11.11) (-20.25,-17.04) (-17.19,-14.41)
[image:4.596.55.539.302.459.2] [image:4.596.79.517.525.697.2]
statistically significant difference in the mean values of FVC, FEV1 and FEV1/FVC, in which the non-smokers are having significantly higher mean values than non-smokers. The 95% confidence intervals for difference of mean of FVC, FEV1 and FEV1/FVC also indicate statistically significant difference, as the intervals do not include the null value ‘0’ of no difference, but no statistically significant difference in the mean values of Age and ATT between smokers and non-smokers (Table 2).
[image:5.596.82.517.329.549.2]The comparison of mean values of age, AAT, FVC, FEV1 and FEV1/FVC between smokers and non-smokers in subjects with normal level of AAT, shows highly statistically significant difference in the mean values of AAT, FVC, FEV1 and FEV1/FVC, in which the non-smokers are having significantly higher mean values than smokers. The 95% confidence intervals for difference of mean of AAT, FVC, FEV1 and FEV1/FVC also indicate statistically significant difference, as the intervals do not include the null value ‘0’ of no difference, and there is no significant difference in the mean values of age (Table 3).
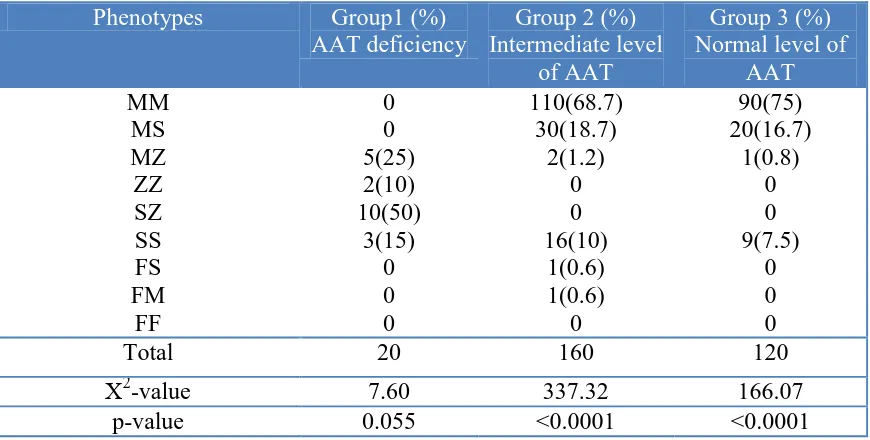
Table 4. Distribution of Phenotypes across the three study groups for COPD patients
Phenotypes Group1 (%) AAT deficiency
Group 2 (%) Intermediate level
of AAT
Group 3 (%) Normal level of
AAT MM
MS MZ ZZ SZ SS FS FM
FF
0 0 5(25) 2(10) 10(50)
3(15) 0 0 0
110(68.7) 30(18.7)
2(1.2) 0 0 16(10)
1(0.6) 1(0.6)
0
90(75) 20(16.7)
1(0.8) 0 0 9(7.5)
0 0 0
Total 20 160 120
Χ2
-value 7.60 337.32 166.07
p-value 0.055 <0.0001 <0.0001
As indicated in (Table 4) there is a highly statistically significant difference in the distribution of type of phenotypes across the 4 study groups (normal, group1, group 2 & group 3) among the COPD patients. In normal group, 70% of subjects were having "MM" phenotypes, 18.5% of them "MS" and 10.5% were having "SS" type of phenotype, with highly statistically significant (χ2
= 335.3, p<0.0001). 50% of patients in group1 were having "SZ" type of phenotype, 25% were having "MZ" type of phenotype while, no statistically significant difference was observed for the remaining 25% of subjects who having "ZZ" and "SS" type of phenotype. In Group2, 68.7% of subjects were having "MM" phenotypes, 18.7% of them "MS" and 10% were having "SS" type of phenotype, which is highly statistically significant ( χ2
= 337.3, p<0.0001). . In Group3, 75% of subjects were having "MM" phenotypes, 16.7% had "MS" and 7.5% of them were having "SS" type of phenotype, which is highly statistically significant ( χ2
Figure 1. Isoelectrical focusing of various AAT variants in the pH range 4-5 with Coomassie Brilliant Blue stain
5. DISCUSSION
This study is an attempt at describing the relative frequencies of AAT phenotypes and associated AAT Concentrations in some Saudi COPD patients. Our patients were defined into three groups according to their AAT levels, group1 (deficiency), group 2 (intermediate) and group3 with normal level of AAT.
The mean age of subjects with deficiency and intermediate level of AAT is statistically significantly higher than the subjects with normal level of enzyme, these results are not incompatible with the results reported of high AAT levels as acute phase protein in the elderly [13] this may be attributed to the presence of deleterious alleles, which decrease AAT level, in those two groups rather than the normal group.
The mean years of tobacco intake of subjects with AAT deficiency is significantly higher than the subjects with intermediate and normal level of AAT. We can infer that the number of cigarettes is directly connected to the existence of COPD. From the spirometry results, including FVC, FEV1 and FEV1/FVC, we found that a high statistically significant difference in the mean values of these lung functions between smokers and smokers for the intermediate and normal groups. Where, the non-smokers are having significantly higher mean values than non-smokers in the two groups. Many studies consider smoking as risk factor for COPD [14, 15], so quit smoking is the best clinical aim associated decreased lung functions reduction in COPD patients [16].
Regarding AAT concentration, it was not statistically significant among the smokers and non- smokers in the group of intermediate level of AAT, while it was significantly higher in non-smokers than smokers in the group of normal level of AAT, although AAT is acute phase protein and smoking cause increasing in its level due to the inflammatory process in the lung [17], smoking can reduce AAT activity due to methionine oxidation at the active site of the protein [18]. In addition, smoking
[image:6.596.66.521.73.270.2]
increases the number of macrophages, neutrophils and T lymphocytes, which secrete some inflammatory mediators into the lung [19].
In our study of 300 COPD patients 20 were identified as having AAT deficiency (group1), 160 with intermediate level of AAT (group2) and 120 having normal concentration (group3). Among the deficient subjects 25% had PiMZ phenotypes followed by PiZZ, SZ and SS with percentage of 10%, 50% and 15%, respectively. People who have two deleterious AAT alleles such as Z, S are at risk for diseases related to AAT deficiency as a results of the lower level of circulating AAT protease inhibitor [5, 6]. The mean of AAT concentration in this group was found to be 0.5 g/l which explained the reduction in pulmonary functions in this group. The obtained results were in agreement with those reported that the threshold of pulmonary damage is less than or equal to 60 mg/dl of AAT concentration [20-22].
The majority of phenotypes of intermediate and normal AAT groups were MM followed by MS, MZ and SS, indicating the relatively high AAT levels with the presence of deleterious alleles.
Also, in the intermediate group, 2 cases having the rare deficiency allele (Pi FS and FM). The appearance of Z, S and F alleles in these two groups reflects the requirement of developing other
tests beside the determination of AAT concentration in the diagnosis of AAT deficiency. The high level of AAT in those groups can be explained by the positive acute phase reaction of AAT and the effect of smoking, which increase the AAT concentration due to the inflammatory process. Some authors reported that acute phase reaction mildly increases AAT concentration in the presence of Z alleles [23, 24]. Others assumed that, there is a mistake in the identification of the migration pattern of the protein [25].
Regarding the role of deleterious alleles (Z and S) in increasing the risk of pulmonary diseases, some authors link MZ phenotype to slightly increase this risk [26, 27], while SZ phenotype strongly increases the risk of COPD, also MS phenotype leads to a small significant increase in COPD risk [26]. Although there are an association between the phenotypes and AAT concentrations, some factors affect this correlation such as, individual variation, AAT is an acute phase protein and the reduction in AAT levels in some liver diseases and malnutrition [28, 29].
4. CONCLUSION
The presence of some at risk phenotypes within the groups of intermediate and normal AAT concentrations reflects the need to an effective test such as phenotyping by isoelectric focusing electrophoresis which provides an early diagnosis of AAT deficiency to decrease disease severity by AAT augmentation therapy and change patient’s lifestyle as quit smoking. Also, phenotyping has advantage over genotyping as it can detect all deficiency alleles, while genotyping detect only the Z and S alleles.
ACKNOWLEDGEMENTS
References
1. P. B. Sorroche, M. F. Acquier, O. L. Jove, E. Giugno, S. Pace, B. Livellara, S. Legal, J.Oyhamburu and M. S. Saez., Arch. Bronconeumol, 51 (2015) 539.
2. D. A. Lomas and H. Parfrey, Thorax, 59 (2004) 529.
3. K. D. Fairbanks and A. S. Tavill. Am. J. Gastroenterol., 103 (2008) 2136. 4. M. Luisetti and N. Seersholm, Thorax, 59 (2004) 164.
5. J. K. Stoller and L. S. Aboussouan, Lancet., 565 (2005) 2225. 6. D. L. De Meo and E. K. Silverman, Thorax, 59 (2004) 259. 7. M. Needham and R. A. Stockley, Thora., 59 (2004) 441.
8. Alpha 1- antitrypsin deficiency: memorandum from WHO meeting. Bull World Health Organ. 75 (1997) 397.
9. A. Jain, K. McCarthy, M. Xu and J. K. Stoller, Chest.,140 (2011) 198.
10. L. J. Donato, R. M. Karras, J. A. Katzmann, D. L. Murray and M. R. Syder. Respir. Res., 16 (2015) 96.
11. T. Sveger and T. Thelin, Acta Paediatr., 89 (2000) 259.
12. American Thoracic Society / European Respiratory Society Statement. Am. J. Respir. Crit. Care Med.,168 (2003) 818.
13. S. Jain, V. Gautam, S. Naseem, J. Pharm. Bioallied. Sci., 3 (2011)118.
14. W. Q. IciencyAn, S. F. Man, A. Senthilselvan, D. D. Sin, Thorax, 59 (2004) 574. 15. J. A. Brebner and R. A. Stockley, Expert. Rev. Respir. Med.,7 (2013) 213. 16. A. Miller and J. M. Raskin, Eur. Respirator. J., 44 (2014) 280.
17. H. Van der Vaart, D. S. Postma, W. Timens, M. N. Hylkema, B. W. Willemse, H. M. Boezen, J. M. Vonk, D. M. de Reus, H. F. Kauffman and N. H. ten Hacken, Respir. Res., 6 (2005) 22. 18. H. G. Serra, C. S. Bertuzzo, M. C. Pereira, C. L. Rossi, W. P. Junior and I. A. Paschoal, J. Bras.
Penumol., 34 (2008) 1019.
19. E. Hinojosa, A. R. Boyd and C. J. Orihuela, JID, 200 (2009) 546.
20. I. Blanco, F. J. de Serres, V. Carcaba, B. Lara and E. Fernandez-Bustillo, Hepat. Mon., 12 (2012) 1.
21. J. K. Stoller, L. S. Aboussouan, Am. J. Respir. Crit. Care. Med., 185 (2012) 246. 22. L. Fregonese and J. Stolk, Orph. J. Rare Dis., 3 (2008) 16.
23. S. P. Holanda, I. Blanco, M. Menéndez and L. Rodrigo, BMC Cancer , 14 (2014) 355.
24. A. R. Koczull, S. Noeske, C. Herr, J. Koepke, R. A. Jorres, C. Nell, S. Schmid, C. Vogelmeier and R. Bals, Res.Med.,106 (2012) 120.
25. J. A. Bornhorst, F. R. Calderon, M. Procter, W. Tang, E.R. Ashwood and R. Mao, J. Clin. Pathol., 60 (2007) 1124.
26. M. Dahl, A. Tybjaerg-hansen, P. Lange, J. Vestbo and B.G. Nordestgaard, Ann. Intern. Med., 136 (2002) 270.
27. M. Dahl, C. P. Hersh, N. P. Ly, C. S. Berkey, E. K. Silverman and B. G. Nordestgaard, Eur. Respir. J., 26 (2005) 67.
28. B. Lisowska-Myiak, Clin. Chim. Acta., 352 (2005) 1.
29. R. F. Ritchie, G. E. Palomaki, L. M. Neveux and O. Navolotskaia, J. Clin. Lab. Anal., 14 (2000) 265.