This is a repository copy of
A pressure swing approach to selective CO2 sequestration
using functionalised hypercrosslinked polymers
.
White Rose Research Online URL for this paper:
http://eprints.whiterose.ac.uk/151506/
Version: Submitted Version
Article:
James, A.M., Reynolds, J., Reed, D.G. et al. (2 more authors) (Accepted: 2019) A pressure
swing approach to selective CO2 sequestration using functionalised hypercrosslinked
polymers. ChemRxiv. (Submitted)
10.26434/chemrxiv.9896873.v1
[email protected]
https://eprints.whiterose.ac.uk/
Reuse
This article is distributed under the terms of the Creative Commons Attribution-NonCommercial-NoDerivs
(CC BY-NC-ND) licence. This licence only allows you to download this work and share it with others as long
as you credit the authors, but you can’t change the article in any way or use it commercially. More
information and the full terms of the licence here: https://creativecommons.org/licenses/
Takedown
If you consider content in White Rose Research Online to be in breach of UK law, please notify us by
A pressure swing approach to selective CO
2sequestration using Functionalised
Hypercrosslinked Polymers
Alex M. James,a Jake Reynolds,a Dan G. Reed,b Peter Styringb and Robert Dawson*a
Functionalised hypercrosslinked polymers (HCPs) with surface areas between 213 1124 m2/g based on a range of monomers containing different chemical
moieties are evaluated for CO2 capture using a pressure swing adsorption (PSA) methodology under humid conditions and elevated temperatures. The
networks demonstrated rapid CO2 uptake reaching maximum uptakes in under 60 seconds. The most promising networks demonstrating the best selectivity
and highest uptakes were applied to a pressure swing setup using simulated flue gas streams. The carbazole, triphenylmethanol and triphenylamine networks were found to be capable of converting a dilute CO2 stream (> 20 %) into a concentrated stream (> 85 %) after only two pressure swing cycles from 20 bar
(adsorption) to 1 bar (desorption). This work demonstrates the ease by which readily synthesised functional porous materials can be successfully applied to a pressure swing methodology and used to separate CO2 from N2 from industrially applicable simulated gas streams under more realistic conditions.
Broader Context
The capture of carbon dioxide emissions from power generation and industry are a major challenge in the effort to prevent irreversible climate change. Porous materials are one potential solution due to their high surface areas and tunability of the interactions between the adsorbent surface and CO2 via chemical functionalisation. In comparison with traditional chemical binding of CO2 (chemisorption), the relatively weak physical interaction between the porous
CO2 (physisorption) allows the adsorbent to be easily recycled. Most previous studies using porous materials have used the difference in temperature between the adsorption and desorption processes for the regeneration of the adsorbent (temperature swing), however this process comes with a significant energy penalty. In this study we investigate the use of a lower energy pressure swing process. Here, the adsorbent is loaded with a simulated mixture of flue gas at high pressure. Over a series of decompression steps, the released gas mixture can be enriched in CO2 due to its preferential binding to the adsorbent.
Introduction
The 2015 Paris Agreement aims to limit the average global temperature increase to 2°C. One of the key causes of climate change is anthropogenic carbon dioxide, and recently the UK government has committed to a net zero emissions target by 2050. In the long term the most effective method to lower carbon dioxide (CO2)emissions is to switch to renewable energy sources. However, the transition to renewable energy such as solar and wind is likely to take decades hence the continued reliance on non-sustainable energy sources.1,2 In order to meet the short to medium term emissions targets, the capture, storage and utilisation of CO2 from large anthropogenic point sources such as fossil fuel power plants and the steel industry, is key to mitigating the ever increasing levels of CO2 in the atmosphere thereby preventing irreversible climate change.3
One of the key challenges facing materials for carbon capture from anthropogenic point sources is the low
concentration of CO2 in flue gas streams is often around or lower than 20%. The remaining volume is comprised largely of N2 with smaller amounts of water vapour, oxygen, SO2 and NOx (amongst others).4 In order to capture CO
2 efficiently, any capture process therefore needs to show high selectivity towards CO2.
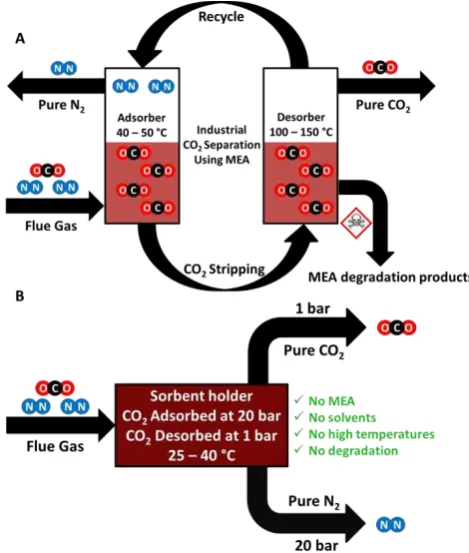
The current state-of the-art industrial method of capturing CO2, dubbed amine scrubbing, has remained unchanged for decades and involves the use of aqueous solutions of amines such as monoethanolamine (MEA) as shown in figure 1a.5 This process relies on chemisorption, by which the MEA selectively reacts with CO2 to form a carbamate salt.
Figure 1. (a) Simplified industrial CO2 capture process using MEA as a
liquid sorbent to separate out CO2 from industrial flue gas. (b) The ideal
pressure swing approach which could be utilised to separate out CO2 from
[image:2.595.308.543.414.691.2]Over the past few years there has been a move away from the amine scrubbing process due to significant and numerous drawbacks. These include the chemisorption process requiring very high temperatures (ca. 130 °C) to liberate the CO2 and regenerate the free amine. Attaining these high temperatures is a challenge for industry and comes at a high price both fiscally and environmentally. Nonsensically in order to power this process one has to produce CO2 to capture CO2.6 Other issues include the corrosive nature of the amine solution along with the sensitivity of such solvents to other gaseous impurities present in the flue gas such as SOx and NOx.7 9 This results in continuous degradation as well as evaporation meaning the amine solution needs to be changed on a regular basis thereby raising the operating cost of the process.10 Due to the difference in the temperature at which the reaction of amines and CO2 react compared to the temperature required to regenerate the amine, this process is known as a temperature swing approach. Due to the high energy penalty required by the regeneration temperature, this method is not ideal for the capture of CO2. In contrast, a physisorption process, whereby the interaction between adsorbent and adsorbate is weaker yet still significant enough for the binding of CO2 to the substrate surface, requires much less energy to regenerate the free material and liberate the pure gas.3,8
Most reports of new materials for carbon capture use a temperature swing approach. There is much less literature relating to adsorbents using the alternative pressure swing approach. Pressure swing adsorption (PSA) technology is a growing body of research which is compatible with solid sorbents and has the potential to optimise and replace the current temperature swing technologies applied in industry.11,12 In a pressure swing approach CO2 is adsorbed at high pressures by a solid sorbent before being desorbed at low pressures (figure 1b), or under slight vacuum (VPSA). Different sorbents require different pressure profiles but are typically around 10-30 bar in the adsorption cycle. In comparison to temperature swing, PSA is an inherently low energy technique for which high temperatures are not required during adsorption or desorption. PSA is also a much faster technique compared to temperature swing as there is no thermal lag meaning that the adsorb/desorb cycle can be performed rapidly. There is much scope for variation with PSA such as optimisation of the sorbent, the working pressures and temperatures of the process, all of which can be varied to yield the most efficient and effective system.
In order for a material to be considered a viable choice as a solid sorbent for pressure swing adsorption, certain criteria have to be met. These include; the material being stable and selective towards CO2 at both low and high pressures. The material must demonstrate good recyclability over many pressure cycles. Furthermore, it is desirable to be both cheap and relatively simple to make with good yields due to the scale of the process and to keep the cost low.
Over the last two decades, as interest in carbon dioxide capture/utilisation, CCS/CCU, has accelerated numerous sorbents demonstrating CO2 capturing capabilities have been reported mainly using the temperature swing approach.3,7,8,13
These include zeolites,14 hybrid materials such as metal organic frameworks (MOFs),15 activated carbons, ionic liquids,16,17 and microporous organic polymers (MOPs).18 24
MOPs are a family of porous materials comprised solely of the lighter elements of the periodic table. There are a large number of different sub-classes of MOP such as; conjugated microporous polymers (CMPs)25 27, covalent organic frameworks (COFs)28 31, covalent triazine frameworks (CTFs)32,33, polymers of intrinsic microporosity (PIMs)34 37 which have been applied to various applications ranging from chemosensing,32,38 40 catalysis41 44 and waste water treatment.45 48 CO
2 uptakes of MOPs are typically measured at conditions of around 1 bar and at temperatures ranging from 273-298 K. Some of the best performing MOPs include functionalised networks containing amine groups with uptakes of around 15-20 wt. % at 1 bar and 273 K.49,50 At higher pressures materials such as PAF-1 and PPN-4 have a reported uptake of 130 wt. % (40 bar, 298 K)51 and 212 wt. % (50 bar, 295 K)52 respectively. However, one class of MOP stands out for the application of carbon dioxide capture due to their low skeletal density, chemically and thermally stability and synthesis using cheap, readily available starting materials on a large scale hypercrosslinked polymers (HCPs).20 22,53 At high pressures there are however relatively few studies. HCPs based -bis(chloromethyl)- -biphenyl (BCMBP) were shown to have uptakes of up to 58.7 wt. % at 30 bar.21 While this falls short of the PAF/PPN materials, HCP synthesis is considerably less complex and cheaper.
Hypercrosslinked polymers are rigid porous networks with typical surface areas in the range of 500-2000 m2/g.54 56 Their synthesis is often based on Friedel-Crafts chemistry using a Lewis-acid catalysts such as iron (iii) chloride to yield a highly crosslinked and permanently microporous insoluble solid product. HCP synthesis requires the use of crosslinking groups, such as methyl chlorides often
57,58 or external crosslinkers such as formaldehyde
dimethyl acetal (FDA).59T
potentially any rigid aromatic monomer to be hypercrosslinked.
Crucially the
incorporation of a range of chemical functionalities into the networks by polymerisation of pre-functionalised monomers. This has led to the investigation of HCPs for a variety of different applications.20,60 62 For CO
In this work we report the synthesis, characterisation and implementation of functional HCP networks for use as solid sorbents using a PSA approach. The CO2 uptake capacity and uptake kinetics are measured at high pressure followed by measurements using simulated flue gas compositions. The CO2:N2 selectivity of the materials is calculated and the recyclability potential of the HCPs is evaluated. Further to this, in order to keep the study industrially applicable all samples were exposed to simulated gas streams and the materials themselves were exposed to the humid laboratory conditions and not used straight out of the oven.
Experimental
Materials
Anhydrous 1,2-dichloroethane (DCE, > 99%), iron (III) chloride (FeCl3, 97%) and formaldehyde dimethyl acetal (FDA, >99%), BINOL (>99%), dibenzyl ether (>99%) and poly(styrene) (Mn=280 000 g/mol) were all purchased from Sigma-Aldrich. Triphenylmethanol (Lancaster synthesis, >99%), carbazole (Alfa Aesar, 95%) and triphenylamine (Fluorochem >99%) were used as received. All chemicals were used as received unless stated otherwise.
Synthesis of HCPs
Hypercrosslinked porous polymers were synthesised via the using functional aromatic monomers. All reactions were performed under a nitrogen atmosphere (see Table S1 for quantities). Using triphenylmethanol as an example; triphenylmethanol (3.00 g, 11.54 mmol, 1 eq.) was added to a 2-necked round bottom flask which was degassed by three freeze-pump-thaw cycles. To this vessel DCE (60 mL) and FDA (7.65 mL, 86.57 mmol, 7.5 eq.) were added along with a slurry of FeCl3 (14.02 g, 86.57 mmol, 7.5 eq.) in DCE. The reaction was heated to 80 °C and left for 16 h to afford a solid black product. The crude black product was washed and filtered with methanol before being solvent extracted with methanol using Soxhlet apparatus overnight. The black solid was washed and filtered with chloroform and methanol before being left to dry overnight under vacuum at 60 °C.
Characterisation
Fourier transform infrared (FTIR) spectroscopy was performed using a Perkin-Elmer Spectrum 100 fitted with an attenuated total reflectance tip (ATR). Solid-State NMR samples were packed into 4 mm zirconia rotors and transferred to a Bruker Avance III HD spectrometer. 1D 1H-13C cross-polarisation magic angle spinning (CP/MAS) NMR experiments were measured at 125.76 MHz (500.13 MHz 1H) at a MAS rate of 10.0 kHz. The 1H -pulse phase modulation (TPPM) decoupling was used during the acquisition. The Hartmann-Hahn condition was set using hexamethylbenzene. The spectra were measured using a contact time of 2.0 ms. The relaxation delay D1 for each sample was individually determined from the proton T1 measurement (D1 = 5 × T1). Samples were collected until sufficient signal to noise was observed, typically greater than 256 scans. The values of the chemical shifts are referred to that of TMS. Gas sorption measurements were performed using
[image:4.595.308.550.135.385.2]a Micromeritics ASAP 2020 Plus analyser employing high purity gases. Approximately 100 mg of sample was degassed at 120 °C for 16 h under dynamic vacuum immediately prior to analysis. BET surface areas were calculated using nitrogen gas at 77 K over a pressure range of 0.01-0.15 P/P0.
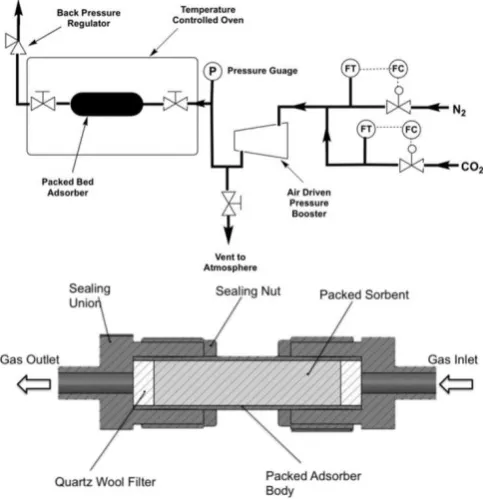
Figure 2. (Above) Simplified flow diagram of the experimental apparatus setup used during the high pressure testing. (Below) Cross-sectional view of the packed-bed adsorber used for CO2 separation at high pressures. Figures
reproduced with permission from ref. 66. Copyright 2017, Reed, Dowson and
Styring.
High pressure adsorption experiments were carried out in an identical way to that previously reported by Reed et al.66 using a bespoke packed-bed adsorption column constructed “ (Fig. 2) piping and fitting using a Jasco BP-1580-81 back pressure regulator, an Omega PX409USB High Accuracy Pressure Transducer, a 42AAV48 Midwest Pressure Systems Gas Pressure Booster, and an AND GF-1000 High Capacity 3 decimal place balance. The reactor was isolated from the system using valves and the assembly weighed on the balance. Desorption was measured by slowly opening the valves while still on the balance. Supported sorbent packed densities were measured using a Micromeritics AccuPyc 1340 Pycnometer.
volumes of the sorbent (VS) and quartz wool (VQ) were found using the density data obtained from the pycnometer measurements. These volumes were subtracted from the total internal volume to give the void space as shown in Eq. 1.
Eq. 1
The CO2 capacity of the sorbent was calculated using a static gas pressure and was carried out using pure CO2 gas. The starting weight of the packed adsorber was taken before the gas was introduced. Pure CO2 then enters the adsorber and the total weight increase of the system was determined (MT). This was achieved by closing the valves to the reactor, removing it from the system and placing it on the balance, the mass of the empty assembly having previously been measured. The mass increase was attributed to the CO2 that had been adsorbed onto the sorbent (Mads) and CO2 in the void space (Mvoid). In order to find the mass of CO2 in the void space, the density of the gas at that specific pressure and temperature was determined. This void space mass (Mvoid) was removed from the total mass increase (MT). The remaining mass (Mads) was then attributed to the gas that had adsorbed onto the sorbent (Eq. 2)
Eq.2
Live IR tracking was carried out via non-dispersive infrared absorption using a CM-40401 SprintIR6S high speed CO2 sensor, capable of taking 20 readings per second accurate to 70 ppm, purchased from CO2Meter. The detector was calibrated using a pure stream of N2 gas. Data was analysed using GasLab
®
version 2.0.8.14 which allowed for CO2 output to be presented as a % concentration.Results and Discussion
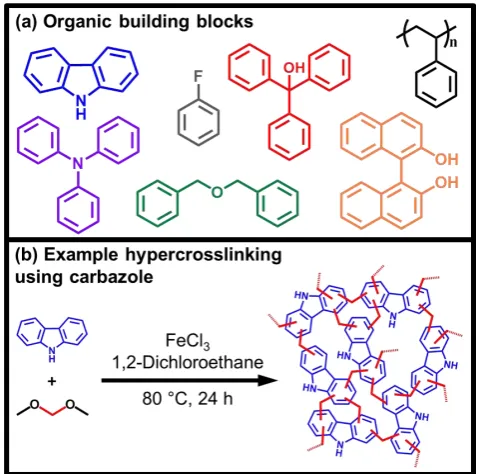
Seven hypercrosslinked polymers were synthesised from functionalised monomers all possessing different chemical moieties purposefully to see how these groups affected the CO2 uptake and selectivity at high pressure. Monomers including alcohol functionalities (triphenylmethanol and BINOL), amine functionality (2° amine carbazole and 3° amine triphenylamine), halogens (fluorobenzene) and a newly synthesised network based on dibenzyl ether which contains ether linkages were all hypercrosslinked (Figure 3). Further to this, a non-functionalised network was synthesised from polystyrene which provides a good comparison between the functionalised and non-functionalised networks. Whilst hypercrosslinked polymers made from poly(styrene),67 carbazole,68 BINOL,20 triphenylamine69 and fluorobenzene60 have previously been reported, this is to our knowledge the first reported synthesis of networks synthesised from dibenzyl ether and triphenylmethanol.
Figure 3. Schematic representation of HCP synthesis using the so-called
E
this work, Poly(styrene), triphenylmethanol, BINOL, carbazole,
triphenylamine,dibenzyl ether andfluorobenzeneand (b) an example of
the hypercrosslinking synthesis.
All networks were obtained in good yields (Table S1) similar to that found for other HCPs.20,59Structural characterisation of the HCPs was performed by elemental analysis (Table S2), infrared spectroscopy (FT-IR) (Figure S1) and 13C solid state CP/MAS NMR spectroscopy (ssNMR) (Figures 4 & S2). Calculated %C, H and N of the networks were found to be typical for HCPs synthesised via Friedel-Crafts alkylation. There is some variation from the expected values as these are calculated assuming an idealised structure in which all protons have been exchanged for a methylene bridge. The presence of end groups and adsorbed molecules such as CO2 and water vapour may also contribute to the deviation from theoretical values. Nitrogen values of 5.17 % and 4.35 % were observed for the carbazole and triphenylamine networks respectively, indicating successful incorporation of amines into the structure.
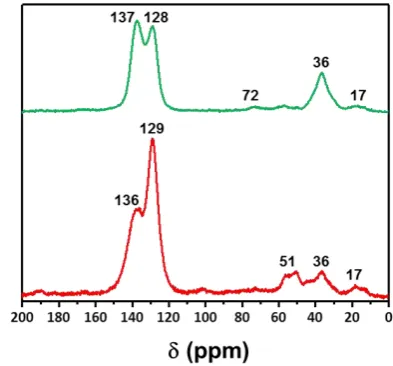
[image:5.595.308.548.65.302.2]Figure 4. CP/MAS solid state 13C NMR spectra of the dibenzyl ether
(above) and triphenylmethanol (below) networks
13C ssNMR spectra were collected for all samples and can be
seen in Figure S2 whilst the spectra for the two newly synthesised materials are presented in figure 4. All networks showed two prominent signals at ca. 140 and 130 ppm corresponding to quaternary aromatic carbons (CAr) and aromatic CAr-H. Signals at 36 ppm are assigned to methylene bridges in the networks. The resonance at 51 ppm for the triphenylmethanol network is assigned to the C-OH. For the dibenzyl ether network a resonance at 72 ppm is assigned to the CH2-O-CH2 carbons adjacent to the ether linkage. A further resonance is observed at ca. 17 ppm and is attributed to unreacted end groups arising from the FDA crosslinker.
Figure 5. Full gas sorption isotherms for all polymer networks synthesised. Poly(styrene), triphenylmethanol, BINOL, carbazole, triphenylamine
dibenzyl ether andfluorobenzene
The porosity of the networks was measured using nitrogen adsorption/desorption isotherms at 77 K (Figure 3). BET surface areas were calculated over a relative pressure range (P/P0) of 0.01 0.15 with the total pore and micropore volumes calculated at 0.95 and 0.1 P/P0 respectively (Table 1). All networks adsorbed large volumes of nitrogen at low relative pressure (<0.1 P/P0), indicating the presence of micropores. All
networks demonstrated further uptake at higher partial pressures. This was particularly noticeable for the poly(styrene) network which demonstrates a Type II hysteresis loop on the desorb indicative of further larger (meso)pores as previously reported.67
All samples were found to be porous with surface areas ranging from 213 m2/g to 1124 m2/g. The highest surface area was found to be derived from the polystyrene network and is similar to that reported previously in the literature.67 Overall the inclusion of functionality into the networks results in a lower surface area than non-functionalised HCPs. Functional 3D monomers however such as BINOL are still able to produce relatively high surface are networks. Despite their lower surface areas, the effects of the functionality are still interesting for CO2 capture and the potential for increased selectivity over nitrogen.
The total pore volumes of the materials ranged from 0.14 cm3/g to 1.01 cm3/g with the fluorobenzene and polystyrene derived HCPs showing the lowest and highest pore volumes respectively as might be expected from the highest and lowest surface area networks. As a proportion of pore volume (V0.1/Vtot) both carbazole and fluorobenzene showed the largest contribution of micropores while dibenzyl ether was found to have a larger proportion of meso- and macropores. It has been previously reported that smaller pores are preferential over larger pores for CO2 capture particularly at lower pressures where the uptake has not reached a maximum. It was hypothesised that the networks with a larger % of micropores may therefore be better suited towards CO2 capture than those possessing larger pores at 25 bar.70
Kinetic uptake of CO2
High pressure CO2 adsorption experiments were conducted using the setup as previously reported by Reed and co-workers.16,66 Briefly, an adsorbent was packed into a sealed unit which was exposed to high pressures of gas before being weighed to gravimetrically determine CO2 uptake. All samples were measured three times and an average of the data was taken and used. All measurements on the functionalised HCPs were recorded at 40 °C to more closely match cooled flue gas temperatures from industrial sources. The stack temperature can vary depending on the process but can be 120 °C for post-combustion processes, 250-350 °C from steel plants and over 1000 °C for smelting works. As such, the flue gas temperatures need to be reduced to values where absorption or adsorption are feasible. Moisture vapour is also an important consideration when for post-combustion capture,4,19 therefore all samples were tested under conditions. More specifically, after synthesis the samples were dried under vacuum at 60 °C before being allowed to adsorb moisture from the air at 40-50% humidity for at least 24 h before all adsorption measurements. These conditions allow for results more comparable to those used in industry where gas mixtures are hydrated.
[image:6.595.52.286.434.624.2]Table 1. Gas sorption properties for all polymer networks
Functional group Polymer SABET (m2/g)a Vtot (cm3/g)b V0.1 (cm3/g)c V0.1/Vtot
N/A Poly(styrene) 1124 1.01 0.42 0.42
OH Triphenylmethanol 781 0.48 0.30 0.63
BINOL 888 0.45 0.35 0.70
R O R Dibenzyl ether 397 0.39 0.14 0.36
NRx
Carbazole 445 0.24 0.17 0.71
Triphenylamine 630 0.37 0.24 0.65
X Fluorobenzene 213 0.14 0.10 0.71
a Apparent BET surface areas were determined over the pressure range (P/P0) = 0.01 0.15. b Total pore volume calculated at 0.99 P/P0 c Micropore volume calculated
at 0.1 P/P0
saturation at 10 and 20 bar was therefore measured (Figure 6). At 20 bar all HCP networks become fully saturated rapidly with t90 values (the time at which 90% of the total uptake is completed), of 85 seconds or less (Table S5), while at the lower pressure of 10 bar the time to reach saturation was up to 3 mins with the hydrophilic networks triphenylalcohol and BINOL taking longest and the hypdrophobic networks poly(styrene) and fluorobenzene the shortesrt. The rapid sorption period is advantageous should these materials be applied to an industrial PSA approach given that the less time the material has to spend at elevated pressures to greater the economic and energy benefit.
Figure 6. Kinetic studies of CO2 uptake, for each functionalised polymer
network at 40 °C and 10 bar (left) and 20 bar (right). HCPs colours are as follows: Poly(styrene), triphenylmethanol, BINOL, carbazole,
triphenylamine,dibenzyl ether andfluorobenzene
At 10 bar the two OH containing networks (Triphenylmethanol and BINOL) perform the best reporting final uptakes of around 13 and 14 % wt. respectively. Alcohol containing porous polymers have previously been shown to demonstrate good CO2 capture capabilities, there measurements further demonstrate the advantage of such functionalities at higher pressures.20,71 The highest surface area material the non-functional poly(styrene) shows uptake at 10 bar at around 11 % wt. This material has a much higher surface area than the two alcohol materials yet still underperforms in comparison to the alcohol networks. At the same time this non-functionalised network outperforms other functionalities, demonstrating that both surface area and functionality is important when designing materials for CCS. The amine containing networks, (triphenylamine and carbazole) and the two other networks, (fluorobenzene and the newly synthesised dibenzyl ether), all perform less well with uptakes ranging from 6 % wt. to 10 % wt.
At 20 bar all samples show increased uptake of CO2 compared to 10 bar. The triphenylmethanol network continues to show the highest final uptake of around 22 % wt., yet at this elevated pressure the poly(styrene) network is the second best performing material with an uptake of just over 20 % wt. The BINOL network shows a final uptake of just under 17 % wt. The reversal of these two materials may demonstrate that at higher pressures, higher surface area may
be more advantageous than chemical functionality. Though, should this be true then, one may expect the fluorobenzene network to show the lowest uptake given its low surface area. In fact, the fluorobenzene network and the triphenylamine network show similar uptakes despite having a surface area being almost 3× lower for fluorobenzene. In this case we attribute the effect to the presence of water which is co-adsorbed in each network. It is known that the presence of water can be detrimental to CO2 adsorption and the presence of the hydrophobic fluoride functionality may aid the adsorption of CO2 by the network compared to the higher surface area hydrophilic amine functionalised triphenylamine network. The newly synthesised dibenzyl ether network shows the poorest uptake at ~12 % wt. This poor performance, despite a reasonable surface area, could be somewhat due to the presence of larger pore sizes dominating the material. In comparison, the triphenylmethanol, carbazole and fluorobenzene networks have a greater proportion of smaller micropores aiding their uptake under these conditions.
Selectivity measurements
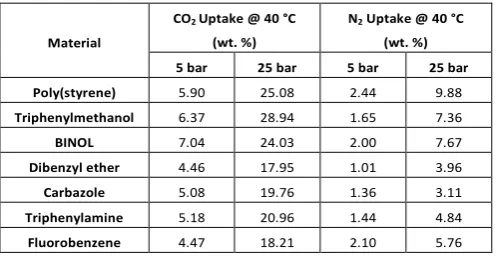
In order to investigate how selective the networks were for CO2 over that of the major component of flue gas (N2), the uptake of both CO2 and N2 was measured for each HCP network at pressures between 5 and 25 bar at a temperature of 40 °C (Figures S4 & S5). HCP networks were exposed to a pressurised stream of either pure CO2 or N2 for a 5-minute adsorption period, the time at which the previous kinetic runs showed to be sufficient for equilibration, after which the gravimetric uptake was recorded and the average uptake calculated over three runs. Using these experiments it is possible to estimate the CO2:N2 selectivity of the networks at high pressures typical for PSA.
Table 2. Average CO2 and N2 uptake capabilities for all polymer networks
at 40 °C at both 5 and 25 bar
Material
CO2 Uptake @ 40 °C
(wt. %)
N2 Uptake @ 40 °C
(wt. %) 5 bar 25 bar 5 bar 25 bar Poly(styrene) 5.90 25.08 2.44 9.88
Triphenylmethanol 6.37 28.94 1.65 7.36
BINOL 7.04 24.03 2.00 7.67
Dibenzyl ether 4.46 17.95 1.01 3.96
Carbazole 5.08 19.76 1.36 3.11
Triphenylamine 5.18 20.96 1.44 4.84
[image:7.595.305.554.592.721.2]All of the networks demonstrated much higher uptakes of CO2 than N2 under identical adsorption conditions (Table 2), typically > 3 5× higher than the respective N2 uptake thereby demonstrating a preference to adsorb CO2 over N2. The CO2 uptake at 25 bar is in line with the kinetic uptakes at 20 bar which shows the triphenylmethanol and poly(styrene) networks to be the best performing materials with uptake exceeding 25 % wt., while the dibenzyl ether network showed the lowest uptake of below 18 % wt. The nitrogen uptake of the networks correlates well with the BET surface areas of the materials, exhibiting no strong interaction with the network surface functionalities except for the hydrophobic fluorobenzene network which shows higher N2uptake than three networks with higher surface areas which we attribute to the relative hydrophobicity of the fluorobenzene network.
Figure 7. CO2:N2 selectivity of networks at 40 °C and 5 bar (solid bars) and 25
bar (dashed bars).
The selectivities for each network were calculated from the CO2 and N2 uptakes at 5 and 25 bar (Figure 7) with those for the functional networks shown to be generally higher than for the non-functionalised, yet high surface area, poly(styrene) network. Interestingly the operating pressure has little effect on the overall selectivity of the networks with the selectivity at 5 bar similar to that at 25 bar. At 5 bar the dibenzyl ether network showed the highest selectivity, while at the higher pressure of 25 bar used for PSA the triphenylamine network was found to have the highest selectivity of 4:1. Both the alcohol containing triphenylamine and BINOL networks showed good selectivities of around 4:1 and 3.5:1 respectively which combined with their high CO2 uptake would make them the most promising materials for PSA.
Whilst some insight into the selectivity of the materials can be derived using pure gas streams, the use of mixed gas streams is more representative of actual industrial flue gas. To investigate how the materials performed at enriching a CO2 stream the most promising materials were exposed to a gas mix
comprised of an 80:20 N2:CO2 at 40 °C and 20 bar for 5 minutes. The concentration of CO2 in the output gas was measured at 20 bar, after which the pressure was then released from the adsorber. When the pressure reaches 1 bar the concentration of CO2 was calculated by IR. Finally, the same experiment was repeated using a stream comprised of 50:50 N2:CO2 mix at 40 °C (Figure 8). This test would replicate two cycles whereby the output from the first cycle is fed back in to the PSA setup and the method is repeated once again.
Figure 8. CO2 concentration of the input gas (solid bar) and the
output exhaust gas stream at 1 bar (dashed bars) at 40 °C.
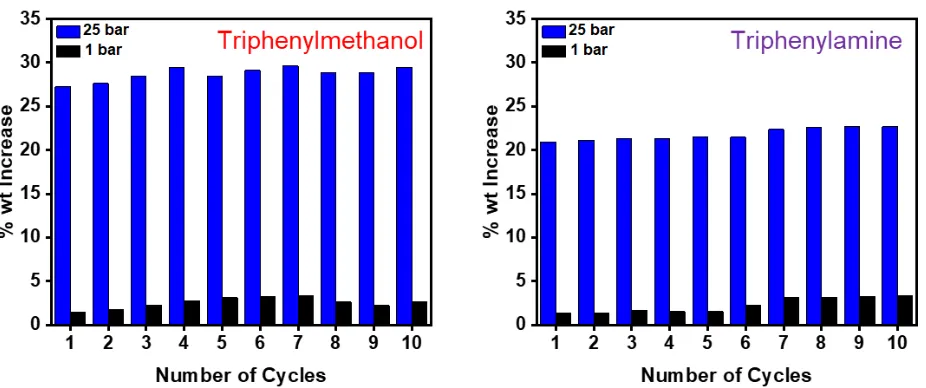
[image:8.595.318.538.138.291.2] [image:8.595.68.261.250.426.2]Figure 9. Recyclability studies for triphenylmethanol (left) and triphenylamine (right) networks during 10 adsorb/desorb cycles of CO2 at 25 bar and
40 °C.
Finally, the ability of the sorbents to be used over repeat adsorption-desorption cycles was tested using the best performing triphenylmethanol and triphenylamine networks (Figure 9). These networks were exposed to a 25 bar stream of CO2 before having the pressure reduced to 1 bar with the uptakes at each pressure recorded and was repeated for 10 cycles. Importantly, as in a typical PSA process the materials were not exposed to a vacuum between runs to remove any CO2 as not to further increase the energy demands of the process. Both materials reached a maximum uptake at 25 bar and this was found to reproducible over the 10 cycle run demonstrating no loss in performance over time. Both samples retained some gas at 1 bar though this was quantity was minimal (<3% wt.) and had no significant effect on the uptake at higher pressures.
Conclusion
To conclude, a series of functional porous materials synthesised via conventional hypercrosslinking chemistry were applied as sorbents to selectively separate out CO2 from simulated flue gas mixes. The uptake capacity, uptake rate and CO2:N2 selectivity at high pressure were all thoroughly examined in order to test the materials at high pressure and using a pressure swing approach. The best performing materials were then taken forward and applied towards actual pressure swing separation experiments using simulated gas mixtures representative of those in industry. Finally, the recyclability of the optimum materials were tested to investigate if their performance was hindered after multiple adsorb/desorb cycles. All materials were found to uptake CO2 rapidly with most of the uptake being complete within 2 minutes with the OH functionalised and non-functional poly(styrene) network showing the highest CO2 capacity. Due to their high and selective uptakes both the triphenylmethanol and triphenylamine networks were taken forward and applied to an actual pressure swing approach where it was found that after only two cycles they were able to convert a 20% CO2 stream into one exceeding 85% CO2. This was an excellent example of how cheaply synthesised porous materials can be easily synthesised and applied to a pressure swing methodology demonstrating excellent CO2:N2
capabilities. It is hoped that this work inspires more research into PSA techniques so as to improve on the current energy intensive and fiscally demanding temperature swing techniques rife throughout industry.
Conflicts of interest
There are no conflicts to declare.
Acknowledgements
PS would like to thank the ESPRC for funding of the CO2Chem Grand Challenge Network (EP/K007947/1 and EP/P026435/1). Dr. Sandra van Meurs is thanked for running solid state NMR samples.
Notes and references
1 International Energy Agency, World Energy Outlook 2008, 2008, vol. 23.
2 M. E. Boot-Handford, J. C. Abanades, E. J. Anthony, M. J. Blunt, S. Brandani, N. Mac Dowell, J. R. Fernandez, M.-C. Ferrari, R. Gross, J. P. Hallett, R. S. Haszeldine, P. Heptonstall, A. Lyngfelt, Z. Makuch, E. Mangano, R. T. J. Porter, M. Pourkashanian, G. T. Rochelle, N. Shah, J. G. Yao and P. S. Fennell, Energy Environ. Sci., 2014, 7, 130 189. 3 A. Samanta, A. Zhao, G. K. H. Shimizu, P. Sarkar and R.
Gupta, Ind. Eng. Chem. Res., 2012, 51, 1438 1463. 4 T. C. Drage, C. E. Snape, L. A. Stevens, J. Wood, J. Wang, A.
I. Cooper, R. Dawson, X. Guo, C. Satterley and R. Irons, J. Mater. Chem., 2012, 22, 2815 2823.
5 A. J. Reynolds, T. V. Verheyen, S. B. Adeloju, E. Meuleman and P. Feron, Environ. Sci. Technol., 2012, 46, 3643 3654. 6 M. Oschatz and M. Antonietti, Energy Environ. Sci., 2017,
11, 57 70.
7 D M D A B “ J R L Angew. Chemie Int. Ed., 2010, 49, 6058 6082.
W D O H ) ) Energy Environ. Sci., 2014, 7, 3478 3518.
9 P. Luis, Desalination, 2016, 380, 93 99.
10 O. Aschenbrenner and P. Styring, Energy Environ. Sci., 2010, 3, 1106 1113.
11 J. Schell, N. Casas, D. Marx and M. Mazzotti, Ind. Eng. Chem. Res., 2013, 52, 8311 8322.
12 L. Riboldi and O. Bolland, Energy Procedia, 2017, 114, 2390 2400.
13 P. Markewitz, W. Kuckshinrichs, W. Leitner, J. Linssen, P. Zapp, R. Bongartz, A. Schreiber and T. E. Müller, Energy Environ. Sci., 2012, 5, 7281.
14 M. Abu Ghalia and Y. Dahman, Energy Technol., 2017, 5, 356 372.
15 M. Ding, R. W. Flaig, H.-L. Jiang and O. M. Yaghi, Chem. Soc. Rev., 2019, 48, 2783 2828.
16 G. R. M. Dowson, D. G. Reed, J.-M. Bellas, C. Charalambous and P. Styring, Faraday Discuss., 2016, 192, 511 527. 17 S. Supasitmongkol and P. Styring, Energy Environ. Sci.,
2010, 3, 1961 1972.
18 L. Tan and B. Tan, Chem. Soc. Rev., 2017, 46, 3322 3356. 19 R. T. Woodward, L. A. Stevens, R. Dawson, M.
Vijayaraghavan, T. Hasell, I. P. Silverwood, A. V Ewing, T. Ratvijitvech, J. D. Exley, S. Y. Chong, F. Blanc, D. J. Adams, S. G. Kazarian, C. E. Snape, T. C. Drage and A. I. Cooper, J. Am. Chem. Soc., 2014, 136, 9028 9035.
20 R. Dawson, L. A. Stevens, T. C. Drage, C. E. Snape, M. W. Smith, D. J. Adams and A. I. Cooper, J. Am. Chem. Soc., 2012, 134, 10741 10744.
21 C. F. Martin, E. Stöckel, R. Clowes, D. J. Adams, A. I. Cooper, J. J. Pis, F. Rubiera and C. Pevida, J. Mater. Chem., 2011, 21, 5475 5483.
22 R. Dawson, A. I. Cooper and D. J. Adams, Polym. Int., 2013, 62, 345 352.
23 R. Dawson, E. Stöckel, J. R. Holst, D. J. Adams and A. I. Cooper, Energy Environ. Sci., 2011, 4, 4239 4245. 24 R. Dawson, D. J. Adams and A. I. Cooper, Chem. Sci., 2011,
2, 1173 1177.
25 J. X. Jiang, F. Su, A. Trewin, C. D. Wood, N. L. Campbell, H. Niu, C. Dickinson, A. Y. Ganin, M. J. Rosseinsky, Y. Z. Khimyak and A. I. Cooper, Angew. Chemie - Int. Ed., 2007, 46, 8574 8578.
26 J. Schmidt, M. Werner and A. Thomas, Macromolecules, 2009, 42, 4426 4429.
27 D. J. Woods, R. S. Sprick, C. L. Smith, A. J. Cowan and A. I. Cooper, Adv. Energy Mater., 2017, 1700479, 1700479. 28 J. L. Segura, M. J. Mancheño and F. Zamora, Chem. Soc.
Rev., 2016, 45, 5635 5671.
29 A P C A I B N W O M O K A J Matzger and O. M. Yaghi, Science (80-. )., 2005, 310, 1166 1170.
30 S. Dalapati, S. Jin, J. Gao, Y. Xu, A. Nagai and D. Jiang, J. Am. Chem. Soc., , DOI:10.1021/ja4103293.
31 P. Kuhn, M. Antonietti and A. Thomas, Angew. Chemie Int. Ed., 2008, 47, 3450 3453.
32 A. Bhunia, D. Esquivel, S. Dey, R. Fernández-Terán, Y. Goto, S. Inagaki, P. Van Der Voort and C. Janiak, J. Mater. Chem.
A, 2016, 4, 13450 13457.
33 Y. Fu, W. Yu, W. Zhang, Q. Huang, J. Yan, C. Pan and G. Yu, Polym. Chem., 2018, 9, 4125 4131.
34 P. M. Budd, B. S. Ghanem, S. Makhseed, N. B. McKeown, K. J. Msayib and C. E. Tattershall, Chem. Commun., 2004, 230. 35 N. B. McKeown, ISRN Mater. Sci., 2012, 2012, 1 16. 36 P. M. Budd, K. J. Msayib, C. E. Tattershall, B. S. Ghanem, K.
J. Reynolds, N. B. McKeown and D. Fritsch, J. Memb. Sci., 2005, 251, 263 269.
37 D. Ramimoghadam, E. M. Gray and C. J. Webb, Int. J. Hydrogen Energy, 2016, 41, 16944 16965.
38 H. Ma, B. Li, L. Zhang, D. Han and G. Zhu, J. Mater. Chem. A, 2015, 3, 19346 19352.
39 A. Deshmukh, S. Bandyopadhyay, A. James and A. Patra, J. Mater. Chem. C, 2016, 4, 4427 4433.
40 X. Wu, H. Li, B. Xu, H. Tong and L. Wang, Polym. Chem., 2014, 5, 4521 4525.
41 J. Luo, J. Lu and J. Zhang, J. Mater. Chem. A, 2018, 6, 15154 15161.
42 R. M. N. Kalla, M.-R. Kim and I. Kim, Ind. Eng. Chem. Res., 2018, 57, 11583 11591.
43 R. Li, Z. J. Wang, L. Wang, B. C. Ma, S. Ghasimi, H. Lu, K. Landfester and K. A. I. Zhang, ACS Catal., 2016, 6, 1113 1121.
44 J. X. Jiang, C. Wang, A. Laybourn, T. Hasell, R. Clowes, Y. Z. Khimyak, J. Xiao, S. J. Higgins, D. J. Adams and A. I. Cooper, Angew. Chemie - Int. Ed., 2011, 50, 1072 1075.
45 B. Li, F. Su, H.-K. Luo, L. Liang and B. Tan, Microporous Mesoporous Mater., 2011, 138, 207 214.
46 Z. Li, H. Li, H. Xia, X. Ding, X. Luo, X. Liu and Y. Mu, Chem. - A Eur. J., 2015, 21, 17355 17362.
47 R. X. Yang, T. T. Wang and W. Q. Deng, Sci. Rep., 2015, 5, 1 9.
48 A. M. James, S. Harding, T. Robshaw, N. Bramall, M. D. Ogden and R. Dawson, ACS Appl. Mater. Interfaces, 2019, 11, 22464 22473.
49 W. Lu, J. P. Sculley, D. Yuan, R. Krishna, Z. Wei and H.-C. Zhou, Angew. Chemie Int. Ed., 2012, 51, 7480 7484. 50 R. M. Gulam, T. E. Reich, R. Kassab, K. T. Jackson and H. M.
El-Kaderi, Chem. Commun., 2012, 48, 1141 1143.
51 T. Ben, H. Ren, S. Ma, D. Cao, J. Lan, X. Jing, W. Wang, J. Xu, F. Deng, J. M. Simmons, S. Qiu and G. Zhu, Angew. Chemie, 2009, 121, 9621 9624.
52 D. Yuan, W. Lu, D. Zhao and H.-C. Zhou, Adv. Mater., 2011, 23, 3723 3725.
53 Y. Liu, S. Wu, G. Wang, G. Yu, J. Guan, C. Pan and Z. Wang, J. Mater. Chem. A, 2014, 2, 7795 7801.
54 R. Dawson, A. I. Cooper and D. J. Adams, Prog. Polym. Sci., 2012, 37, 530 563.
55 S. Xu, Y. Luo and B. Tan, Macromol. Rapid Commun., 2013, 34, 471 84.
56 J. Huang and S. R. Turner, Polym. Rev., 2018, 58, 1 41. 57 N. Fontanals, J. Cortés, M. Galià, R. Maria Marcé, P. A. G.
Cormack, F. Borrull and D. C. Sherrington, J. Polym. Sci. Part A Polym. Chem., 2005, 43, 1718 1728.
59 B. Li, R. Gong, W. Wang, X. Huang, W. Zhang, H. Li, C. Hu and B. Tan, Macromolecules, 2011, 44, 2410 2414. 60 C. Wilson, M. J. Main, N. J. Cooper, M. E. Briggs, A. I.
Cooper and D. J. Adams, Polym. Chem., 2017, 8, 1914 1922.
61 X. Yang, M. Yu, Y. Zhao, C. Zhang, X. Wang and J. X. Jiang, RSC Adv., 2014, 4, 61051 61055.
62 L. Tan, B. Li, X. Yang, W. Wang and B. Tan, Polymer (Guildf)., 2015, 70, 336 342.
63 R. Dawson, T. Ratvijitvech, M. Corker, A. Laybourn, Y. Z. Khimyak, A. I. Cooper and D. J. Adams, Polym. Chem., 2012, 3, 2034 2038.
64 W. Wang, M. Zhou and D. Yuan, J. Mater. Chem. A, 2017, 5, 1334 1347.
65 D. S. Ahmed, G. A. El-Hiti, E. Yousif, A. A. Ali and A. S. Hameed, J. Polym. Res., , DOI:10.1007/s10965-018-1474-x. 66 D. G. Reed, G. R. M. Dowson and P. Styring, Front. Energy
Res., 2017, 5, 1 12.
67 T. Ratvijitvech, M. Barrow, A. I. Cooper and D. J. Adams, Polym. Chem., 2015, 6, 7280 7285.
68 X. Zhu, S. M. Mahurin, S.-H. An, C.-L. Do-Thanh, C. Tian, Y. Li, L. W. Gill, E. W. Hagaman, Z. Bian, J.-H. Zhou, J. Hu, H. Liu and S. Dai, Chem. Commun., 2014, 50, 7933.
69 D. Zhang, L. Tao, Q. Wang and T. Wang, Polymer (Guildf)., 2016, 82, 114 120.
70 F. R. and C. P. Claudia F. Martín, Ev Stöckel, Rob Clowes, Dave J. Adams, Andrew I. Cooper, Jose J. Pis, J. Mater. Chem, 2011, 21, 5475 5483.