This is a repository copy of
Automatic selection of verification tools for efficient analysis of
biochemical models
.
White Rose Research Online URL for this paper:
http://eprints.whiterose.ac.uk/130393/
Version: Published Version
Article:
Bakir, M.E., Konur, S., Gheorghe, M. et al. (2 more authors) (2018) Automatic selection of
verification tools for efficient analysis of biochemical models. Bioinformatics. ISSN
1367-4803
https://doi.org/10.1093/bioinformatics/bty282
© The Author(s) 2018. Published by Oxford University Press. This is an Open Access
article distributed under the terms of the Creative Commons Attribution Non-Commercial
License (http://creativecommons.org/licenses/by-nc/4.0/), which permits non-commercial
re-use, distribution, and reproduction in any medium, provided the original work is properly
cited. For commercial re-use, please contact [email protected]
[email protected]
https://eprints.whiterose.ac.uk/
Reuse
This article is distributed under the terms of the Creative Commons Attribution-NonCommercial (CC BY-NC)
licence. This licence allows you to remix, tweak, and build upon this work non-commercially, and any new
works must also acknowledge the authors and be non-commercial. You don’t have to license any derivative
works on the same terms. More information and the full terms of the licence here:
https://creativecommons.org/licenses/
Takedown
If you consider content in White Rose Research Online to be in breach of UK law, please notify us by
Systems biology
Automatic selection of verification tools for
efficient analysis of biochemical models
Mehmet Emin Bakir
1,*, Savas Konur
2, Marian Gheorghe
2,
Natalio Krasnogor
3and Mike Stannett
11
Department of Computer Science, University of Sheffield, Sheffield S1 4DP, UK,
2School of Electrical Engineering
& Computer Science, University of Bradford, Bradford BD7 1DP, UK and
3Interdisciplinary Computing and Complex
BioSystems (ICOS) Research Group, School of Computing Science, Newcastle University, Newcastle NE1 7RU, UK
*To whom correspondence should be addressed. Associate Editor: Jonathan Wren
Received on November 24, 2017; revised on March 8, 2018; editorial decision on April 1, 2018; accepted on April 20, 2018
Abstract
Motivation:
Formal verification
is a computational approach that checks system
correctness
(in
relation to a desired functionality). It has been widely used in engineering applications to verify
that systems work correctly.
Model checking
, an
algorithmic
approach to verification, looks at
whether a system
model
satisfies its requirements specification. This approach has been applied
to a large number of models in systems and synthetic biology as well as in systems medicine.
Model checking is, however, computationally very expensive, and is not scalable to large models
and systems. Consequently,
statistical model checking
(SMC), which relaxes some of the
con-straints of model checking, has been introduced to address this drawback. Several SMC tools
have been developed; however, the performance of each tool significantly varies according to
the system model in question and the type of requirements being verified. This makes it hard to
know, a priori, which one to use for a given model and requirement, as choosing the most
effi-cient tool for any biological application requires a significant degree of computational expertise,
not usually available in biology labs. The objective of this article is to introduce a method and
provide a tool leading to the automatic selection of the most appropriate model checker for the
system of interest.
Results:
We provide a system that can automatically predict the fastest model checking tool for a
given biological model. Our results show that one can make predictions of high confidence, with
over 90% accuracy. This implies significant performance gain in verification time and substantially
reduces the ‘usability barrier’ enabling biologists to have access to this powerful computational
technology.
Availability and implementation:
SMC Predictor tool is available at http://www.smcpredictor.com.
Contact:
[email protected]
Supplementary information:
Supplementary data
are available at Bioinformatics online.
1 Introduction
Machine-executable mathematical and computational models of biological systems have been developed to help understand their spa-tial and temporal behaviours (Fisher and Henzinger, 2007). The executable nature of these models enables the design ofin silico
experiments, which are generally faster, cheaper and more reprodu-cible than the analogous wet-lab experiments. The success of com-putational models depends crucially on two aspects: (i) the accuracy and capability to predictin vivo(orin vitro) experiments; and (ii) whether or not the methods used to validate the models can scale
VCThe Author(s) 2018. Published by Oxford University Press. 1
This is an Open Access article distributed under the terms of the Creative Commons Attribution Non-Commercial License (http://creativecommons.org/licenses/by-nc/4.0/), doi: 10.1093/bioinformatics/bty282
efficiently to handle large problem instances while maintaining the precision of the results obtained. This article deals with the latter.
Simulation and model checking (Clarkeet al., 1999) are two powerful techniques used for analysing computational models. Each has its own advantages and disadvantages.Simulationworks by exe-cuting the model repeatedly, and analysing the result. Each run of the system can be performed relatively quickly, but—especially in large, non-deterministic models—it is generally not possible to guar-antee that every single computation path is executed. In contrast, model checking, which is an algorithmic formal verification tech-nique, works by representing desirable properties of the model using formal mathematical logic, and then verifying whether the model satisfies the corresponding formal specification. This involves check-ing the model’s entire state spaceexhaustivelyby analysingall pos-sible system trajectories. Thus, compared with simulation, model checking allows discovering more novel knowledge about system properties albeit at the expense of increased computational cost.
Model checking has been extensively used for decades in com-puter science and engineering in the verification of various systems, e.g. concurrent (Aluret al., 2000) and distributed systems (Norman, 2004), multi-agent systems (Konuret al., 2013), pervasive systems (Konuret al., 2014b) and swarm robotics (Konuret al., 2012), to mention just a few. Due to its novel approach to extracting informa-tion about system behaviour, it has been also applied in the analysis of biological systems and biochemical networks. Recently, it has been applied to the analysis of various systems- and synthetic-biological systems, including the ERK/MAPK pathway (Heiner
et al., 2008), FGF signalling pathway (Heathet al., 2008), cell cycle in eukaryotes (Romero-Camperoet al., 2006), EGFR pathway (Eker
et al., 2002), T-cell receptor signalling pathway (Clarke et al., 2008), cell cycle control (Calzoneet al., 2006) and genetic Boolean gates (Sanassyet al., 2014;Konuret al., 2014a).
Although model checking has been proven to be a useful method in system analysis, the very well-knownstate-space explosion prob-lemassociated with large non-deterministic systems (as a result of exhaustive analysis using mathematical and numerical methods) has prevented it being applied to large systems.Statistical model check-ing(SMC) (Younes and Simmons, 2002) has been introduced to al-leviate the state-explosion problem issue by replacing mathematical and numerical analysis with a simulation approach (where a number of system trajectories are considered instead of exhaustive analysis), which is computationally less demanding. That is, SMC combines simulation and model checking, thereby leveraging the speed of simulation with the comprehensive analytical capacity of model checking. The greatly reduced number of executions enables verifi-cation of larger models at far lower computational cost, albeit by introducing a small amount of uncertainty.
The success of SMC has prompted researchers to implement a number of SMC tools, e.g. probabilistic and symbolic model checker (PRISM) (Hintonet al., 2006), Ymer (Younes, 2005), Markov reward model checker (MRMC) (Katoenet al., 2009), Monte Carlo Model Checker (MC2) (Donaldson and Gilbert, 2008) and PLASMA-Lab (Boyeret al., 2013). In order to facilitate the model checking process, SMC tools have also been employed as third party tools in a number of integrated software suites, such as SMBioNet (Khaliset al., 2009), Biocham (Faeder et al., 2009), Bio-PEPA Eclipse Workbench (Ciocchetta and Hillston, 2009), genetic network analyser (Battet al., 2012), kPWorkbench (Bakiret al., 2014;Dragomiret al., 2014) and Infobiotics Workbench (Blakeset al., 2011,2014).
Despite its clear computational advantages, SMC also has draw-backs. Although a large variety of tools have been developed, the performance of each tool significantly varies according to the
topological features and characteristics of the underlying network of a given model (e.g.number of vertices and edges, graph density, graph degreeetc.) and the type of system requirements/properties being verified. The model features and characteristics can affect the verification performance hugely (as well as simulation performance, as shown inSanassyet al., 2015); in particular, verification of mod-els with more complex network structures tend to be more challeng-ing. As we showed in a recent work (Bakiret al., 2017), the type of biological property (i.e. requirement) can also significantly affect the verification time, as each property type can involve different compu-tational processes on the network working at different levels of com-plexity (e.g. searching some nodes, or all nodes etc.).
This makes it hard to know—a priori—which model checking tool is the most efficient one for a given biological model and re-quirement, as this requires a significant degree of computational ex-pertise, not usually available in biology labs.
Thus, while the availability of multiple variants of these tools and algorithms can allow considerable flexibility and fine-tuned control over the analysis of specific models, it is very difficult for non-expert users to acquire the knowledge needed to identify clearly which tools are the most appropriate. It is therefore important to have a way of identifying and using the fastest SMC tool for a given model and property.
The objective of this article is to introduce a method and provide a tool leading to the automatic selection of the most appropriate model checker for the system of interest. This will not only significantly re-duce the total time and effort requested by the use of the model check-ing tools, but will also enable more precise verification of complex models while keeping the verification time tractable. In consequence, a deeper understanding of biological system dynamics will be acquired in a significantly improved time scale and with better performances.
1.1 Contributions
In this work, we have introduced a novel approach that combines vari-ous aspects of computer science, includingformal verification, stochas-tic simulation algorithms (SSAs) and machine learning to improve computational analysis—via model checking—in systems and synthet-ic biology by addressing performance related issues through novel computing solutions. To this end, we have developed a systematic and effective methodology: We have first identified some model features that represent topological and graph theoretic characteristics of the model. We have benchmarked the five of the most commonly used SMC tools by verifying 675 biological models against various com-monly used biological requirements (so calledpatterns). Using the identified model features, we have then utilised several machine learn-ing techniques on the data obtained to train efficient and accurate clas-sifiers. We have demonstrated that our approach can predict the fastest SMC tool with over 90% accuracy. This implies a huge per-formance gain compared with the random selection of tools, as choos-ing the most efficient model checker will result in significantly less verification time. We have implemented our approach and developed a software system,SMC Predictor, that predicts the fastest SMC tool based on a given biomodel and biological property.
To the best of our knowledge, this is the first paper that addresses the performance related issues of SMC tools in connection with model structure and the property.
2 Materials and methods
2.1 SMC tools
In this section, we briefly describe the five widely used SMC tools considered in our experimental analysis: PRISM (Hinton et al.,
2 M.E.Bakir et al.
2006), Ymer (Younes, 2005), MRMC (Katoenet al., 2009), MC2 (Donaldson and Gilbert, 2008) and PLASMA-Lab (Boyer et al., 2013). These tools have been used for analysing a wide range of sys-tems, including computer, network and biological systems. The ap-plicability of these SMC tools to a broad range of biological systems has been intensively investigated (Jansenet al., 2008;Bakiret al., 2017; Boyeret al., 2013; Donaldson and Gilbert, 2008;Zuliani, 2015).
PRISM is a popular and well-maintained probabilistic model checker tool (Hintonet al., 2006). PRISM implements both prob-abilistic model checking based on numerical techniques with exhaustive analysis of the model and SMC using an internal discrete-event simulation engine (Kwiatkowska et al., 2007). PLASMA-Lab is another SMC for analysing stochastic systems (Boyeret al., 2013). In addition to its internal simulator, it also pro-vides a plugin mechanism to users, allowing them to integrate cus-tom simulators into the PLASMA-Lab platform. Ymer is one of the first tools that implemented SMC algorithms—its ability to parallel-ise the execution of simulation runs makes it a relatively fast tool (Younes, 2005). MRMC is another tool which can support both nu-meric and SMC of probabilistic systems. Finally, MC2 enables SMC over simulation paths. Although this tool does not have an internal simulator, it permits using simulation paths of external simulators (Donaldson and Gilbert, 2008).
2.2 Property patterns
Model checking usestemporal logics(Clarkeet al., 1999) to specify desired system properties and requirements. But this is a very tedious task, because writing such formal specifications requires a very good understanding of formal languages. In order to facilitate the prop-erty specification process for non-experts, various frequently used property types (patterns) have been identified in previous studies (Dwyeret al., 1999;Grunske, 2008;Monteiroet al., 2008); and we have done likewise for patterns that are particularly appropriate for biological models (Konur, 2014;Gheorgheet al., 2015;Konur and Gheorghe, 2015). These patterns are commonly recurring properties that one may want to check in a modelled system.
We have identified 11 popular property patterns that are used in our experimental settings. The precise definitions of the property patterns and the model checking tools supporting them are provided using a systems level model of P.aeruginosa quorum sensing as an example (seeSupplementary Section 2).
2.3 Models
In order to identify the performance of SMC tools, we have verified instances of the 11 patterns on 675 up-to-date biological models taken from the BioModels database (http://www.ebi.ac.uk/) in SBML format, a data exchange standard. In order to focus on the model structure analysis, we have fixed stochastic rate constants of all reactions to 1.0 and the amounts of all species to 100 (in previous work (Sanassyet al., 2015), 380 of these models were considered in a similar fashion to predict performance of simulation tools). The models tested ranged in size from 2 species and 1 reaction, to 2631 species and 2824 reactions. The distribution of model sizes can be found inSupplementary Section 4.2(Fig. 1).
In this article, we focus on predicting the time performance of a set of available model checkers in order to save the end-user compu-tational expense. In previous workSanassyet al.(2015), we have shown that we can reliably focus on the modelstructureonly to make such performance prediction when trying to decide on the fast-est simulation engine. That is, model parameters could be safely
ignored while still being able to robustly predict the best simulator to use. More recently, it has been demonstrated that a similar ap-proach (namely focussing on structure and ignoring parameters) was sufficient to predict the outcome of long stochastic chemical simula-tionsMarkovitch and Krasnogor (2018). Thus, we follow a similar approach here and focus solely on model structure and ignore model parameters for the purpose of predicting the speed at which different model checkers verify system level models.
We have also run an additional experiment to demonstrate that keeping the model parameters as they are does not affect the prediction accuracy. The details can be found inSupplementary Section 4.4
2.4 Prediction
In order to train the classifiers, we utilised several different machine learning algorithms implemented in the scikit-learn library (Pedregosaet al., 2011). We have compared seven methods; five of them are powerful and widely used algorithms, namely, support vec-tor machine classifier (SVM) (Chang and Lin, 2011), logistic regres-sion (LR) (Yuet al., 2011), K-nearest neighbour classifier (KNN) (Mucherinoet al., 2009), extremely randomized trees (ERT) (Geurts
et al.2006) and random forests (RFs) (Breiman, 2001) and two of the classifiers are for baseline predictions, namely, Random Dummy (RD) and Stratified Dummy (SD). We used 10-fold cross-validation for training and testing the classifiers. An alternative validation method is provided inSupplementary Section 4.3.
2.5 SMC predictor tool
We have developed a software system, SMC Predictor, which accepts biomodels written in SBML and property patterns as input, and returns the prediction of which stochastic model checker the user should use, giving preference to time required for the verifica-tion process. The classifiers predict the fastest SMC tool for each model and property pattern. The software system architecture is pre-sented inSupplementary Section 5.
The experimental data and the SMC Predictor tool are available at http://www.smcpredictor.com.
3 Results and discussion
In this section, we present the results of benchmarks with the five of the most commonly used SMC tools by verifying 675 biological models against various commonly used biological requirements (pat-terns) and then analyse the accuracy of predicting the fastest SMC tool by using classifiers, based on machine learning techniques involving identified model features and trained on the data obtained.
Supplementary Section 4.1describes the system configuration and the current versions of the SMC tools used in our experiments.
We start by presenting experiments showing the average compu-tational time required for various model features and the impact these features have on the prediction accuracy.
3.1 Feature selection
Topological and graph-theoretic features of the underlying network of a model (e.g.number of vertices and edges,graph density,graph degreeetc.) significantly affect the simulation time of SSAs. These features have been used to predict the performance of SSAs (Sanassy
The performance of stochastic model checking depends primar-ily on such model features as well as the property type being queried (Bakiret al., 2017). In our work, we aim to increase the predictive accuracy without compromising on computation time. In addition to the graph topological features, we have therefore considered new features which mostly do not require graph con-struction (e.g.number of species whose values can change; number of species multiplied by number of reactions; min, max and mean number of variable changes; total number of all incoming and outgoing edges). The graph-related features and our newly introduced (non-graph related) ones are described in
Supplementary Section 3.
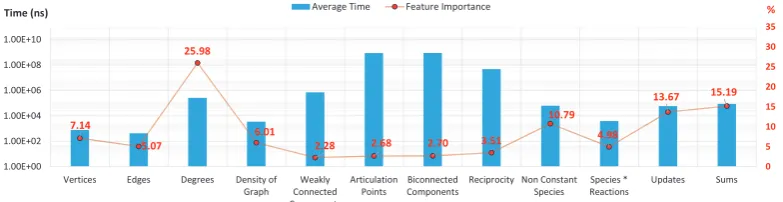
The bar chart inFigure 1 shows the average computational time (in nanoseconds) required when using each topological fea-ture. In order to identify which of the properties are most import-ant for our purposes, we have conducted feature selection analysis using a feature importance algorithm based on ERTs (Geurts
et al., 2006; Louppeet al., 2013). The data points on the line graph inFigure 1show the ‘percentage importance’ of each fea-ture. The results show that graph-theoretic features such as reci-procity, weakly connected components, biconnected components andarticulation pointsare computationally expensive but actually contribute less to the predictive power than the computationally less expensive features.
In addition to the above experiments we have evaluated the pre-diction accuracy of the method described inSanassyet al.(2015)in the context of the extended set of features. Better results have been obtained when non-graph-related features are considered and com-putationally expensive graph-theoretic ones are removed (details in
Supplementary Section 4.2).
Based on these results we have considered for the final features set those that give better prediction accuracy with a reasonable com-putational time.
3.2 Performance benchmarking of SMC tools
We have benchmarked the performance of 5 SMC tools using 675 biomodels obtained from the EBI database (http://www.ebi.ac.uk/) against 11 property patterns. This is a significant extension of our previous work (Bakiret al., 2017), where we only considered a small subset of models and property patterns with a significantly less num-ber of experiments. Since all models are available in the SBML for-mat, we have developed a tool translating the SBML model into the syntax that these SMC tools accept as input. The tool also translates the property patterns into the formal specification languages of the model checkers.
[image:5.612.111.503.58.159.2]For each test 500 simulation traces were generated and 5000 steps per trace were executed. Each test was repeated three times and the average time considered. The elapsed time for each run includes the time required for model parsing, simulation and verifi-cation, and where one tool depends on the use of another one then the execution time of the auxiliary tool is included in the total execu-tion time.
Table 1 summarises our experimental results. PLASMA-Lab could verify all models; MC2 could verify most models for all prop-erty patterns, except Precedes. MC2 failed to verify only a few mod-els within the available time. Ymer could also verify most of the models, but could not handle and repeatedly crashed for 31 large models. PRISM’s capacity for verification depends on the pattern type; for example, it could verify only 364 models against the Eventually pattern but it could verify almost all models, 672, for the
[image:5.612.63.552.213.367.2]Fig. 1.Computational time and feature importance. Average computational time and feature importance associated with model topological properties
Table 1.The number of models verified against different property patterns
PRISM PLASMA-Lab Ymer MRMC MC2
Patterns Verif. Fast. Verif. Fast. Verif. Fast. Verif. Fast. Verif. Fast.
Eventually 364 18 675 248 644 402 116 3 668 4
Always 480 80 675 132 644 457 118 2 668 4
Follows N/A N/A 675 575 N/A N/A 116 39 664 61
Precedes 672 170 675 18 644 486 113 0 664 1
Never 542 103 675 147 644 422 116 1 668 2
Steady state N/A N/A 675 579 N/A N/A 80 30 668 66
Until 592 125 675 82 644 465 112 0 664 3
Infinitely often N/A N/A 675 604 N/A N/A N/A N/A 668 71
Next 658 581 675 17 N/A N/A 118 36 675 41
Release 622 151 675 49 644 472 111 0 664 3
Weak until 591 126 675 82 644 465 112 0 664 2
Note: Columns labelled Verif. show the number of models verified by each tool. Columns labelled Fast. show for how many models the corresponding tool was the fastest. N/A, not applicable, means the corresponding pattern is not supported by the tool.
4 M.E.Bakir et al.
Precedes pattern. The reason is that PRISM requires a greater simu-lation depth for unbounded property verification to have a reliable approximation. MRMC could verify fewer models than the other SMCs for all property patterns, because it relies on PRISM for tran-sition matrix generation. However, for medium sized and large models PRISM failed to build and export the transition matrices— we believe this was due to a CU Decision Diagram library crash.
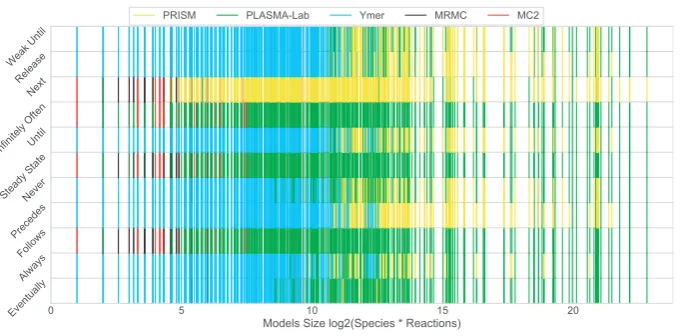
Figure 2 illustrates the relation between the fastest tool and model size. Ymer is the fastest tool for most of the models (for the supported property patterns), however, asFigure 2 shows, it was generally the fastest for relatively small sized models. PRISM and PLASMA-Lab are generally the fastest tools for medium to large sized models. It may be observed that their performances vary across different property patterns. MRMC and MC2 are the fastest tools for fewer models and they perform best only for small sized models. They do slightly better for the Follows, Steady State and Infinitely Often patterns where they compete with fewer tools.
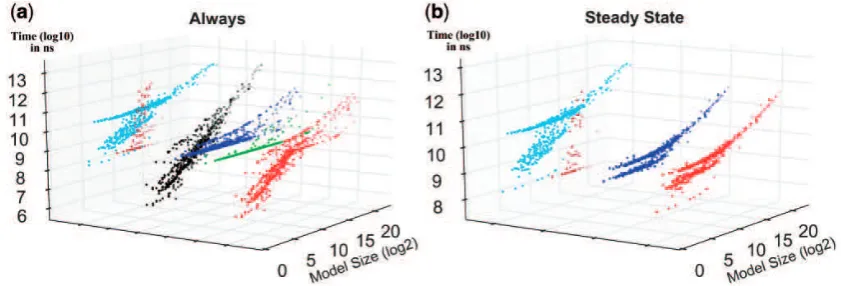
Figure 3illustrates the verification time for each tool with re-spect to model size, providing complementary information to what is inTable 1andFigure 2. The figure shows the tool performance comparison for two patterns. The results for all patterns are pre-sented inSupplementary Section 4.5. Generally speaking, MC2 and MRMC require more time for verification; hence they are less effi-cient compared with the other tools. In particular, MRMC can ver-ify very few models and its verification time increases exponentially for the larger models. The verification time for Ymer increases al-most linearly, i.e. it is fast for small models, but the verification time constantly increases when the model size increases. PLASMA-Lab displays an exponential growth for small size models but it gets more efficient for large size models. Like PLASMA-Lab, PRISM generally is not the fastest option for small-sized models whereas it can perform better for larger models.
These results show that the performance of the model checking tools significantly changes based on models and property patterns, which makes it extremely difficult to predict the best tool without the assistance of an automated system.
3.3 Automating SMC tool prediction
We have used five machine learning techniques and two random se-lection algorithms, RD and SD, for predicting the fastest SMC tool. The random selection algorithms were used for comparing the suc-cess rate of each algorithm with random prediction. The RD
classifier ‘guesses’ the SMC tool blindly, that is, with uniform prob-ability 1/5 it picks one of the five verification tools at random, whereas the SD classifier knows the distribution of the fastest SMC tools. The RD classifier acts as a proxy for the behaviour of the researchers who do not know much about model checking tools, while SD can be considered as mirroring the behaviour of experi-enced verification researchers who know the patterns supported by each tool and the fastest tools distribution, but do not know which is the best tool for a specific property to be checked on aspecific model. The remaining five methods are: SVM classifier (Chang and Lin, 2011); LR (Yuet al., 2011); KNN classifier (Mucherinoet al., 2009); and two types of ensemble methods, namely, ERT (Geurts
et al., 2006) and RFs (Breiman, 2001) (despite their names these are not random classifiers, but ensemble classifiers). We used the scikit-learn library (Pedregosaet al., 2011) implementation of these classi-fiers in our experiments.
We have considered three different accuracy scores in our experi-ments. The first score, ‘S1’, is the percentage of correct estimation of the fastest SMC tool with the 10-fold cross-validation. The second score, ‘S2’, is calculated by considering a threshold bound to assess-ing a correct prediction, namely, whenever the relative time differ-ence between the actual fastest SMC tool and the predicted fastest SMC tool is not>10% of the actual fastest SMC tool time, then the
prediction is considered correct. For the third score, ‘S3’, the order of the fastest SMC tools is used and if the predicted SMC tool is the second fastest tool, then it is regarded as a correct prediction.
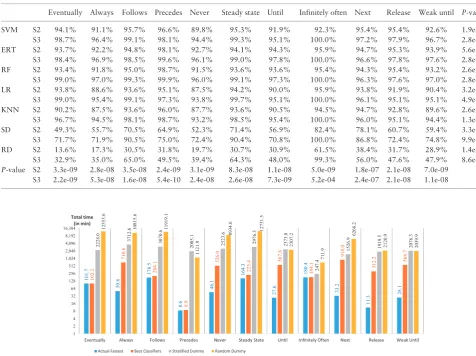
The experimental results with first score (S1) of each classifier for different property patterns are shown inFigure 4and their accur-acy values are tabulated inTable 2. The success rates were all higher than for random classifiers. ERT was the most frequent winner, as it had best predictive accuracy for six patterns (for Infinitely Often, ERT and LR have the same highest accuracy, 95%), whereas the SVM classifier was the second best winner with highest predictive accuracy for five patterns. ERT and SVM are hereinafter referred to as the best classifiers. The prediction accuracies of the best classifiers were over 90% for all pattern types.
[image:6.612.139.480.56.224.2]We have measured theP-values of each classifier across different property patterns, by comparing the accuracy scores of cross-validation of each classifier using the Friedman test (Friedman, 1940) provided with the Python SciPy library (http://scikit-learn. org).Table 2provides both row- and column-wiseP-values. The column-wise P-values indicate that, a given classifier (e.g. SVM) views the predictive accuracies of different patterns with statistically
significant differences (i.e. lowP-values). So, it would not be recom-mended to use just one classifier for all pattern types. The row-wise P-values indicate that, for a given pattern (e.g. ‘Eventually’) the pre-diction accuracy might be more readily done via different classifiers with statistically significant differences. That is, the lowP-values suggest that different methods have statistically different performances.
Table 3shows the experimental results using the other score set-tings. The accuracy of ‘S2’ experiments is not much higher than for
[image:7.612.95.516.59.202.2]‘S1’, which considered only the actual fastest tool prediction as cor-rect, but the accuracy of ‘S3’ is significantly higher because it ‘lumps together’ the fastest and second fastest tools, but the time differences between the second best and the actual best tool can be orders of magnitude, i.e. much more than 10-fold. For the Follows, Steady State and Infinitely Often patterns, the accuracies of SD and RD are relatively better under these more relaxed scoring approaches, be-cause there are fewer tools which support these patterns; hence they have higher chances of correct prediction. Similar to Table 2,
Fig. 3.Performance comparison. For each property pattern, each tool performance is compared against the best performance. Here, X-axes represent the model size (speciesreactions) in logarithmic scale (log2), Y-axes show the relative performance of each SMC tool in comparison with the fastest one, and Z-axes show
[image:7.612.110.507.255.428.2](log10scale) the consumed time in nanoseconds
[image:7.612.65.548.470.616.2]Fig. 4.Predictive accuracies. Accuracies (S1) for the fastest SMC prediction with different algorithms
Table 2.Accuracy values using first score (S1)
SVM ERT RF LR KNN SD RD P-value
Eventually 92.4% 92.2% 91.6% 92.0% 88.8% 47.7% 12.4% 3.4e-09
Always 88.9% 90.5% 90.1% 85.9% 84.7% 53.4% 16.3% 8.1e-09
Follows 95.0% 93.6% 93.9% 92.4% 92.6% 70.5% 29.1% 3.5e-08
Precedes 95.4% 97.2% 97.0% 93.5% 94.4% 63.3% 27.4% 1.1e-09
Never 88.5% 91.0% 89.8% 85.6% 85.2% 48.8% 19.1% 3.5e-09
Steady state 94.2% 93.2% 92.6% 93.0% 92.7% 70.7% 29.6% 1.1e-07
Until 91.0% 92.8% 92.2% 87.8% 88.0% 54.7% 28.7% 4.5e-08
Infinitely often 91.6% 95.0% 94.7% 95.0% 93.6% 81.5% 61.2% 7.4e-09
Next 94.3% 93.5% 92.9% 92.6% 93.5% 72.9% 36.9% 1.9e-07
Release 94.2% 93.8% 93.1% 89.8% 91.3% 58.8% 28.4% 1.9e-08
Weak until 90.8% 92.3% 91.7% 88.8% 87.1% 57.4% 27.3% 2.4e-08
P-value 8.0e-08 2.9e-04 1.1e-05 1.7e-09 2.1e-09 2.4e-14 4.6e-13
6 M.E.Bakir et al.
Table 3provides both row- and column-wiseP-values. The row-wiseP-values indicate that there are statistically significant differen-ces when using the same classifier for different patterns. The column-wiseP-values indicate that for a given pattern the prediction accuracy varies for different classifiers with statistically significant differences.
3.4 Performance gain and loss
In this section, for each property pattern, we have assessed the per-formance gain and loss for the best classifiers and the random classi-fiers. The performance gain is the time difference between the verification time of the tools predicted by the best classifiers and the random classifiers.
Figure 5shows the total time required to verify all models with the actual fastest SMC tools, the best classifier predictions and the random classifier predictions. The performance gain between the best classifiers and the SD classifier is minimum 63 min for Infinitely Often, maximum 3002 min for Always, and average 1848 mins for all patterns. The time difference between the best classifiers and RD is even larger: minimum 528 min, maximum 12 506 min and aver-age 6109 min for all patterns. The results show that using the best classifier predictions a significant amount of time can be saved—up to 208 h!
Generally, the outcomes of mispredictions can be as important as correct predictions. In this regard, we have measured the
performance loss caused by inaccurate predictions.Figure 6shows the performance loss, i.e. time difference between the total tion time using the actual fastest SMC tools and the total verifica-tion time using the predicted SMC tools. The performance loss for the best classifier is minimum 0.3 min for Precedes, maximum 885 min for Next, and average 318 min for all patterns. Similarly, the performance loss for SD is minimum 67 min, maximum 3662 min and average 2167 min; for RD is minimum 532 min; maximum 12 567 min and average 6427 min. The results suggest the best clas-sifiers’ performance losses are always lower than the random classi-fiers’ ones. More specifically SD and RD cause performance losses 7 and 20 times, respectively, higher than the best classifiers.
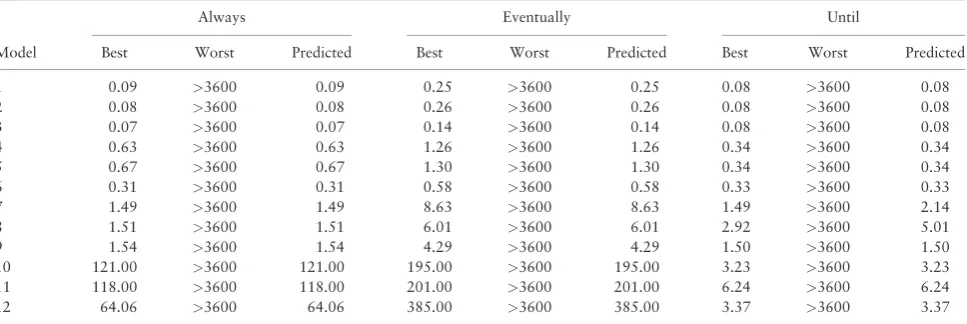
Finally,Table 4provides the best, worst and predicted model checking times for a set of selected models and patterns (note that we have put a 1-h cap on the length of each experiments; the worst model checking times presented are generally>1 h (in some cases,
hours or even days)). The best times and predicted times for each pattern are mostly identical; as previously discussed the prediction accuracy is very high.
The results show that (even with a one hour cap) one can achieve a significant performance gain. While a random selection might lead to hours of model checking time, using the predictor can reduce this time to milliseconds. In a typical formal analysis of a system, where several queries are used to verify desired system properties, experi-ments that might take hours or days to run can be reduced to minutes or even seconds.
Table 3.Predictive accuracy with different score settings
Eventually Always Follows Precedes Never Steady state Until Infinitely often Next Release Weak until P-value
SVM S2 94.1% 91.1% 95.7% 96.6% 89.8% 95.3% 91.9% 92.3% 95.4% 95.4% 92.6% 1.9e-07 S3 98.7% 96.4% 99.1% 98.1% 94.4% 99.3% 95.1% 100.0% 97.2% 97.9% 96.7% 2.8e-10 ERT S2 93.7% 92.2% 94.8% 98.1% 92.7% 94.1% 94.3% 95.9% 94.7% 95.3% 93.9% 5.6e-04 S3 98.4% 96.9% 98.5% 99.6% 96.1% 99.0% 97.8% 100.0% 96.6% 97.8% 97.6% 2.8e-07 RF S2 93.4% 91.8% 95.0% 98.7% 91.5% 93.6% 93.6% 95.4% 94.3% 95.4% 93.2% 2.6e-04 S3 99.0% 97.0% 99.3% 99.9% 96.0% 99.1% 97.3% 100.0% 96.3% 97.6% 97.0% 2.8e-09 LR S2 93.8% 88.6% 93.6% 95.1% 87.5% 94.2% 90.0% 95.9% 93.8% 91.9% 90.4% 3.2e-08 S3 99.0% 95.4% 99.1% 97.3% 93.8% 99.7% 95.1% 100.0% 96.1% 95.1% 95.1% 4.9e-11 KNN S2 90.2% 87.5% 93.6% 96.0% 87.7% 93.6% 90.5% 94.5% 94.7% 92.8% 89.6% 2.6e-08 S3 96.7% 94.5% 98.1% 98.7% 93.2% 98.5% 95.4% 100.0% 96.0% 95.1% 94.4% 1.3e-09 SD S2 49.3% 55.7% 70.5% 64.9% 52.3% 71.4% 56.9% 82.4% 78.1% 60.7% 59.4% 3.3e-14 S3 71.7% 71.9% 90.5% 75.0% 72.4% 90.4% 70.8% 100.0% 86.8% 72.4% 74.8% 9.9e-13 RD S2 13.6% 17.3% 30.5% 31.8% 19.7% 30.7% 30.9% 61.5% 38.4% 31.7% 28.9% 1.4e-12 S3 32.9% 35.0% 65.0% 49.5% 39.4% 64.3% 48.0% 99.3% 56.0% 47.6% 47.9% 8.6e-15 P-value S2 3.3e-09 2.8e-08 3.5e-08 2.4e-09 3.1e-09 8.3e-08 1.1e-08 5.0e-09 1.8e-07 2.1e-08 7.0e-09
S3 2.2e-09 5.3e-08 1.6e-08 5.4e-10 2.4e-08 2.6e-08 7.3e-09 5.2e-04 2.4e-07 2.1e-08 1.1e-08
3.5 Conclusion
In this article, we have proposed and implemented a methodology to automatically predict the most efficient SMC tool for any given model and property pattern. To do so, we first proposed a set of model features which can be used for SMC prediction. We then sys-tematically benchmarked several model checkers by verifying 675 biological models against 11 property patterns. By utilizing several machine learning algorithms, we have generated efficient and accur-ate classifiers that successfully predict the fastest SMC tool with over 90% accuracy for all pattern types. We have developed soft-ware using built-in classifiers to make the prediction automatically. Finally, we have shown that by using automated prediction, a sig-nificant amount of time can be saved.
For the next stage of our work, we aim to integrate the auto-mated fastest SMC prediction process into some of the larger bio-logical model analysis suites, e.g. kPWorkbench (Dragomiret al., 2014) and Infobiotics Workbench (Blakeset al., 2011).
Funding
This work was supported by the Engineering and Physical Sciences Research Council [grant numbers EP/I031642/2 to S.K., M.G. and N.K. and EP/ J004111/2, EP/L001489/2 and EP/N031962/1 to N.K.]; Innovate UK [grant number KTP010551 to S.K.]; the Romanian National Authority for Scientific Research (CNCS-UEFISCDI) [project number PN-III-P4-ID-PCE-2016-0210 to M.G.]; and the Turkey Ministry of Education [PhD studentship to M.E.B.].
Conflict of Interest: none declared.
References
Alur,R.et al. (2000) Model checking of correctness conditions for concurrent objects.Inform. Comp.,160, 167–188.
Bakir,M.E.et al. (2014). Extended simulation and verification platform for kernel P systems. In: Gheorghe, M.et al.(eds), Membrane Computing, Lecture Notes in Computer Science. Springer, Cham, pp. 158–178. Bakir,M.E.et al. (2017). Comparative analysis of statistical model checking
tools. In: Membrane Computing, Lecture Notes in Computer Science. Springer, Cham, pp. 119–135.
Batt,G.et al. (2012). Genetic network analyzer: a tool for the qualitative mod-eling and simulation of bacterial regulatory networks. In: Bacterial Molecular Networks, Volume 804 of Methods in Molecular Biology. Springer, New York. pp. 439–462.
Blakes,J.et al. (2011) The Infobiotics Workbench: an integrated in silico modelling platform for systems and synthetic biology.Bioinformatics,27, 3323–3324.
Blakes,J.et al. (2014). Infobiotics workbench: a P systems based tool for sys-tems and synthetic biology. In:Applications of Membrane Computing in Systems and Synthetic Biology, Volume 7 of Emergence, Complexity and Computation. Springer International Publishing, Switzerland, pp. 1–41. Boyer,B.et al. (2013). Plasma-lab: a flexible, distributable statistical model
checking library. In:Proceedings of 10th International Conference QEST, Volume 8054 of LNCS. Springer, Buenos Aires, Argentina, pp. 160–164. Breiman,L. (2001) Random forests.Mach. Learn.,45, 5–32.
Calzone,L.et al. (2006). Machine learning biochemical networks from tem-poral logic properties. In:Transactions on Computational Systems Biology VI, Volume 4220 of Lecture Notes in Computer Science. Springer, Berlin, Heidelberg, pp. 68–94.
[image:9.612.125.491.56.202.2]Chang,C.-C. and Lin,C.-J. (2011) LIBSVM: a library for support vector machines.ACM Trans. Intell. Syst. Technol.,2, 1–27.
Fig. 6.The mean performance loss when the best classifiers predict incorrectly
Table 4.Best, worst and predicted model checking time (seconds) for various models and patterns
Always Eventually Until
Model Best Worst Predicted Best Worst Predicted Best Worst Predicted
1 0.09 >3600 0.09 0.25 >3600 0.25 0.08 >3600 0.08
2 0.08 >3600 0.08 0.26 >3600 0.26 0.08 >3600 0.08
3 0.07 >3600 0.07 0.14 >3600 0.14 0.08 >3600 0.08
4 0.63 >3600 0.63 1.26 >3600 1.26 0.34 >3600 0.34
5 0.67 >3600 0.67 1.30 >3600 1.30 0.34 >3600 0.34
6 0.31 >3600 0.31 0.58 >3600 0.58 0.33 >3600 0.33
7 1.49 >3600 1.49 8.63 >3600 8.63 1.49 >3600 2.14
8 1.51 >3600 1.51 6.01 >3600 6.01 2.92 >3600 5.01
9 1.54 >3600 1.54 4.29 >3600 4.29 1.50 >3600 1.50
10 121.00 >3600 121.00 195.00 >3600 195.00 3.23 >3600 3.23 11 118.00 >3600 118.00 201.00 >3600 201.00 6.24 >3600 6.24 12 64.06 >3600 64.06 385.00 >3600 385.00 3.37 >3600 3.37
8 M.E.Bakir et al.
[image:9.612.66.550.247.409.2]Ciocchetta,F. and Hillston,J. (2009) Bio-pepa: a framework for the modelling and analysis of biological systems.Theor. Comput. Sci.,410, 3065–3084.
Clarke,E.M.et al. (1999).Model Checking. MIT Press, Cambridge, MA, USA. Clarke,E.M.et al. (2008). Statistical model checking in Biolab: applications to the automated analysis of T-cell receptor signaling pathway. In:Proceedings of the CMSB’08. Springer, Rostock, Germany, pp. 231–250.
Donaldson,R. and Gilbert,D. (2008). A Monte Carlo model checker for Probabilistic LTL with numerical constraints.Technical report, University of Glasgow, Department of Computing Science.
Dragomir,C.et al. (2014). Model checking kernel P systems. In:Membrane Computing, Volume 8340 of Lecture Notes in Computer Science. Springer, Berlin, Heidelberg, pp. 151–172.
Dwyer,M.B.et al. (1999). Patterns in property specifications for finite-state verification. In:Proceedings of ICSE ’99, ACM, New York, NY, USA, pp. 411–420.
Eker,S.et al. (2002). Pathway logic: symbolic analysis of biological signaling. In: Proceedings of the Pacific Symposium on Biocomputing. SRI International, CA, USA, pp. 400–412.
Faeder,J.R.et al. (2009). Rule-based modeling of biochemical systems with Bionetgen. In:Methods in Molecular Biology, System Biology, Volume 500 of Methods in Molecular Biology. Humana Press, pp. 113–167.
Fisher,J. and Henzinger,T.A. (2007) Executable cell biology.Nat. Biotech.,
25, 1239–1249.
Friedman,M. (1940) A comparison of alternative tests of significance for the problem ofmrankings.Ann. Math. Stat.,11, 86–92.
Geurts,P.et al. (2006) Extremely randomized trees.Mach. Learn.,63, 3–42. Gheorghe,M.et al. (2015). An integrated model checking toolset for kernel P
systems. In:Membrane Computing, Lecture Notes in Computer Science. Springer, Cham, pp. 153–170.
Grunske,L. (2008). Specification patterns for probabilistic quality properties. In: Proceedings of the 30th International Conference on Software Engineering, ICSE’08. ACM, NY, USA, pp. 31–40.
Heath,J.et al. (2008) Probabilistic model checking of complex biological path-ways.Theor. Comput. Sci.,319, 239–257.
Heiner,M.et al. (2008). Petri nets for systems and synthetic biology. In: Formal Methods for Computational Systems Biology, Volume 5016 of Lecture Notes in Computer Science. Springer, Berlin, Heidelberg, pp. 215–264.
Hinton,A.et al. (2006). PRISM: a tool for automatic verification of probabilis-tic systems. In:Tools and Algorithms for the Construction and Analysis of Systems. Springer, Berlin, Heidelberg, pp. 441–444.
Jansen,D.N.et al. (2008). How fast and fat is your probabilistic model check-er? an experimental performance comparison. In:Proceedings of HVC’07. Springer-Verlag, Berlin, Heidelberg, pp. 69–85.
Katoen,J.-P.et al. (2009). The ins and outs of the probabilistic model checker MRMC. In:Quantitative Evaluation of Systems (QEST). IEEE Computer Society, Budapest, Hungary, pp. 167–176.
Khalis,Z.et al. (2009) The SMBioNet method for discovering models of gene regulatory networks.Genes Genomes Genomics,3, 15–22.
Konur,S. (2014) Towards light-weight probabilistic model checking.J. Appl. Math.,2014, 1. 814159: 1–814159: 15.
Konur,S. and Gheorghe,M. (2015) A property-driven methodology for formal analysis of synthetic biology systems.IEEE/ACM Trans. Comput. Biol. Bioinformatics,12, 360–371.
Konur,S.et al. (2012) Analysing robot swarm behaviour via probabilistic model checking.Robot. Autonom. Syst.,60, 199–213.
Konur,S.et al. (2013) Combined model checking for temporal, probabilistic, and real-time logics.Theor. Comput. Sci.,503, 61–88.
Konur,S.et al. (2014a) Conventional verification for unconventional comput-ing: a genetic XOR gate example.Fund. Inform.,134, 97–110.
Konur,S.et al. (2014b) Formal verification of a pervasive messaging system. Formal Aspects Comput.,26, 677–694.
Kwiatkowska,M.et al. (2007). Stochastic model checking. In:Proceedings of the 7th International Conference on Formal Methods for Performance Evaluation, SFM’07. Springer, Berlin, Heidelberg, pp. 220–270.
Louppe,G.et al. (2013). Understanding variable importances in forests of randomized trees. In:Advances in Neural Information Processing Systems 26. Curran Associates, Inc., USA, pp. 431–439.
Markovitch,O. and Krasnogor,N. (2018) Predicting species emergence in simulated complex pre-biotic networks.PLoS One,13, e0192871. Monteiro,P.T.et al. (2008) Temporal logic patterns for querying dynamic
models of cellular interaction networks.Bioinformatics,24, i227–i233. Mucherino,A.et al. (2009). k-nearest neighbor classification. In:Data Mining
in Agriculture. Springer, New York, pp. 83–106.
Norman,G. (2004).Validation of Stochastic Systems: A Guide to Current Research, Volume 2925 of Lecture Notes in Computer Science (Tutorial Volume), Chapter Analysing Randomized Distributed Algorithms. Springer-Verlag, Berlin, Heidelberg, pp. 384–418.
Pedregosa,F.et al. (2011) Scikit-learn: machine learning in Python.J. Mach. Learn. Res.,8, 2825–2830.
Romero-Campero,F.J.et al. (2006). Towards probabilistic model checking on P systems using Prism. In:Membrane Computing, Volume 4361 of Lecture Notes in Computer Science. Springer, Berlin, Heidelberg, pp. 477–495. Sanassy,D.et al. (2014). Modelling and stochastic simulation of synthetic
biologic-al Boolean gates. In:16th IEEE International Conference on High Performance Computing and Communications. IEEE, Paris, France, pp. 404–408. Sanassy,D.et al. (2015) Meta-stochastic simulation of biochemical models for
systems and synthetic biology.ACS Synth. Biol.,4, 39–47.
Younes,H.L.S. (2005) Ymer: a statistical model checker. In:Proceedings of the 17th International Conference on Computer Aided Verification, CAV’05. Springer-Verlag, Berlin, Heidelberg, pp. 429–433.
Younes,H.L.S. and Simmons,R.G. (2002). Probabilistic verification of discrete event systems using acceptance sampling. In: Proceedings of 14th International Conference on Computer Aided Verification. Springer, Copenhagen, Denmark, pp. 223–235.
Yu,H.-F.et al. (2011) Dual coordinate descent methods for logistic regression and maximum entropy models.Mach. Learn.,85, 41–75.