R E S E A R C H
Open Access
Performance of critical care prognostic
scoring systems in low and middle-income
countries: a systematic review
Rashan Haniffa
1,2,3,4*, Ilhaam Isaam
2,3, A. Pubudu De Silva
2,4, Arjen M. Dondorp
1,5and Nicolette F. De Keizer
6Abstract
Background:Prognostic models—used in critical care medicine for mortality predictions, for benchmarking and for illness stratification in clinical trials—have been validated predominantly in high-income countries. These results may not be reproducible in low or middle-income countries (LMICs), not only because of different case-mix characteristics but also because of missing predictor variables. The study objective was to systematically review literature on the use of critical care prognostic models in LMICs and assess their ability to discriminate between survivors and non-survivors at hospital discharge of those admitted to intensive care units (ICUs), their calibration, their accuracy, and the manner in which missing values were handled.
Methods:The PubMed database was searched in March 2017 to identify research articles reporting the use
and performance of prognostic models in the evaluation of mortality in ICUs in LMICs. Studies carried out in ICUs in high-income countries or paediatric ICUs and studies that evaluated disease-specific scoring systems, were limited to a specific disease or single prognostic factor, were published only as abstracts, editorials, letters and systematic and narrative reviews or were not in English were excluded.
Results:Of the 2233 studies retrieved, 473 were searched and 50 articles reporting 119 models were included.
Five articles described the development and evaluation of new models, whereas 114 articles externally validated Acute Physiology and Chronic Health Evaluation, the Simplified Acute Physiology Score and Mortality Probability Models or versions thereof. Missing values were only described in 34% of studies; exclusion and or imputation by normal values were used. Discrimination, calibration and accuracy were reported in 94.0%, 72.4% and 25% respectively. Good discrimination and calibration were reported in 88.9% and 58.3% respectively. However, only 10 evaluations that reported excellent discrimination also reported good calibration. Generalisability of the findings was limited by variability of inclusion and exclusion criteria, unavailability of post-ICU outcomes and missing value handling.
Conclusions:Robust interpretations regarding the applicability of prognostic models are currently hampered by
poor adherence to reporting guidelines, especially when reporting missing value handling. Performance of mortality risk prediction models in LMIC ICUs is at best moderate, especially with limitations in calibration. This necessitates continued efforts to develop and validate LMIC models with readily available prognostic variables, perhaps aided by medical registries.
Keywords:Critical care, Prognostic model, ICU scoring system, Model performance, Low and middle-income
countries, Resource-limited settings
* Correspondence:rashan@nicslk.com
1
Centre for Tropical Medicine and Global Health, Nuffield Department of Medicine, University of Oxford, Oxford, UK
2Network for Improving Critical Care Systems and Training, Colombo, Sri
Lanka
Full list of author information is available at the end of the article
© The Author(s). 2018Open AccessThis article is distributed under the terms of the Creative Commons Attribution 4.0
Background
Prognostic models used in critical care medicine for mor-tality predictions, for benchmarking and for illness stratifi-cation in clinical trials need to be validated for the relevant setting. An ideal model should have good discrimination (the ability to differentiate between high-risk and low-high-risk patients) and good calibration (generate risk estimates close to actual mortality) [1]. Acute Physi-ology and Chronic Health Evaluation (APACHE) or the Simplified Acute Physiology Score (SAPS) and the Mor-tality Probability Models (MPM) are some common prognostic systems used to predict the outcome of criti-cally ill patients admitted to the intensive care unit (ICU) [2, 3].
The performance of these models has been extensively validated, predominantly in high-income countries (HICs)
[4–6]. These results may not be reproducible in low or
middle-income countries (LMICs), not only because of different case-mix characteristics but also because of miss-ing predictor variables. Predictor variables that are rou-tinely available in HIC ICUs (e.g. arterial oxygenation) are often not obtainable or reliable where resources are lim-ited [7, 8]. Furthermore, data collection and recording may not be as robust in these settings as in HICs; paper-based recording systems, limited availability of staff and lack of staff training regarding data collection are frequent challenges [9]. The presence of missing values, if imputed
as normal as per convention [3, 4, 10–13], will lead to
underestimation of the scores and mortality. As part of quality improvement initiatives within ICUs, severity-adjusted mortality rates, which are calculated based on these prognostic systems, are increasingly used as tools for evaluating the impact of new therapies or organisational changes and for benchmarking; there-fore, underestimating the risk could result in errone-ous admission policies and an underestimation of the quality of care, performance and effectiveness when used for benchmarking [14]. Additionally, the diag-nostic categories in these progdiag-nostic models may not be suited to capture diagnoses more common in these countries, such as dengue, malaria, snakebite and organo-phosphate poisoning. Furthermore, hospital discharge
out-comes may not be readily accessible [15–17]. These and
other factors influence the performance of the models, which may then require adjustment in the form of recali-bration (adjustment of the intercept of the model and overall adjustment of the associations (relative weights) of the predictors with the outcome) and/or model revision (adjustment of individual predictor-outcome associations
and addition or removal of new predictors) [18–20].
The objective of this article is to systematically review literature on the use of critical care prognostic models in LMICs and assess their ability to discriminate between survivors and non-survivors at hospital discharge of
those admitted to ICUs, their calibration and accuracy, and the manner in which missing values are handled.
Methods
Literature search and eligibility criteria
The PubMed database was searched in March 2017, for research articles using the following search strategy:
(critical OR intensive) AND (mortality OR survival OR
prognostic OR predictive)AND(scoring system OR rating
system OR APACHE OR SAPS OR MPM) in the title,
abstract and keywords (Additional file 1).
No restrictions were placed on date of publication. Titles and abstracts returned were analysed for eligibility (RH, II). Abstracts reporting the performance of prog-nostic models were hand searched to identify studies carried out in ICUs in LMICs (as classified by the World Bank [21]) and full-text copies retrieved. Full-text arti-cles were also retrieved when the title or abstract did not provide the country setting. The references of all selected reports were thereafter cross-checked for other potentially relevant articles.
The inclusion criteria for this review were studies carried out in ICUs in LMICs; those evaluating or devel-oping prognostic models in adult ICU patients designed to predict mortality, whether ICU or hospital mortality.
The exclusion criteria for this review were: studies car-ried out only in ICUs in HICs or in paediatric ICUs; organ failure scoring systems such as SOFA that are not designed for predicting mortality; studies evaluating models in relation to a specific disease (e.g. liver cirrho-sis) or limited to trauma patients; those assessing a single prognostic factor (e.g. microalbuminurea); studies published in languages other than English; studies pub-lished only as abstracts, editorials, letters and systematic or narrative reviews; and duplicate publications.
Where ICUs in both HICs and LMICs were included in a study, only data from the low/middle-income coun-try were to be extracted. Likewise, where a single-factor or disease-specific scoring system and a non-specialty-specific scoring system were evaluated, only the data pertaining to the latter were extracted. Studies where both adult and paediatric patients were admitted to the same ICU and studies where the age limits of patients were not specified were to be included in this review.
Data extraction and critical appraisal
The full-text articles were reviewed to assess eligibility for inclusion in the report. Disagreements between the two reviewers were resolved by discussion. The list of extracted items was based on the guidance issued by Cochrane for data extraction [22] and critical appraisal for systematic reviews of prediction models (the CHARMS checklist [23]). A second reviewer checked
or unexpected findings. If an article described mul-tiple models, separate data extraction was carried out for each model.
Descriptive analyses
Results were summarised using descriptive statistics. A formal meta-analysis was not planned as it was envis-aged that the studies would be too heterogeneous, and a narrative synthesis was undertaken. Discrimination was assessed by the area under the receiver operating charac-teristic (AUROC) when reported [24]. Discrimination was considered excellent, very good, good, moderate or
poor with AUROC values of 0.9–0.99, 0.8–0.89, 0.7–
0.79, 0.6–0.69 and≤0.6, respectively [25, 26]. Calibration
was assessed by the Hosmer–Lemeshow C statistic
(significant departures from perfect calibration were
in-ferred when p values were less than 0.05 [24, 26]).
Accuracy (the proportion of true positive and true nega-tive in all evaluated cases [27]) was also considered.
Results
Study characteristics
Of the 2233 studies obtained from PubMed searches, 473 were searched and 43 met the inclusion criteria. Seven further studies were included after cross-checking the ref-erence lists of the selected studies (Fig. 1). Fifty studies met the review criteria and were selected for analysis.
Quality assessment
Study quality was assessed in accordance with the CHARMS guidelines [23] and is presented as Additional file 2. Variations existed in the conduct and reporting of the studies, especially with regard to inclusion and ex-clusion criteria, missing value handling, and perform-ance and outcome measures.
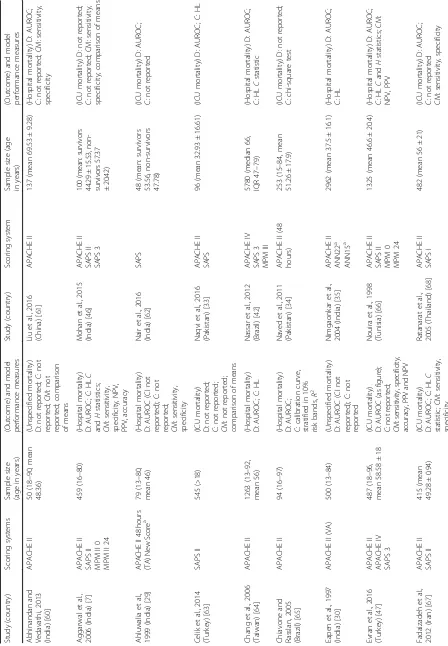
[image:3.595.59.539.319.722.2]Forty-three of the studies were carried out prospectively. The studies were carried out in 19 different LMICs, with the largest number carried out in India (studies = 11, models evaluated = 22), Thailand (studies = 6, models eval-uated = 17) and Brazil (studies = 6, models evaleval-uated = 17) (Table 1). Model adjustment was most frequent in India
(n= 4 models). Settings, hospital and ICU characteristics
are presented in Additional file 2.
Sample sizes ranged from 48 to 5780, and participant ages ranged from 1 month to 100 years (Table 1). Of the 33 studies reporting a lower age limit, 17 reported par-ticipants under the age of 18 years (Table 1).
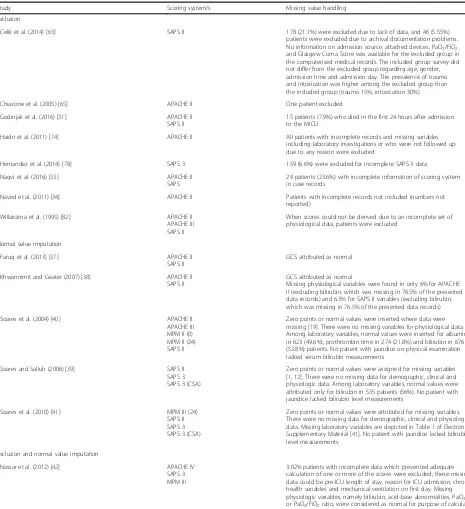
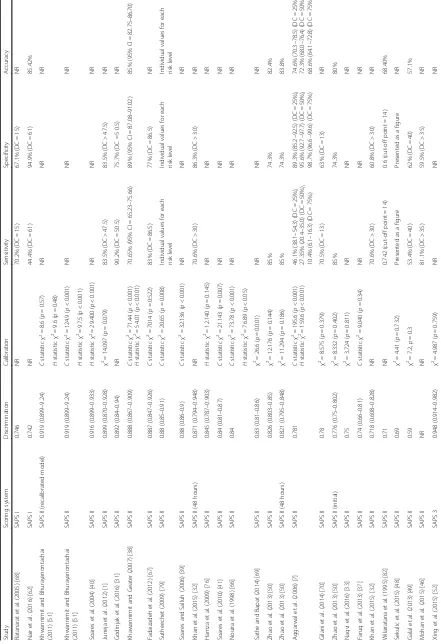
Missing value handling was explicitly mentioned in 17 studies (Table 2). One study reported incomplete data for 26.4% of its patients but did not provide details on how this was handled [28]. Patients were excluded in
nine of the studies [28–36], normal physiological values
were imputed in five studies [37–41] and both exclusion
(for missing variables such as chronic health status) and imputation by normal (for missing physiological values) occurred in two studies [42, 43]. No other methods of imputation were described. For the most commonly assessed models (APACHE II, SAPS II and SAPS 3) missing values were mentioned only 34.1%, 31.0% and 42.9% of the time respectively.
Model performance
The 50 studies reported a total of 114 model perform-ance evaluations for nine versions of APACHE, SAPS
and MPM as described in the subsection ‘Evaluation of
the performance of existing models’. Three of the
analysed studies [29, 35, 43] also described the develop-ment of five new prediction models in LMIC settings. These five new models are presented separately.
Evaluation of the performance of existing models
Model performance is described in the following in terms of the performance of the individual model
evalu-ations carried out (n= 114).
External evaluation of models (model performance evaluation on a related but different population than the population on which the model has originally been devel-oped [44]) was carried out 108 times as follows: perform-ance of APACHE II was evaluated 36 times, of APACHE III five times, of APACHE IV seven times, of SAPS I twice, of SAPS II 26 times, of SAPS 3 13 times, of MPM I twice, of MPM II 12 times and of MPM III five times (Table 1).
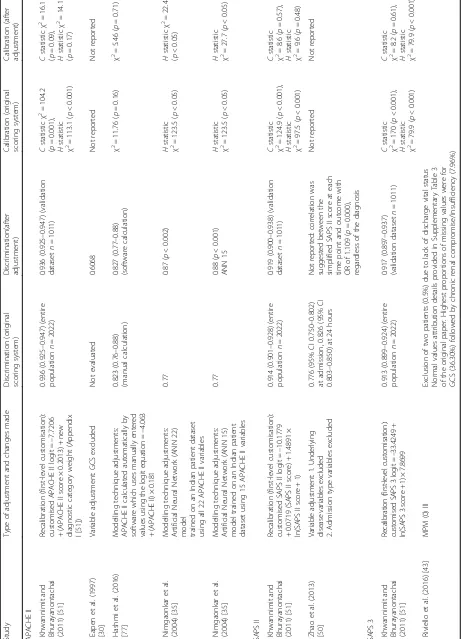
Model adjustment was carried out six times (Table 3): three models were recalibrated using first-level custom-isation (computing a new logistic coefficient, while maintaining the same variables with the same weights as in the original model); two models were revised by the exclusion and/or substitution of variables; and one evaluation altered the way in which APACHE II was
calculated—from the usual manual method to automatic
calculation using custom-built software.
The mortality endpoint assessed for 60 (52.6%) of the performance evaluations was hospital or post-hospital mortality; for 47 (41.2%) evaluations it was ICU mortal-ity and for seven (6.1%) the mortalmortal-ity endpoint was not specified (Table 1).
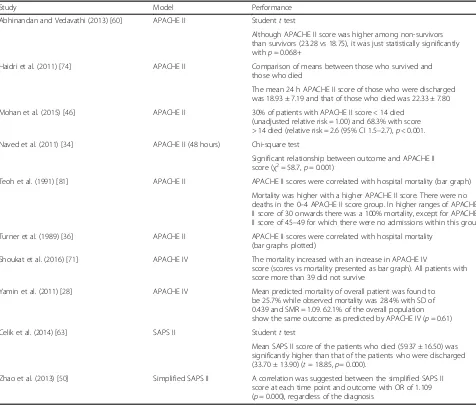
Ten (6%) model performance evaluations did not re-port either discrimination or calibration. The methods used for evaluation are presented in Table 4.
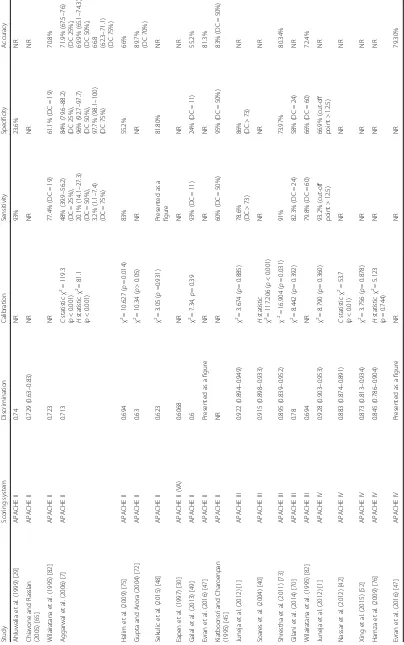
Tables 5, 6 and 7 describe the model performance of all versions of APACHE, SAPS and MPM respectively in terms of discrimination, calibration and accuracy.
Discriminatory ability of models
Discrimination was reported for 104 (91.2%) of the eval-uated models (Tables 5, 6 and 7). In three evaluations (two studies [45, 46]) it was reported as sensitivity and specificity only. In 101 model performance evaluations, discrimination was reported as the AUROC; in four of these evaluations AUROC was presented as a figure and a numerical value could not be ascertained [47, 48]. Where the AUROC was reported in numerical form (97 model performance evaluations) a confidence interval was only reported in 63 evaluations.
Where the AUROC was reported as a numerical value, 21 evaluations (21.7%) reported excellent discrimination. For all versions of APACHE II, SAPS II, SAPS 3 and MPM II, excellent discrimination was reported in 16.1%, 11.5%, 47.7% and 36.4% of the model evaluations respectively.
Sixty-six (68.0%) model evaluations reported very good or good discrimination; for all versions of APACHE II this was 67.7%, for SAPS II was 80.8%, for SAPS 3 was 58.3% and for MPM II it was 45.5%. Poor discrimination was reported on one occasion only, for an evaluation of SAPS II [49].
Excellent discrimination was reported more frequently
when hospital mortality (n= 15, 25%) was the outcome
in comparison to when it was ICU mortality (n= 6,
10%). Normal value imputation resulted in better
dis-crimination (n= 4, 25% excellent and n= 9, 56.25% very
good) than exclusion (n= 1, 8.33% excellent and n= 3,
25.0% very good) or where missing values were not
re-ported (n= 16, 19.0% excellent and n= 32, 38.1% very
good). Discrimination was better for all models with scores calculated further into the ICU stay when com-pared with those calculated earlier on [32, 48, 50].
Four (n= 2 studies) of the six evaluations with model
adjustments compared them to the original model (Table 3). However an independent validation set was employed in only one study (three validations), where the models were recalibrated [51]. For all three modes (APACHE II, SAPS II and SAPS 3), recalibration
calibration; and discrimination which was already excel-lent remained the same.
Ability of models to calibrate
Only 82 (71.9%) evaluations reported calibration (Tables 5,
6 and 7). The Hosmer–Lemeshow test was reported for
both C and H statistics 17 (20.7%) times, for C statistic
only 21 (25.6%) times, for H statistic only nine (10.9%)
times and without further detail 35 (42.7%) times.
A p value greater than 0.05 for the Hosmer–Lemeshow
statistic was reported by 49 (59.8%) evaluations that reported calibration. For all versions of APACHE II, SAPS II, SAPS 3
and MPM II, p> 0.05 was reported in 60.9%, 59%, 66.7%
[image:8.595.60.525.97.606.2]and 50% of model performance evaluations respectively.
Table 2Missing value handling
Study Scoring system/s Missing value handling
Exclusion
Celik et al. (2014) [63] SAPS II 178 (21.1%) were excluded due to lack of data, and 46 (5.55%) patients were excluded due to archival documentation problems. No information on admission source, attached devices, PaO2/FiO2
and Glasgow Coma Score was available for the excluded group in the computerised medical records. The included group survey did not differ from the excluded group regarding age, gender, admission time and admission day. The prevalence of trauma and intoxication was higher among the excluded group than the included group (trauma 15%, intoxication 30%)
Chiavone et al. (2005) [65] APACHE II One patient excluded
Godinjak et al. (2016) [31] APACHE II SAPS II
15 patients (7.9%) who died in the first 24 hours after admission to the MICU
Haidri et al. (2011) [74] APACHE II All patients with incomplete records and missing variables including laboratory investigations or who were not followed up due to any reason were excluded
Hernandez et al. (2014) [78] SAPS 3 159 (6.6%) were excluded for incomplete SAPS 3 data
Naqvi et al. (2016) [33] APACHE II
SAPS
29 patients (23.6%) with incomplete information of scoring system in case records
Naved et al. (2011) [34] APACHE II Patients with incomplete records not included (numbers not reported)
Willairatna et al. (1995) [82] APACHE II APACHE III SAPS II
When scores could not be derived due to an incomplete set of physiological data, patients were excluded
Normal value imputation
Faruq et al. (2013) [37] APACHE II
SAPS II
GCS attributed as normal
Khwannimit and Geater (2007) [38] APACHE II SAPS II
GCS attributed as normal
Missing physiological variables were found in only 6% for APACHE II (excluding bilirubin, which was missing in 76.5% of the presented data records) and 6.3% for SAPS II variables (excluding bilirubin, which was missing in 76.5% of the presented data records)
Soares et al. (2004) [40] APACHE II
APACHE III MPM II (0) MPM II (24) SAPS II
Zero points or normal values were inserted where data were missing [19]. There were no missing variables for physiological data. Among laboratory variables, normal values were inserted for albumin in 623 (49.6%), prothrombin time in 274 (21.8%) and bilirubin in 676 (53.8%) patients. No patient with jaundice on physical examination lacked serum bilirubin measurements
Soares and Salluh (2006) [39] SAPS II SAPS 3 SAPS 3 (CSA)
Zero points or normal values were assigned for missing variables [1,12]. There were no missing data for demographic, clinical and physiologic data. Among laboratory variables, normal values were attributed only for bilirubin in 535 patients (56%). No patient with jaundice lacked bilirubin level measurements
Soares et al. (2010) [41] MPM III (24) SAPS II SAPS 3 SAPS 3 (CSA)
Zero points or normal values were attributed for missing variables. There were no missing data for demographic, clinical and physiologic data. Missing laboratory variables are depicted in Table1of Electronic Supplementary Material [41]. No patient with jaundice lacked bilirubin level measurements
Exclusion and normal value imputation
Nassar et al. (2012) [42] APACHE IV
SAPS 3 MPM III
3.02% patients with incomplete data which prevented adequate calculation of one or more of the scores were excluded; these missing data could be pre-ICU length of stay, reason for ICU admission, chronic health variables and mechanical ventilation on first day. Missing physiologic variables, namely bilirubin, acid-base abnormalities, PaO2
or PaO2/FiO2ratio, were considered as normal for purpose of calculations
APACHEAcute Physiology and Chronic Health Evaluation,SAPSSimplified Acute Physiology Score,SAPS (CSA), Simplified Acute Physiology Score (Central and South American),
MPMMortality Probability Models,GCSGlasgow Coma Score,ICUintensive care unit,MICUmedical intensive care unit,PaO2partial pressure arterial oxygen,FiO2fraction of
Ten evaluations that reported excellent discrimination also reported good calibration. Of these, three were for first-level customisations of APACHE II, SAPS II and SAPS
3 (calibration resulted in p< 0.05 for the Hosmer–
Leme-show statistic when the non-customised model was used) [51]. The other evaluations that reported excellent dis-crimination and good calibration were carried out in three studies; Juneja et al. (APACHE III, APACHE IV, MPM II (initial), MPM III (initial) and SAPS 3) [1], Sekulic et al. (MPM II at 7 days) [48] and Xing et al. (SAPS 3) [52].
A p value greater than 0.05 was reported more
fre-quently when ICU mortality was the outcome (n= 27,
77.1%) than when hospital mortality was the outcome
(n= 13, 27.7%). A p value greater than 0.05 for the
Hosmer–Lemeshow statistic was obtained through
exclu-sion of missing values 100% of the time (n= 3), by normal
value imputation 40.9% of the time (n= 9) or where missing
values were not reported 54.7% of the time (n= 29).
Accuracy of models
Accuracy was reported for 29 evaluations (25.0%) and ranged from 55.20 to 89.7% (Tables 5, 6 and 7).
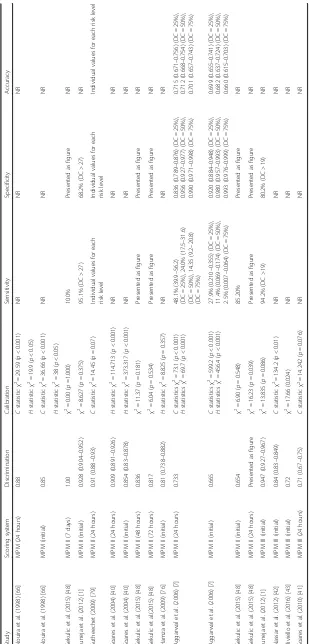
New model development
[image:10.595.58.534.98.504.2]Three studies reported five new model developments [35, 36, 43]. These are described in Table 8. For all five new models, the AUROC was higher than that obtained with the original prognostic scoring system on which it was based. A good calibration was reported for both R-MPM and Simplified R-R-MPM; a poor calibration was re-ported for MPM-III. A poor calibration was rere-ported for both ANN 22 and ANN 15 as well as for the original APACHE II on which they were based.
Table 4Model performance where discrimination was not reported
Study Model Performance
Abhinandan and Vedavathi (2013) [60] APACHE II Studentttest
Although APACHE II score was higher among non-survivors than survivors (23.28 vs 18.75), it was just statistically significantly
withp= 0.068+
Haidri et al. (2011) [74] APACHE II Comparison of means between those who survived and
those who died
The mean 24 h APACHE II score of those who were discharged was 18.93 ± 7.19 and that of those who died was 22.33 ± 7.80.
Mohan et al. (2015) [46] APACHE II 30% of patients with APACHE II score < 14 died
(unadjusted relative risk = 1.00) and 68.3% with score
> 14 died (relative risk = 2.6 (95% CI 1.5–2.7),p< 0.001.
Naved et al. (2011) [34] APACHE II (48 hours) Chi-square test
Significant relationship between outcome and APACHE II
score (χ2= 58.7,
p= 0.001)
Teoh et al. (1991) [81] APACHE II APACHE II scores were correlated with hospital mortality (bar graph)
Mortality was higher with a higher APACHE II score. There were no
deaths in the 0–4 APACHE II score group. In higher ranges of APACHE
II score of 30 onwards there was a 100% mortality, except for APACHE
II score of 45–49 for which there were no admissions within this group
Turner et al. (1989) [36] APACHE II APACHE II scores were correlated with hospital mortality
(bar graphs plotted)
Shoukat et al. (2016) [71] APACHE IV The mortality increased with an increase in APACHE IV
score (scores vs mortality presented as bar graph). All patients with score more than 39 did not survive
Yamin et al. (2011) [28] APACHE IV Mean predicted mortality of overall patient was found to
be 25.7% while observed mortality was 28.4% with SD of 0.439 and SMR = 1.09. 62.1% of the overall population
show the same outcome as predicted by APACHE IV (p= 0.61)
Celik et al. (2014) [63] SAPS II Studentttest
Mean SAPS II score of the patients who died (59.37 ± 16.50) was significantly higher than that of the patients who were discharged
(33.70 ± 13.90) (t= 18.85,p= 0.000).
Zhao et al. (2013) [50] Simplified SAPS II A correlation was suggested between the simplified SAPS II
score at each time point and outcome with OR of 1.109
(p= 0.000), regardless of the diagnosis
APACHEAcute Physiology and Chronic Health Evaluation,SAPSSimplified Acute Physiology Score,CIconfidence interval,SDstandard deviation,ORodds ratio,
Table
5
Model
performance
for
all
versions
o
f
APACHE
(Continued)
Study
Scoring
system
Discrimination
Calibration
Sensitivity
Specificity
Accuracy
Ahluwalia
et
al.
(1999)
[
29
]
APACHE
II
0.74
NR
93%
23.6%
NR
Chiavone
and
Rasslan
(2005)
[
65
]
APACHE
II
0.729
(0.63
–
0.83)
NR
NR
NR
NR
Wilairatana
et
al.
(1995)
[
82
]
APACHE
II
0.723
NR
77.4%
(DC
=
19)
61.1%
(DC
=
19)
70.8%
Aggarwal
et
al.
(2006)
[
7
]
APACHE
II
0.713
C
statistic
χ
2=
119.3
(
p
<
0.001)
H
statistic
χ
2=
81.1
(
p
<
0.001)
48%
(39.9
–
56.2)
(DC
=
25%),
20.1%
(14.1
–
27.3)
(DC
=
50%),
3.2%
(1.1
–
7.4)
(DC
=
75%)
84%
(79.6
–
88.2)
(DC
25%),
96%
(92.7
–
97.7)
(DC
50%),
97.7%
(98.1
–
100)
(DC
75%)
71.9%
(67.5
–
76)
(DC
25%),
69.9%
(65.1
–
74.3)
(DC
50%),
66.8 (62.3
–
71.1)
(DC
75%)
Halim
et
al.
(2009)
[
75
]
APACHE
II
0.694
χ
2=
10.627
(
p
=
0.014)
83%
55.2%
66%
Gupta
and
Arora
(2004)
[
72
]
APACHE
II
0.63
χ
2=
10.34
(
p
>
0.05)
NR
NR
89.7% (DC
70%)
Sekulic
et
al.
(2015)
[
48
]
APACHE
II
0.623
χ
2=
3.05
(
p
=0.931)
Presented
as
a
figure
81.80%
NR
Eapen
et
al.
(1997)
[
30
]
APACHE
II
(VA)
0.6068
NR
NR
NR
NR
Galal
et
al.
(2013)
[
49
]
APACHE
II
0.6
χ
2=
7.34,
p
=
0.39
93%
(DC
=
11)
24%
(DC
=
11)
55.2%
Evran
et
al.
(2016)
[
47
]
APACHE
II
Presented
as
a
figure
NR
NR
NR
81.3%
Kiatboonsri
and
Charoenpan
(1995)
[
45
]
APACHE
II
NR
NR
60%
(DC
=
50%)
95%
(DC
=
50%)
83%
(DC
=
50%)
Juneja
et
al.
(2012)
[
1
]
APACHE
III
0.922
(0.894
–
0.949)
χ
2=
3.674
(
p
=
0.885)
78.6% (DC
>
73)
86% (DC
>
73)
NR
Soares
et
al.
(2004)
[
40
]
APACHE
III
0.915
(0.898
–
0.933)
H
statistic
χ
2=
117.206
(
p
<
0.001)
NR
NR
NR
Shrestha
et
al.
(2011)
[
73
]
APACHE
III
0.895
(0.839
–
0.952)
χ
2=
16.904
(
p
=
0.031)
91%
73.97%
80.34%
Gilani
et
al.
(2014)
[
70
]
APACHE
III
0.78
χ
2=
8.442
(
p
=
0.392)
82.3%
(DC
=
24)
58%
(DC
=
24)
NR
Wilairatana
et
al.
(1995)
[
82
]
APACHE
III
0.694
NR
79.8%
(DC
=
60)
66%
(DC
=
60)
72.4%
Juneja
et
al.
(2012)
[
1
]
APACHE
IV
0.928
(0.903
–
0.953)
χ
2=
8.790
(
p
=
0.360)
93.2%
(cut-off
point
>
12.5)
66.9%
(cut-off
point
>
12.5)
NR
Nassar
et
al.
(2012)
[
42
]
APACHE
IV
0.883
(0.874
–
0.891)
C
statistic
χ
2=
53.7
(
p
<
0.01)
NR
NR
NR
et
al.
(2015)
[
52
]
APACHE
IV
0.873
(0.813
–
0.934)
χ
2=
3.756
(
p
=
0.878)
NR
NR
NR
Hamza
et
al.
(2009)
[
76
]
APACHE
IV
0.845
(0.786
–
0.904)
H
statistic
χ
2=
5.123
(
p
=
0.744)
NR
NR
NR
Evran
et
al.
(2016)
[
47
]
APACHE
IV
Presented
as
a
figure
NR
NR
NR
79.30%
APACHE
Acute
Physiology
and
Chronic
Health
Evaluation,
CI
confidence
interval,
NR
not
reported,
DC
decision
[image:12.595.69.473.89.734.2]Table
6
Model
performance
for
all
versions
o
f
SAPS
(Continued)
Study
Scoring
system
Discrimination
Calibration
Sensitivity
Specificity
Accuracy
Khwannimit
and
Bhurayanontachai
(2011)
[
51
]
SAPS
3
(AUS)
(recalibrated
model)
0.917
(0.902
–
0.929)
C
statistic
χ
2=
8.2
(
p
=
0.61)
NR
NR
NR
H
statistic
χ
2=
79.9
(
p
<
0.001)
Khwannimit
and
Bhurayanontachai
(2011)
[
51
]
SAPS
3
(AUS)
0.917
(0.902
–
0.929)
C
statistic
χ
2=
170
(
p
<
0.001)
NR
NR
NR
H
statistic
χ
2=
79.9
(
p
<
0.001)
Khwannimit
and
Bhurayanontachai
(2011)
[
51
]
SAPS
3
0.914
(0.901
–
0.928)
C
statistic
χ
2=
176.3
(
p
<
0.001)
NR
NR
NR
H
statistic
χ
2=
101.6
(
p
<
0.001)
Juneja
et
al.
(2012)
[
1
]
SAPS
3
0.901
(0.871
–
0.932)
χ
2=
13.123
(
p
=
0.
108)
76.7%
(DC
>
56.5)
84.7%
(DC
>
56.5)
NR
Soares
and
Salluh
(2006)
[
39
]
SAPS
3
(CSA)
0.87
(0.85
–
0.9)
C
statistic
χ
2=
9.132
(
p
=
0.33)
NR
NR
NR
Soares
and
Salluh
(2006)
[
39
]
SAPS
3
0.87
(0.85
–
0.9)
C
statistic
χ
2=
13.637
(
p
=
0.092)
NR
NR
NR
Silva
Junior
et
al.
(2010)
[
55
]
SAPS
3
0.86
(0.83
–
0.88)
C
statistic
χ
2=
10.47
(
p
=
0.234)
0.75
(DC
=
57)
0.86
(DC
=
57)
NR
Nassar
et
al.
(2012)
[
42
]
SAPS
3
0.855
(0.846
–
0.864)
C
statistic
χ
2=
226.6
(
p
<
0.01)
NR
NR
NR
Soares
et
al.
(2010)
[
41
]
SAPS
3
(CSA)
0.84
(0.81
–
0.87)
C
statistic
χ
2=
12.608
(
p
=
0.126)
NR
NR
NR
Soares
et
al.
(2010)
[
41
]
SAPS
3
0.84
(0.81
–
0.87)
C
statistic
χ
2=
15.804
(
p
=
0.045)
NR
NR
NR
Hernandez
et
al.
(2014)
[
78
]
SAPS
3
0.8
(0.78
–
0.81)
C
statistic
χ
2=
11.5
(
p
=
0.18)
NR
NR
NR
Evran
et
al.
(2016)
[
47
]
SAPS
3
Presented
as
a
figure
NR
NR
NR
81.3%
Mohan
et
al.
(2015)
[
46
]
SAPS
3
NR
NR
81.1%
(DC
>
47)
51.1%
(DC
>
47)
NR
SAPS
Simplifie
d
Acute
Physiology
Score,
SA
PS
(AUS)
Simplified
Acute
Physiolo
gy
Score
(Australian),
SA
PS
(CSA)
Simplified
Acute
Phys
oiology
Score
(Central
and
Souther
n
Ame
rican),
CI
confidence
interval
,
DC
decision
criteria,
NR
not
reporte
Table
8
New
model
development
(Continued)
Study
Ahluwalia
et
al.
(1999)
[
29
]
Riviello
et
al.
(2016)
[
43
]
Riviello
et
al.
(2016)
[
43
]
Nimgaonkar
et
al.
(2004)
[
35
]
Nimgaonkar
et
al.
(2004)
[
35
]
Model
evaluation
Developmental
dataset
only,
no
further
evaluation
(compared
with
APACHE
II
at
48
hours)
Internal
validation
with
bootstrapping
(compared
with
MPM
III
(initial))
Internal
validation
with
bootstrapping
(compared
with
MPM
III
(initial))
Data
from
1962
patients
were
used
to
train
the
neural
network
using
a
back-propagation
algorithm.
Data
from
the
remaining
1000
patients
were
used
for
testing
this
model
and
comparing
it
with
APACHE
II
Data
from
1962
patients
were
used
to
train
the
neural
network
using
a
back-propagation
algorithm.
Data
from
the
remaining
1000
patients
were
used
for
testing
this
model
and
comparing
it
with
APACHE
II
Results
New
score
ROC:
0.90,
sensitivity:
98.2%,
specificity:
66.6%.
APACHE
II
(after
48
hours)
ROC:
0.74,
sensitivity:
92.8%,
specificity:
23.6%
Rwanda
MPM
(R-MPM)
AUROC:
0.81
(0.77
–
0.86),
HL:
χ
2=
11.94
(
p
=
0.154).
MPM
III
(initial)
AUROC:
0.72,
HL:
χ
2=
17.66
(
p
=
0.024)
Simplified
R-MPM
AUROC:
0.76,
HL:
χ
2=
11.46
(
p
=
0.177).
MPM
III
(initial)
AUROC:
0.72,
HL:
χ
2=
17.66
(
p
=
0.024)
ANN
22
AUROC:
0.87,
HL
H
statistic:
χ
2=
22.4
(
p
<
0.05).
APACHE
II
AUROC:
0.77,
HL Hstatistic: 2χ=
123.5
(
p
<
0.05)
ANN
15
AUROC:
0.88,
HL Hstatistic: 2χ=
27.7
(
p
<
0.05).
APACHE
II
AUROC:
0.77,
HL Hstatistic: 2χ=
123.5
(
p
<
0.05)
APACHE
Acute
Physiology
and
Chronic
Health
Evaluation,
MPM
Mortality
Probability
Models,
ICU
intensive
care
unit,
GCS
Glasgow
Coma
Score,
IQR
interquartile
range,
HL
Hosmer
–
Lemeshow
statistic,
AUROC
area
under
the
receiver
operating
Discussion
This systematic review of critical care prognostic models in LMICs reports good to excellent discrimination in 88.9% of evaluations between survivors and non-survivors of ICU admission and good calibration in 58.3% of those reporting calibration. In keeping with findings in HICs [3, 53], this review found good discrim-ination to be more frequently reported than good
cali-bration; although good discrimination and good
calibration were rarely (11.9%) reported together in the same evaluation [1, 48, 51, 52]. Three of the 10 evalua-tions reporting both excellent discrimination and good calibration were from recalibrated models [51], and in
two [48] the sample size was small (n= 60). It is known
that a calibration measure such as the Hosmer–
Leme-show goodness-of-fit test might demonstrate high p
values in these circumstances, simply as a consequence of the test having lower power and not necessarily as an indication of a good fit [53].
Differences in predictors in the different models (e.g. acute diagnosis is a variable in APACEHE II but not SAPS II) and the differences in the datasets used in the various studies may have contributed to the discrepan-cies seen in performances of the models. Three major findings, with special relevance to the LMIC settings, limit generalisability and can affect performance: post-ICU outcomes were not available for 40.5% where post-ICU mortality was the outcome; only 44.8% reported a lower age limit, with 55.8% of these including patients who were aged younger than 18 years; and missing values and their handling. The original models being evaluated were developed to assess hospital mortality. Therefore, the lack of post-ICU outcome may impact on their performance, particularly as discharge from the ICU (es-pecially in these settings) may be influenced by non-clinical discharge decisions such as shortage of ICU beds. However, post-ICU follow-up may not always be feasible in these settings due to the lack of established follow-up systems (e.g. medical registries, electronic records). Patient age may affect model performance and could be another cause for the heterogeneity seen be-tween studies. The lower age limit for admission to adult ICUs varies between settings, perhaps resulting in the admission of paediatric patients into adult ICUs (and their subsequent use in the datasets for the validation of adult prognostic models). Twenty-three studies did not report a lower age limit for patient admission and 17 studies included patients younger than the age of 18 years; the variation in both age criteria for inclusion and for reporting make unfeasible a complete exclusion of paediatric patients from this review of adult prognos-tic models. Missing value handling, which can lead to bias and thus influence model performance especially in LMIC settings [53], was only reported infrequently.
Where reported, imputation by normal values (which is less justifiable in LMIC settings [9]) and exclusion of in-complete records (leading to inefficient use of the data-set) were the methods frequently utilised. Research into the utility of other techniques of imputation (e.g. mul-tiple imputation) for missing values may reduce bias and increase the interpretability of model performance. However, missing values in prognostic models in LMIC settings are likely to be a persistent problem. Some of these difficulties may be alleviated by increasing efforts to improve the availability and recording of measures such as GCS and saturations or by effecting substitu-tions for the measurements that are more inaccessible in LMIC settings (e.g. urea for creatinine and saturations
for PaO2). Although two studies in this review reported
the exclusion of variables [30, 50], the effect of the modifications could not be ascertained: in one case, no comparison was made with the original APACHE II model [30]; and in the second, discrimination was not reported for the simplified version of SAPS II [50]; calibration was not reported for either of these models.
Validation studies of prognostic models in LMIC settings are becoming more common; 16 of the 50 studies included were published in 2015, 2016 or 2017 and additional stud-ies, for example Moralez et al. in Brazil [54] and Haniffa et al. [9] in Sri Lanka, have been published/awaiting publica-tion subsequent to the literature search for this review. Consequently it is important for investigators to adhere to
reporting standards, such as CHARMS—especially with
re-gard to performance measures, outcomes and missing
values—to enable better interpretation.
points in the same setting and only three studies were conducted in two or more hospitals [41, 43, 55].
The use of prognostic models in practice is thought to be influenced by the complexity of the model, the format of the model, the ease of use and the perceived relevance of the model to the user [56]. The development of models with fewer and more commonly available mea-sures perhaps in conjunction with medical registries pro-moting research may also be effective in improving mortality prediction in these settings; for example, the simplified Rwanda MPM [43] and TropICS [57]. Introdu-cing simple prognostic models like those already mentioned and emphasising their usefulness by pro-viding output that is relevant to clinicians, adminis-trators and patients is therefore more likely to result in the collection of required data and their applica-tion in a clinical context.
ICU risk prediction models need to exhibit good calibration before they can be used for quality im-provement initiatives [58, 59]. Setting-relevant models such as TropICS [57], which are well calibrated, can be used for stratification of critically ill patients according to severity, which is a pre-requisite for impact assessment of training and other quality im-provement initiatives. However, models that show poor calibration but have a good discriminatory abil-ity may still be of benefit if their intended use is for identifying high-risk patients for diagnostic testing or therapy and/or for inclusion criteria or covariate adjustment in a randomised controlled trial [58, 59].
Limitations
This review was limited to a single database (PubMed). There is no MeSH for LMIC (non-HIC) and hence a hand search strategy was deployed. No attempt was made to distinguish between upper and lower middle-income countries which are very heterogeneous in terms of provision, resources and access to healthcare. The re-view was intended to be for adult prognostic models used only in adult patients; however, due to the manner in which the studies were reported it was not possible to exclude paediatric patients.
Conclusion
Performance of mortality risk prediction models for ICU patients in LMICs is at most moderate, especially with limitations in calibration. This necessitates continued efforts to develop and validate LMIC models with readily available prognostic variables, perhaps aided by medical registries. Robust interpretations of their applicability are currently hampered by poor adherence to reporting guidelines, especially when reporting missing value handling.
Additional files
Additional file 1:A table presenting the search terms used. (XLSX 27 kb)
Additional file 2:A table presenting the checklist for critical appraisal and data extraction for systematic reviews of prediction modelling studies. (XLSX 41 kb)
Acknowledgements
Not applicable.
Funding
None.
Availability of data and materials
All data generated or analysed during this study are included in this published article (and its Additional files 1 and 2).
Authors’contributions
RH and AMD conceived the study and developed the study design. RH and II performed the primary study search, extracted data, carried out statistical analysis, drafted the manuscript, and revised the manuscript. NFDK, AMD and APDS improved the idea and design, and revised the manuscript. All authors read and approved the final manuscript.
Ethics approval and consent to participate
Not applicable.
Consent for publication
Not applicable.
Competing interests
The authors declare that there are no competing interests.
Publisher’s Note
Springer Nature remains neutral with regard to jurisdictional claims in published maps and institutional affiliations.
Author details
1Centre for Tropical Medicine and Global Health, Nuffield Department of
Medicine, University of Oxford, Oxford, UK.2Network for Improving Critical
Care Systems and Training, Colombo, Sri Lanka.3AA (Ltd), London, UK.
4
National Intensive Care Surveillance, Ministry of Health, Amsterdam,
Netherlands.5Mahidol–Oxford Tropical Medicine Research Unit, Faculty of
Tropical Medicine, Mahidol University, Bangkok, Thailand.6Department of
Medical Informatics, Academic Medical Center, Amsterdam, Netherlands.
Received: 4 August 2017 Accepted: 21 December 2017
References
1. Juneja D, Singh O, Nasa P, et al. Comparison of newer scoring systems with the conventional scoring systems in general intensive care population. Minerva Anestesiol. 2012;78(2):194–200. https://www.minervamedica.it/en/ journals/minerva-anestesiologica/article.php?cod=R02Y2012N02A0194. Accessed 4 Oct 2016.
2. Rapsang AG, Shyam DC. Scoring systems in the intensive care unit: a compendium. Indian J Crit Care Med. 2014;18(4):220–8. https://doi.org/10. 4103/0972-5229.130573.
3. Vincent JJ-L, Moreno RR, Moreno RR, et al. Clinical review: scoring systems in the critically ill. Crit Care. 2010;14(2):207. https://doi.org/10.1186/cc8204. 4. Knaus WA, Zimmerman JE, Wagner DP, et al. APACHE-acute physiology and
chronic health evaluation: a physiologically based classification system. Crit Care Med. 1981;9(8):591–7. http://journals.lww.com/ccmjournal/Abstract/ 1981/08000/APACHE_acute_physiology_and_chronic_health.8.aspx. Accessed 4 Oct 2016.
6. Le Gall J-R, Lemeshow S, Saulnier F, et al. A New Simplified Acute Physiology Score (SAPS II) based on a European/North American Multicenter Study. JAMA J Am Med Assoc. 1993;270(24):2957. https://doi. org/10.1001/jama.1993.03510240069035.
7. Aggarwal AN, Sarkar P, Gupta D, et al. Performance of standard severity scoring systems for outcome prediction in patients admitted to a respiratory intensive care unit in North India. Respirology. 2006;11(2):196–204. https://doi. org/10.1111/j.1440-1843.2006.00828.x.
8. Namendys-Silva SA, Silva-Medina MA, Vásquez-Barahona GM, et al. Application of a modified sequential organ failure assessment score to critically ill patients. Braz J Med Biol Res. 2013;46(2):186–93. https://www. ncbi.nlm.nih.gov/pmc/articles/PMC3854366/. Accessed 10 Aug 2016. 9. Haniffa R, De Silva AP, Weerathunga P, et al. Applicability of the APACHE II
model to a lower middle income country. J Crit Care. 2017;42:178–83. http://www.jccjournal.org/article/S0883-9441(17)31025-0/fulltext. Accessed 13 July 2017.
10. Knaus WA, Draper EA, Wagner DP, et al. Prognosis in acute organ-system failure. Ann Surg. 1985;202(6):685–93. https://www.ncbi.nlm.nih.gov/pmc/ articles/PMC1250999/. Accessed 27 Sept 2016.
11. Cullen DJ, Civetta JM, Briggs BA, et al. Therapeutic intervention scoring system: a method for quantitative comparison of patient care. Crit Care Med. 1974; 2(2):57–60. http://journals.lww.com/ccmjournal/Abstract/1974/03000/Therapeutic_ intervention_scoring_system__a_method.1.aspx. Accessed 12 Dec 2016. 12. Lemeshow S, Teres D, Klar J, et al. Mortality Probability Models (MPM II)
based on an international cohort of intensive care unit patients. JAMA. 1993;270(20):2478–86. https://jamanetwork.com/journals/jama/article-abstract/409377?redirect=true. Accessed 12 Dec 2016.
13. Vincent J-L, Moreno R, Takala J, et al. The SOFA (Sepsis-related Organ Failure Assessment) score to describe organ dysfunction/failure. On behalf of the Working Group on Sepsis-Related Problems of the European Society of Intensive Care Medicine. Intensive Care Med. 1996;22(7):707–10. https://doi. org/10.1007/BF01709751.
14. Steyerberg EW, Vickers AJ, Cook NR, et al. Assessing the performance of prediction models: a framework for some traditional and novel measures. Epidimiology. 2010;21(1):128–38. https://doi.org/10.1097/EDE.
0b013e3181c30fb2.
15. Haniffa R, De Silva AP, Iddagoda S, et al. A cross-sectional survey of critical care services in Sri Lanka: a lower middle-income country. J Crit Care. 2014; 29(5):764–8. https://doi.org/10.1016/j.jcrc.2014.04.021.
16. Haniffa R, De Silva AP. National Intensive Care Surveillance. A Survey Report on Intensive Care Units of the Government Hospitals in Sri Lanka. Colombo: National Intensive Care Surveillance Unit Division of Deputy Director General (Medical Services); 2012. ISBN 978-955-0505-25-8.
17. Adhikari NKJ, Rubenfeld GD. Worldwide demand for critical care. Curr Opin Crit Care. 2011;17(6):620–5. https://doi.org/10.1097/MCC.0b013e32834cd39c. 18. Moons KGM, Altman DG, Vergouwe Y, et al. Prognosis and prognostic
research: application and impact of prognostic models in clinical practice. BMJ. 2009;338:b606.
19. Rivera-Fernández R, Vázquez-Mata G, Bravo M, et al. The Apache III prognostic system: customized mortality predictions for Spanish ICU patients. Intensive Care Med. 1998;24(6):574–81. https://link.springer.com/ article/10.1007/s001340050618. Accessed 5 Oct 2016.
20. Sakr Y, Krauss C, Amaral ACKB, et al. Comparison of the performance of SAPS II, SAPS 3, APACHE II, and their customized prognostic models in a surgical intensive care unit. Br J Anaesth. 2008;101(6):798–803. https://doi. org/10.1093/bja/aen291.
21. World Bank. Low and middle income data. 2017. http://data.worldbank.org/ income-level/low-and-middle-income?view=chart.. Accessed 13 July 2017. 22. Higgins JPT, Green S, editors. Cochrane Handbook for Systematic Reviews of
Interventions Version 5.1.0 [updated March 2011]. The Cochrane Collaboration; 2011. Available from http://handbook-5-1.cochrane.org/. 23. Moons KGM, de Groot JAH, Bouwmeester W, et al. Critical appraisal and
data extraction for systematic reviews of prediction modelling studies: the CHARMS Checklist. PLoS Med. 2014;11(10):e1001744. https://doi.org/10.1371/ journal.pmed.1001744.
24. Ridley S. Severity of illness scoring systems and performance appraisal. Anaesthesia. 1998;53(12):1185–94. https://doi.org/10.1046/j.1365-2044. 1998.00615.x.
25. Bouch DC, Thompson JP. Severity scoring systems in the critically ill. Contin Educ Anaesthesia, Crit Care Pain. 2008;8(5):181–5. https://doi.org/10.1093/ bjaceaccp/mkn033.
26. Vincent JL. Severity of illness scoring system. In: Roberts PR, editor. Comprehensive Critical Care: Adult. 2012:875-84). Retrieved from https:// med.uth.edu/anesthesiology/files/2015/05/Chapter-47-Severity-of-Illness-Scoring-Systems.pdf.
27. Baratloo A, Hosseini M, Negida A, El Ashal G. Part 1: Simple definition and calculation of accuracy. Sensitivity and specificity. Emergency. 2015;3(2):48–9. 28. Yamin S, Vaswani AK, Afreedi M. Predictive efficasy of APACHE IV at ICUs of
CHK. Pakistan J Chest Med. 2011;17(1):1-14. http://www.pjcm.net/index.php/ pjcm/article/view/132/125. Accessed 18 May 2016.
29. Ahluwalia G, Pande JN, Sharma SK. Prognostic scoring for critically ill hospitalized patients. Indian J Chest Dis Allied Sci. 1974;41(4):201–6. http:// www.ncbi.nlm.nih.gov/pubmed/10661007. Accessed 7 Nov 2015. 30. Eapen CE, Thomas K, Cherian AM, et al. Predictors of mortality in a medical
intensive care unit. Natl Med J India. 1974;10(6):270–2. http://archive.nmji.in/ approval/archive/Volume-10/issue-6/original-articles-2.pdf.
31. Godinjak AG, Iglica A, Rama A, et al. Predictive value of SAPS II and APACHE II scoring systems for patient outcome in medical intensive care unit. Acta Med Acad. 2016;45(2):89–95. https://doi.org/10.5644/ ama2006-124.165.
32. Khan M, Maitree P, Radhika A. Evaluation and comparison of the three scoring systems at 24 and 48 h of admission for prediction of mortality in an Indian ICU: a prospective cohort study. Ain-Shams J Anaesthesiol. 2015; 8(3):294–300. https://doi.org/10.4103/1687-7934.159003.
33. Naqvi IH, Mahmood K, Ziaullaha S, et al. Better prognostic marker in ICU—APACHE II, SOFA or SAP II! Pak J Med Sci.2016;32(5):PMC5103123. https://doi.org/10.12669/pjms.325.10080.
34. Naved SA, Siddiqui S, Khan FH. APACHE-II score correlation with mortality and length of stay in an intensive care unit. J Coll Physicians Surg Pakistan. 2011;21(1):4–8. https://doi.org/01.2011/JCPSP.0408.
35. Nimgaonkar A, Karnad DR, Sudarshan S, et al. Prediction of mortality in an Indian intensive care unit. Comparison between APACHE II. Intensive Care Med. 2004;30(2):248–53. https://doi.org/10.1007/s00134-003-2105-4. 36. Turner JS, Potgieter PD, Linton DM. Systems for scoring severity of illness in
intensive care. S Afr Med J. 1989;76(1):17–20. http://archive.samj.org.za/ 1989%20VOL%20LXXVI%20Jul-Dec/Articles/07%20July/1.
7%20SYSTEMS%20FOR%20SCORING%20SEVERITY%20OF%20ILLNESS% 20IN%20THE%20RSA.%20J.A.%20Frean,%20W.F.%20Carman,%20H.H. %20Crewe-Brown.pdf. Accessed 7 Nov 2015.
37. Faruq MO, Mahmud MR, Begum T, et al. Comparison of severity systems APACHE II and SAPS II in critically ill patients. Bangladesh Crit Care J. 2013; 1(1):27–32. http://dx.doi.org/10.3329/bccj.v1i1.14362.
38. Khwannimit B, Geater A. A comparison of APACHE II and SAPS II scoring systems in predicting hospital mortality in Thai adult intensive care units. J Med Assoc Thai. 2007;90(4):643–52. http://www.jmatonline.com/index.php/ jmat/article/view/8591. Accessed 7 Nov 2015.
39. Soares M, Salluh JIF. Validation of the SAPS 3 admission prognostic model in patients with cancer in need of intensive care. Intensive Care Med. 2006; 32(11):1839–44. https://doi.org/10.1007/s00134-006-0374-4.
40. Soares M, Fontes F, Dantas J, et al. Performance of six severity-of-illness scores in cancer patients requiring admission to the intensive care unit: a prospective observational study. Crit Care. 2004;8(4):R194–203. https:// doi.org/10.1186/cc2870.
41. Soares M, Silva UVA, Teles JMM, et al. Validation of four prognostic scores in patients with cancer admitted to Brazilian intensive care units: results from a prospective multicenter study. Intensive Care Med. 2010;36(7):1188–95. https://doi.org/10.1007/s00134-010-1807-7.
42. Nassar AP, Mocelin AO, Nunes ALB, et al. Caution when using prognostic models: a prospective comparison of 3 recent prognostic models. J Crit Care. 2012;27(4):423.e1–7. https://doi.org/10.1016/j.jcrc.2011.08.016. 43. Riviello ED, Kiviri W, Fowler RA, et al. Predicting mortality in low-income
country ICUs: The Rwanda Mortality Probability Model (R-MPM). Lazzeri C, ed. PLoS One.2016;11(5):e0155858. https://doi.org/10.1371/journal. pone.0155858.
44. Steyerberg EW, Bleeker SA, Moll HA, et al. Internal and external validation of predictive models: a simulation study of bias and precision in small samples. J Clin Epidemiol. 2003;56(5):441–7. http://www.jclinepi.com/article/S0895-4356(03)00047-7/fulltext, Accessed 25 Oct 2017.
46. Mohan A, Shrestha P, Guleria R, et al. Development of a mortality prediction formula due to sepsis/severe sepsis in a medical intensive care unit. Lung India. 1974;32(4):313–19. https://doi.org/10.4103/0970-2113.159533. 47. Evran T, Serin S, Gürses E, et al. Various scoring systems for predicting
mortality in Intensive Care Unit. Niger J Clin Pract. 2016;19(4):530–4. https:// doi.org/10.4103/1119-3077.183307.
48. Sekulic AD, Trpkovic SV, Pavlovic AP, et al. Scoring systems in assessing survival of critically ill ICU patients. Med Sci Monit. 2015;21:2621–9. https:// doi.org/10.12659/MSM.894153.
49. Galal I, Kassem E, Mansour M. Study of the role of different severity scores in respiratory ICU. Egypt J Bronchol. 2013;7(2):55. https://doi.org/10.4103/1687-8426.123995.
50. Zhao X-X, Su Y-Y, Wang M, et al. Evaluation of neuro-intensive care unit performance in China: predicting outcomes of Simplified Acute Physiology Score II or Glasgow Coma Scale. Chin Med J (Engl). 2013;126(6):1132–7. http://124.205.33.103:81/ch/reader/view_abstract.aspx?file_no=12-2886&flag=1. Accessed 7 Nov 2015.
51. Khwannimit B, Bhurayanontachai R. A comparison of the performance of Simplified Acute Physiology Score 3 with old standard severity scores and customized scores in a mixed medical-coronary care unit. Minerva Anestesiol. 2011;77(3):305–12. https://www.minervamedica.it/en/journals/ minerva-anestesiologica/article.php?cod=R02Y2011N03A0305. Accessed 6 Mar 2016.
52. Xing X, Gao Y, Wang H, et al. Performance of three prognostic models in patients with cancer in need of intensive care in a medical center in China. PLoS One. 2015;10(6):e0131329. https://doi.org/10.1371/journal.pone.0131329. 53. Zhu BP, Lemeshow S, Hosmer DW, et al. Factors affecting the performance of the models in the Mortality Probability Model II system and strategies of customization: a simulation study. Crit Care Med. 1996;24(1):57–63. 54. Moralez GM, Rabello LSCF, Lisboa TC, et al. External validation of SAPS 3
and MPM0-III scores in 48,816 patients from 72 Brazilian ICUs. Ann Intensive Care. 2017;7:53. https://doi.org/10.1186/s13613-017-0276-3.
55. Silva Junior JM, Malbouisson LMS, Nuevo HL, et al. Aplicabilidade do escore fisiológico agudo simplificado (SAPS 3) em hospitais brasileiros. Rev Bras Anestesiol. 2010;60(1):20–31.
https://doi.org/10.1590/S0034-70942010000100003.
56. Hemingway H, Croft P, Perel P, et al. Prognosis research strategy
(PROGRESS) 1: a framework for researching clinical outcomes. BMJ. 2013;346: e5595. https://doi.org/10.1136/bmj.e5595.
57. Haniffa R, Mukaka M, Munasinghe SB, et al. Simplified prognostic model for critically ill patients in resource limited settings in South Asia. Crit Care. 2017;21:250. doi.org/10.1186/s13054-017-1843-6.
58. Nassar AP, Malbouisson LMS, Moreno R. Evaluation of Simplified Acute Physiology Score 3 performance: a systematic review of external validation studies. Crit Care. 2014;18(3):R117. https://doi.org/10.1186/cc13911. 59. Steyerberg EW, Moons KGM, van der Windt DA, et al. Prognosis Research
Strategy (PROGRESS) 3: prognostic model research. PLoS Med. 2013;10(2): e1001381. https://doi.org/10.1371/journal.pmed.1001381.
60. Abhinandan KS, Vedavathi R. Usefulness of Sequential Organ Failure Assessment (SOFA) and Acute Physiological and Chronic Health Evaluation II (APACHE II) score in analysing patients with multiple organ dysfunction syndrome in sepsis. J Evol Med Dent Sci. 2013;2(49):9591-605. https://jemds. com/data_pdf/dr%20abhinandan%20-.pdf. Accessed 1 Apr 2017. 61. Liu X, Shen Y, Li Z, et al. Prognostic significance of APACHE II score and
plasma suPAR in Chinese patients with sepsis: a prospective observational study. BMC Anesthesiol. 2016;16:46. https://doi.org/10.1186/s12871-016-0212-3.
62. Nair R, Bhandary NM, D’Souza AD. Initial Sequential Organ Failure Assessment score versus Simplified Acute Physiology score to analyze multiple organ dysfunction in infectious diseases in intensive care unit. Indian J Crit Care Med. 2016;20(4):210–5. https://doi.org/10.4103/0972-5229.180041. 63. Celik S, Sahin D, Korkmaz C, et al. Potential risk factors for patient mortality
during admission to the intensive care units. Saudi Med J. 2014;35(2):159– 64. https://www.smj.org.sa/index.php/smj/article/view/2805. Accessed 6 Mar 2016.
64. Chang L, Horng C-F, Huang Y-CT, et al. Prognostic accuracy of Acute Physiology and Chronic Health Evaluation II scores in critically ill cancer patients. Am J Crit Care. 2006;15(1):47–53. http://ajcc.aacnjournals.org/ content/15/1/47.long. Accessed 1 Apr 2017.
65. Chiavone PA, Rasslan S. Influence of time elapsed from end of emergency surgery until admission to intensive care unit, on Acute Physiology and
Chronic Health Evaluation II (APACHE II) prediction and patient mortality rate. Sao Paulo Med J. 2005;123(4):167–74. https://doi.org//S1516-31802005000400003.
66. Nouira S, Belghith M, Elatrous S, et al. Predictive value of severity scoring systems: comparison of four models in Tunisian adult intensive care units. Crit Care Med. 1998;26(5):852–9. http://journals.lww.com/ccmjournal/ Abstract/1998/05000/Predictive_value_of_severity_scoring_systems_.16.aspx. Accessed 6 Mar 2016.
67. Fadaizadeh L, Tamadon R, Saeedfar K, et al. Performance assessment of Acute Physiology and Chronic Health Evaluation II and Simplified Acute Physiology Score II in a referral respiratory intensive care unit in Iran. Acta Anaesthesiol Taiwanica. 2012;50(2):59–62. https://doi.org/10.1016/j.aat.2012.05.004. 68. Ratanarat R, Thanakittiwirun M, Vilaichone W, et al. Prediction of mortality
by using the standard scoring systems in a medical intensive care unit in Thailand. J Med Assoc Thai. 2005;88(7):949–55. https://pdfs.semanticscholar. org/426c/15599cf5b85adcb291dbae9e60408dbe743a.pdf. Accessed 7 Nov 2015.
69. Sathe PM, Bapat SN. Assessment of performance and utility of mortality prediction models in a single Indian mixed tertiary intensive care unit. Int J Crit Illn Inj Sci. 2014;4(1):29–34. https://doi.org/10.4103/2229-5151.128010. 70. Gilani MT, Razavi M, Azad A. A comparison of Simplified Acute Physiology
Score II, Acute Physiology and Chronic Health Evaluation II and Acute Physiology and Chronic Health Evaluation III scoring system in predicting mortality and length of stay at surgical intensive care unit. Niger Med J. 2014;55(2):144–7. https://doi.org/10.4103/0300-1652.129651.
71. Shoukat H, Muhammad Y, Gondal KM, et al. Mortality prediction in patients admitted in surgical intensive care unit by using APACHE IV. J Coll Physicians Surg Pak. 2016;26(11):877–80. https://doi.org/2468.
72. Gupta R, Arora VK. Performance evaluation of APACHE II score for an Indian patient with respiratory problems. Indian J Med Res. 2004;119(6):273–82. http://www.ijmr.in/CurrentTopicView.aspx?year=
Indian%20J%20Med%20Res%20119,%20June%202004,%20pp%20273-282$Original%20Article. Accessed 7 Nov 2015.
73. Shrestha GS, Gurung R, Amatya R. Comparison of Acute Physiology, Age, Chronic Health Evaluation III score with initial Sequential Organ Failure Assessment score to predict ICU mortality. Nepal Med Coll J. 2011;13(1):50– 4. http://nmcth.edu/images/gallery/Editorial/3EFLlgs_shrestha.pdf. Accessed 6 Mar 2016.
74. Haidri FR, Rizvi N, Motiani B. Role of APACHE score in predicting mortality in chest ICU. J Pak Med Assoc. 2011;61(6):589–92. http://jpma.org.pk/full_ article_text.php?article_id=2828. Accessed 6 Mar 2016.
75. Halim DA, Murni TW, Redjeki IS. Comparison of APACHE II, SOFA, and Modified SOFA Scores in Predicting Mortality of Surgical Patients in Intensive Care Unit at Dr. Hasan Sadikin General Hospital. Crit Care Shock. 2009;12(4):157–69. http://criticalcareshock.org/files/Original-Comparison-of- Apache-II-SOFA-and-Modified-SOFA-Scores-in-Predicting-Mortality-of- Surgical-Patients-in-Intensive-Care-Unit-at-Dr.-Hasan-Sadikin-General-Hospital1.pdf.
76. Hamza A, Hammed L, Abulmagd M, et al. Evaluation of general ICU outcome prediction using different scoring systems. Med J Cairo Univ. 2009; 77(1):27-35. http://medicaljournalofcairouniversity.net/Home/images/pdf/ 2009/march/35.pdf. Accessed 8 Nov 2016.
77. Hashmi M, Asghar A, Shamim F, et al. Validation of acute physiologic and chronic health evaluation II scoring system software developed at The Aga Khan University. Pakistan Saudi J Anaesth. 2016;10(1):45. https://doi.org/10. 4103/1658-354X.169474.
78. Hernandez AMR, Palo JEM, Sakr Y, et al. Performance of the SAPS 3 admission score as a predictor of ICU mortality in a Philippine private tertiary medical center intensive care unit. J Intensive Care. 2014;2(1):29. https://doi.org/10.1186/2052-0492-2-29.
79. Sutheechet N. Assessment and comparison of the performance of SAPS II and MPM 24 II scoring systems in predicting hospital mortality in intensive care units. Bull Dep Med Serv Thail. 2009;34(11):641-50. http://www.dms. moph.go.th/dmsweb/dmsweb_v2_2/content/org/journal/data/2009-11_ p641-650.pdf. Accessed 11 Aug 2016.
80. Hosseini M, Ramazani J. Comparison of acute physiology and chronic health evaluation II and Glasgow Coma Score in predicting the outcomes of Post Anesthesia Care Unit’s patients. Saudi J Anaesth. 1974;9(2):136–41. https:// doi.org/10.4103/1658-354X.152839.
Malaysia. 1991;46(1):72–81. http://www.e-mjm.org/1991/v46n1/APACHE_II. pdf. Accessed 6 Mar 2016.
82. Wilairatana P, Noan NS, Chinprasatsak S, et al. Scoring systems for predicting outcomes of critically ill patients in northeastern Thailand. Southeast Asian J Trop Med Public Health. 1995;26(1):66–72. http://www.tm.mahidol.ac.th/ seameo/1995-26-1/1995-26-1-66.pdf. Accessed 7 Nov 2015.
• We accept pre-submission inquiries
• Our selector tool helps you to find the most relevant journal
• We provide round the clock customer support
• Convenient online submission
• Thorough peer review
• Inclusion in PubMed and all major indexing services
• Maximum visibility for your research
Submit your manuscript at www.biomedcentral.com/submit