R E S E A R C H
Open Access
Associations of arterial carbon dioxide and
arterial oxygen concentrations with hospital
mortality after resuscitation from cardiac arrest
Hendrik J. F. Helmerhorst
1,2*, Marie-José Roos-Blom
3,4, David J. van Westerloo
1, Ameen Abu-Hanna
3,
Nicolette F. de Keizer
3,4and Evert de Jonge
1,4Abstract
Introduction:Arterial concentrations of carbon dioxide (PaCO2) and oxygen (PaO2) during admission to the
intensive care unit (ICU) may substantially affect organ perfusion and outcome after cardiac arrest. Our aim was to investigate the independent and synergistic effects of both parameters on hospital mortality.
Methods:This was a cohort study using data from mechanically ventilated cardiac arrest patients in the Dutch National Intensive Care Evaluation (NICE) registry between 2007 and 2012. PaCO2and PaO2levels from arterial
blood gas analyses corresponding to the worst oxygenation in the first 24 h of ICU stay were retrieved for analyses. Logistic regression analyses were performed to assess the relationship between hospital mortality and both categorized groups and a spline-based transformation of the continuous values of PaCO2and PaO2.
Results:In total, 5,258 cardiac arrest patients admitted to 82 ICUs in the Netherlands were included. In the first 24 h of ICU admission, hypocapnia was encountered in 22 %, and hypercapnia in 35 % of included cases. Hypoxia and hyperoxia were observed in 8 % and 3 % of the patients, respectively. Both PaCO2and PaO2had an independent
U-shaped relationship with hospital mortality and after adjustment for confounders, hypocapnia and hypoxia were significant predictors of hospital mortality: OR 1.37 (95 % CI 1.17–1.61) and OR 1.34 (95 % CI 1.08–1.66). A
synergistic effect of concurrent derangements of PaCO2 and PaO2 was not observed (P = 0.75).
Conclusions: The effects of aberrant arterial carbon dioxide and arterial oxygen concentrations were independently but not synergistically associated with hospital mortality after cardiac arrest.
Introduction
Even after successful resuscitation and return of spon-taneous circulation (ROSC), cardiac arrest carries a poor prognosis with limited options for treatment [1, 2]. In addition to controlling temperature after cardiac arrest, optimizing ventilation and oxygenation may improve outcome [3]. International consensus currently recom-mends careful monitoring of post-resuscitation ventila-tion for neurological and cardiovascular outcome [4]. Indeed, targeting safe levels of carbon dioxide and oxygen in arterial blood may limit global ischemic damage and
enhance oxygenation and blood flow. Aberrant arterial levels have repeatedly been shown to be associated with worse outcome after cardiac arrest, but the effects may de-pend on degree and duration of the (concurrent) exposure [5–14]. Recently, a large cohort study was performed in 125 intensive care units (ICUs) in Australia and New Zealand, which showed that abnormal concentrations of arterial carbon dioxide (PaCO2) were common after cardiac arrest [15]. Compared with normocapnia, hypocapnia was independently associated with worse clinical outcomes, whereas hypercapnia was associated with a greater likelihood of good outcome. The results were reproduced in a smaller cohort [16] and are supported by pediatric [17] and experimental research [18–20]. However, ventilation and oxygenation are closely related and effects of PaCO2 may not be independent from arterial oxygen levels (PaO2). In this study, we aimed to investigate the * Correspondence:H.J.F.Helmerhorst@lumc.nl
1
Department of Intensive Care Medicine, Leiden University Medical Center, Post Box 9600, Leiden 2300 RC, The Netherlands
2
Laboratory of Experimental Intensive Care and Anesthesiology, Academic Medical Center, Meibergdreef 9, Amsterdam 1105 AZ, The Netherlands Full list of author information is available at the end of the article
© 2015 Helmerhorst et al.Open AccessThis article is distributed under the terms of the Creative Commons Attribution 4.0 International License (http://creativecommons.org/licenses/by/4.0/), which permits unrestricted use, distribution, and reproduction in any medium, provided you give appropriate credit to the original author(s) and the source, provide a link to the Creative Commons license, and indicate if changes were made. The Creative Commons Public Domain Dedication waiver (http://creativecommons.org/publicdomain/zero/1.0/) applies to the data made available in this article, unless otherwise stated. Helmerhorstet al. Critical Care (2015) 19:348
separate and combined effects of both parameters in a multicenter cohort of patients admitted to Dutch ICUs after cardiac arrest.
Methods
Data collection
Analyses were performed on patient data retrieved from 82 ICUs of teaching and non-teaching hospitals partici-pating in the Dutch National Intensive Care Evaluation (NICE) registry between 2007 and 2012. The NICE registry is a high quality ICU database, which is subject to multiple quality checks and local audits in accordance with applicable research and ethical protocols [21]. In brief, the registry contains all clinical data required to calculate mortality risk predictions according to, among others, the Acute Physiology and Chronic Health Evalu-ation (APACHE) IV for all consecutive ICU patients. The registry does not contain variables determining the cause and circumstances of the cardiac arrest and resus-citation. For the analyses, data obtained from routine care and without patient identifying information were used and consent was therefore not needed according to the Dutch Personal Data Protection Act.
In 2012, approximately 90 % of all Dutch ICUs recorded the data for their patients in the registry. In accordance with the previously conducted study by Schneider et al. [15], all adult patients admitted after out-of-hospital cardiac arrest were included. Abstracted data included demographics, comorbidities, arterial blood gas parameters, diagnostic and physiologic information, admission source and illness severity score by means of the APACHE IV.
Data extraction
Adult patients admitted to the ICU after out-of-hospital cardiac arrest and cardiopulmonary resuscitation, who were mechanically ventilated at any moment in the first 24 h of admission, were included. We excluded readmis-sions, trauma patients, nonventilated patients and records not meeting APACHE IV criteria.
As part of the NICE data collection, arterial blood gas (ABG) parameters that were associated with the lowest PaO2to FiO2ratio in the first 24 h after admission were automatically extracted and subsequently used for classifi-cation of patients. The APACHE IV score was recalculated (AP4-adj) by standardizing the PaCO2and PaO2to fixed normal values (40 mmHg and 80 mmHg, respectively) in order to prevent overadjustment of these variables in the multivariate models.
Statistical analysis
Univariate and multivariate logistic generalized estimating equation (GEE) regression models, which account for potential correlation of outcome within ICUs, were used
to examine the relationship between the primary outcome (hospital mortality) and either PaCO2or PaO2. The rela-tionship of PaCO2and PaO2with mortality was plotted in order to inspect the dose–response curve. Considering the nonlinear relationships, the associations were analyzed by modeling each of PaCO2and PaO2as a restricted cubic spline and separately in categorized groups [22]. PaCO2 was categorized in three groups, using conventional thresholds (normocapnia: 35–45 mmHg). PaO2was cate-gorized according to thresholds from previous studies (normoxia: 60–300 mmHg) [5, 7–9, 23, 24]. The individ-ual, joint and interaction effects of two-sided derange-ments were separately investigated, as suggested for cohort studies [25]. For a further understanding of the dose–response relationship in multivariate models, PaO2 categories were also reanalyzed with alternative thresholds derived from observation percentiles or previously used targets [5, 7, 8, 26]. Variables extracted from the first 24 h of admission were considered for the multivariate etio-logical model based on clinical relevance and in accord-ance with a previously used model [15]. Considered covariates were introduced separately to the univariate models in order to estimate the unadjusted effect and in-cluded age, gender, AP4-adj, year of admission, admission source, therapeutic hypothermia and lowest glucose as a possible proxy-marker of less attentive care [24]. Covari-ates were subsequently identified as confounders for the outcome using the 10 % change-in-estimate method [27]. Hence, the final multivariate GEE models consisted of age, lowest glucose, AP4-adj and either PaCO2or PaO2. Col-linearity among the covariates was inspected by estimating Pearson or Spearman correlation coefficients as appropri-ate. Routine temperature correction of arterial blood gas results is uncommon in Dutch ICUs and was performed according to the participating site’s practice. To account for multiple testing, the statistical significance level for the P-value was set at 0.01.
All analyses were conducted using SPSS version 21 (IBM Corp, Armonk, NY, USA) and R version 3.0.1 (R Foundation for Statistical Computing, Vienna, Austria).
Results
Data from 6,496 out-of-hospital cardiac arrest patients and 82 hospitals were extracted from the NICE registry and screened for enrollment (Additional file 1: Figure S1). The main reasons for exclusion were no mechanical ventilation (n = 196), missing valid ABG data (n = 379) and not fulfilling APACHE IV criteria (n = 314).
Descriptive characteristics of the 5,258 included patients are summarized in Table 1. The median age was 66 (interquartile range [IQR] 56–76) and patients were
predominantly male (69.6 %). Median PaCO2 was 42
mmHg (IQR 36–49) and median PaO2 was 92 mmHg
(IQR 75–124). Of all patients, 21.6 % were classified as
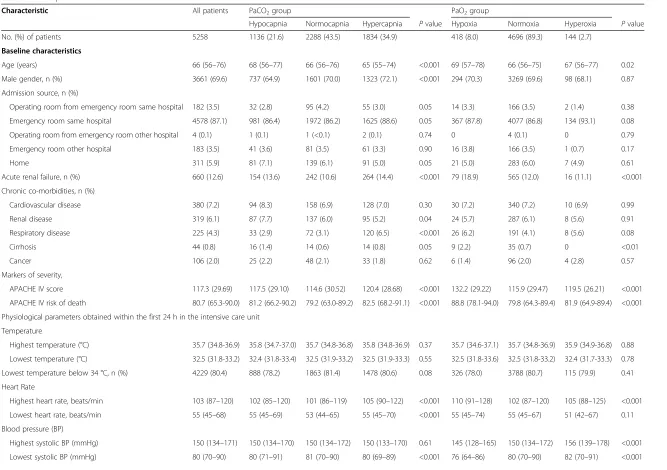
Table 1Descriptive characteristics
Characteristic All patients PaCO2group PaO2group
Hypocapnia Normocapnia Hypercapnia Pvalue Hypoxia Normoxia Hyperoxia Pvalue
No. (%) of patients 5258 1136 (21.6) 2288 (43.5) 1834 (34.9) 418 (8.0) 4696 (89.3) 144 (2.7)
Baseline characteristics
Age (years) 66 (56–76) 68 (56–77) 66 (56–76) 65 (55–74) <0.001 69 (57–78) 66 (56–75) 67 (56–77) 0.02
Male gender, n (%) 3661 (69.6) 737 (64.9) 1601 (70.0) 1323 (72.1) <0.001 294 (70.3) 3269 (69.6) 98 (68.1) 0.87
Admission source, n (%)
Operating room from emergency room same hospital 182 (3.5) 32 (2.8) 95 (4.2) 55 (3.0) 0.05 14 (3.3) 166 (3.5) 2 (1.4) 0.38
Emergency room same hospital 4578 (87.1) 981 (86.4) 1972 (86.2) 1625 (88.6) 0.05 367 (87.8) 4077 (86.8) 134 (93.1) 0.08
Operating room from emergency room other hospital 4 (0.1) 1 (0.1) 1 (<0.1) 2 (0.1) 0.74 0 4 (0.1) 0 0.79
Emergency room other hospital 183 (3.5) 41 (3.6) 81 (3.5) 61 (3.3) 0.90 16 (3.8) 166 (3.5) 1 (0.7) 0.17
Home 311 (5.9) 81 (7.1) 139 (6.1) 91 (5.0) 0.05 21 (5.0) 283 (6.0) 7 (4.9) 0.61
Acute renal failure, n (%) 660 (12.6) 154 (13.6) 242 (10.6) 264 (14.4) <0.001 79 (18.9) 565 (12.0) 16 (11.1) <0.001
Chronic co-morbidities, n (%)
Cardiovascular disease 380 (7.2) 94 (8.3) 158 (6.9) 128 (7.0) 0.30 30 (7.2) 340 (7.2) 10 (6.9) 0.99
Renal disease 319 (6.1) 87 (7.7) 137 (6.0) 95 (5.2) 0.04 24 (5.7) 287 (6.1) 8 (5.6) 0.91
Respiratory disease 225 (4.3) 33 (2.9) 72 (3.1) 120 (6.5) <0.001 26 (6.2) 191 (4.1) 8 (5.6) 0.08
Cirrhosis 44 (0.8) 16 (1.4) 14 (0.6) 14 (0.8) 0.05 9 (2.2) 35 (0.7) 0 <0.01
Cancer 106 (2.0) 25 (2.2) 48 (2.1) 33 (1.8) 0.62 6 (1.4) 96 (2.0) 4 (2.8) 0.57
Markers of severity,
APACHE IV score 117.3 (29.69) 117.5 (29.10) 114.6 (30.52) 120.4 (28.68) <0.001 132.2 (29.22) 115.9 (29.47) 119.5 (26.21) <0.001
APACHE IV risk of death 80.7 (65.3-90.0) 81.2 (66.2-90.2) 79.2 (63.0-89.2) 82.5 (68.2-91.1) <0.001 88.8 (78.1-94.0) 79.8 (64.3-89.4) 81.9 (64.9-89.4) <0.001
Physiological parameters obtained within the first 24 h in the intensive care unit
Temperature
Highest temperature (°C) 35.7 (34.8-36.9) 35.8 (34.7-37.0) 35.7 (34.8-36.8) 35.8 (34.8-36.9) 0.37 35.7 (34.6-37.1) 35.7 (34.8-36.9) 35.9 (34.9-36.8) 0.88
Lowest temperature (°C) 32.5 (31.8-33.2) 32.4 (31.8-33.4) 32.5 (31.9-33.2) 32.5 (31.9-33.3) 0.55 32.5 (31.8-33.6) 32.5 (31.8-33.2) 32.4 (31.7-33.3) 0.78
Lowest temperature below 34 °C, n (%) 4229 (80.4) 888 (78.2) 1863 (81.4) 1478 (80.6) 0.08 326 (78.0) 3788 (80.7) 115 (79.9) 0.41
Heart Rate
Highest heart rate, beats/min 103 (87–120) 102 (85–120) 101 (86–119) 105 (90–122) <0.001 110 (91–128) 102 (87–120) 105 (88–125) <0.001
Lowest heart rate, beats/min 55 (45–68) 55 (45–69) 53 (44–65) 55 (45–70) <0.001 55 (45–74) 55 (45–67) 51 (42–67) 0.11
Blood pressure (BP)
Highest systolic BP (mmHg) 150 (134–171) 150 (134–170) 150 (134–172) 150 (133–170) 0.61 145 (128–165) 150 (134–172) 156 (139–178) <0.001
Lowest systolic BP (mmHg) 80 (70–90) 80 (71–91) 81 (70–90) 80 (69–89) <0.001 76 (64–86) 80 (70–90) 82 (70–91) <0.001
Helmerho
rst
et
al.
Critical
Care
(2015) 19:348
Page
3
of
Table 1Descriptive characteristics(Continued)
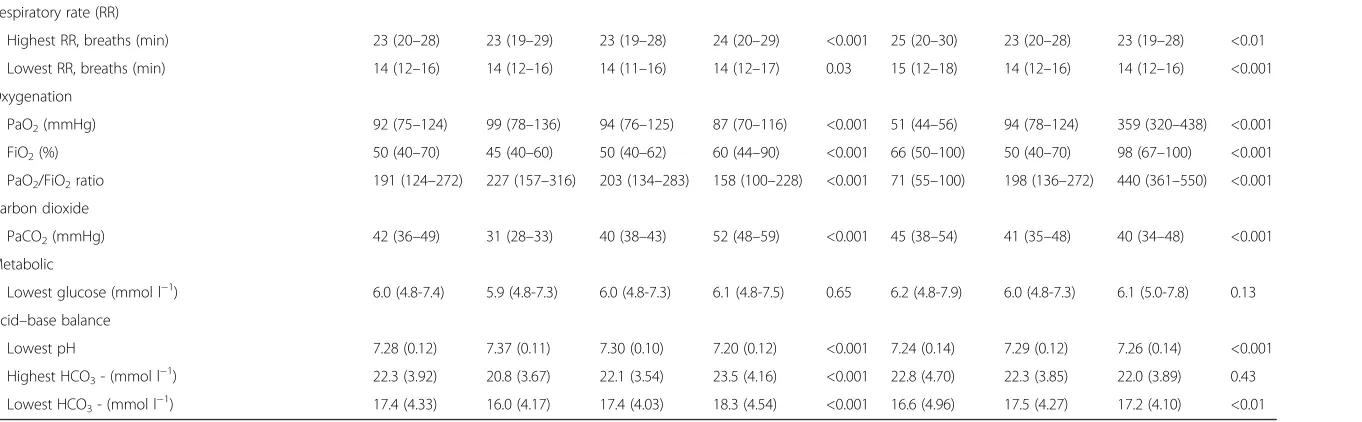
Respiratory rate (RR)
Highest RR, breaths (min) 23 (20–28) 23 (19–29) 23 (19–28) 24 (20–29) <0.001 25 (20–30) 23 (20–28) 23 (19–28) <0.01
Lowest RR, breaths (min) 14 (12–16) 14 (12–16) 14 (11–16) 14 (12–17) 0.03 15 (12–18) 14 (12–16) 14 (12–16) <0.001
Oxygenation
PaO2(mmHg) 92 (75–124) 99 (78–136) 94 (76–125) 87 (70–116) <0.001 51 (44–56) 94 (78–124) 359 (320–438) <0.001
FiO2(%) 50 (40–70) 45 (40–60) 50 (40–62) 60 (44–90) <0.001 66 (50–100) 50 (40–70) 98 (67–100) <0.001
PaO2/FiO2ratio 191 (124–272) 227 (157–316) 203 (134–283) 158 (100–228) <0.001 71 (55–100) 198 (136–272) 440 (361–550) <0.001
Carbon dioxide
PaCO2(mmHg) 42 (36–49) 31 (28–33) 40 (38–43) 52 (48–59) <0.001 45 (38–54) 41 (35–48) 40 (34–48) <0.001
Metabolic
Lowest glucose (mmol l−1) 6.0 (4.8-7.4) 5.9 (4.8-7.3) 6.0 (4.8-7.3) 6.1 (4.8-7.5) 0.65 6.2 (4.8-7.9) 6.0 (4.8-7.3) 6.1 (5.0-7.8) 0.13
Acid–base balance
Lowest pH 7.28 (0.12) 7.37 (0.11) 7.30 (0.10) 7.20 (0.12) <0.001 7.24 (0.14) 7.29 (0.12) 7.26 (0.14) <0.001
Highest HCO3- (mmol l−1) 22.3 (3.92) 20.8 (3.67) 22.1 (3.54) 23.5 (4.16) <0.001 22.8 (4.70) 22.3 (3.85) 22.0 (3.89) 0.43
Lowest HCO3- (mmol l−1) 17.4 (4.33) 16.0 (4.17) 17.4 (4.03) 18.3 (4.54) <0.001 16.6 (4.96) 17.5 (4.27) 17.2 (4.10) <0.01
Data presented as total number (percentage), mean (standard deviation) or median (interquartile range) depending on underlying data distribution P-values for group comparisons using ANOVA or Kruskal-Wallis according to data distribution
APACHEAcute Physiology and Chronic Health Evaluation,ANOVAAnalysis of variance
Helmerho
rst
et
al.
Critical
Care
(2015) 19:348
Page
4
of
hypocapnic, 43.5 % as normocapnic and 34.9 % as hyper-capnic. Patients were further classified as hypoxic (8 %), normoxic (89.3 %) or hyperoxic (2.7 %). The majority of patients (87.4 %) were admitted to the ICU from the emergency room of the same hospital. The unadjusted mean APACHE IV score was 117.3, with the normocap-nia and the normoxia groups showing the lowest mean (P < 0.001). Groups were relatively balanced in terms of admission source, comorbidities, temperature, glucose and non-respiratory markers.
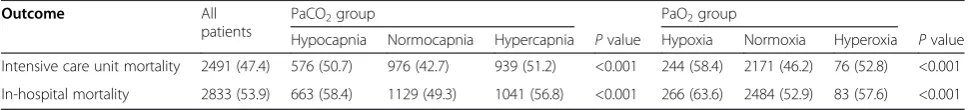
Unadjusted outcome
Table 2 shows the unadjusted mortality rates. Overall, 2,491 (47.4 %) patients died in the ICU and 2,833 (53.9 %) died in the hospital. Hospital mortality was highest in the hypocapnia group (58.4 %), compared with the hypercap-nia (56.8 %) and normocaphypercap-nia (49.3 %) group (P < 0.001). Compared with the hyperoxia (57.6 %) and normoxia (52.9 %) groups, hospital mortality was higher (P < 0.001) in the hypoxia group (63.6 %).
In the univariate logistic regression model, PaCO2was significantly associated with mortality (P < 0.001). This model was improved when PaO2 was added (P < 0.001). No interaction effect (arterial oxygen by arterial carbon dioxide concentration) on mortality was found (P = 0.25). PaO2 was also univariately associated with hospital mortality (P < 0.001).
Adjusted outcomes
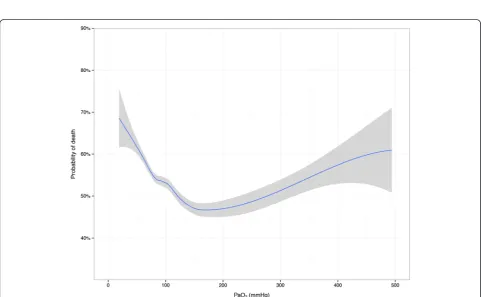
Both PaCO2 and PaO2 showed a curvilinear U-shaped relationship with mortality in adjusted analyses (Figs. 1 and 2). Odds ratios from multivariate analyses are listed in Table 3. After adjustment for age, lowest glucose, AP4-adj and PaO2 (splines), hypocapnia showed a sig-nificant association with hospital mortality (P < 0.001), whereas hypercapnia did not. When this model was rea-nalyzed without adjustment for PaO2, the results were virtually unchanged (data not shown).
Adjusted for age, lowest glucose, AP4-adj and
PaCO2(splines), hypoxia but not hyperoxia was found to be associated with hospital mortality in comparison to normoxia (P < 0.01). When this model was reanalyzed without adjustment for PaCO2 the results were not ma-terially different (data not shown). When the model was reanalyzed with hyperoxia (>300 mmHg) as reference
category, no effects on mortality were observed for various oxygenation ranges.
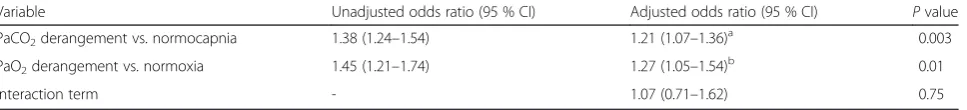
The individual and joint effect estimates for derange-ments (normal range vs. outside normal range) of both parameters are listed in Table 4. Aberrant levels of both PaCO2 and PaO2 were independently associated with hospital mortality (P < 0.01). The estimate for the interaction term (presence of PaCO2 derangement by presence of PaO2 derangement) was not significant on a multiplicative scale (P = 0.75).
Discussion
In accordance with previous studies, we found that early exposure to both hypo- and hypercapnia is common in ICU patients resuscitated from cardiac arrest [15, 16]. In contrast, hypoxia and severe hyperoxia are uncommon findings early in the ICU stay of Dutch hospitals. Both PaCO2and PaO2had a U-shaped relationship with out-come and after adjustment for known confounders, hypocapnia and hypoxia were significantly associated with hospital mortality. Hyperoxia was not independ-ently associated with higher mortality in comparison with various ranges for normoxia. However, this study may lack power to detect significant associations for severe arterial oxygen derangements considering the low prevalence in the present cohort.
[image:5.595.56.546.670.725.2]Our adjusted mortality plots and the categorized results stress the importance of aberrant arterial levels after cardiac arrest, but rigid cut-offs for optimal ranges remain to be determined and validated. Increasing mor-tality rates may be skewed towards extreme PaO2levels in the early phase after cardiac arrest. In line, PaCO2 levels between 40 and 45 mmHg appear to be favorable shortly after ICU admission. The complex U-shape of the survival curves for both parameters may explain the heterogeneity in previously observed associations [14]. It shows that unfavorable effects cannot be consistently captured when the results are stratified by groups based on arbitrary thresholds. Indeed, studies assessing arterial hyperoxia with lower thresholds usually failed to show significant effects on outcome, whereas higher risks were observed with substantially higher upper limits [5–9]. The current findings validate the recent calls for caution with hyperoxia in cardiac arrest patients only to a limited extent. The prevalence in this cohort shows that hypoxia and hyperoxia are not a common concern shortly after
Table 2Unadjusted mortality rates
Outcome All
patients
PaCO2group PaO2group
Hypocapnia Normocapnia Hypercapnia Pvalue Hypoxia Normoxia Hyperoxia Pvalue
Intensive care unit mortality 2491 (47.4) 576 (50.7) 976 (42.7) 939 (51.2) <0.001 244 (58.4) 2171 (46.2) 76 (52.8) <0.001
In-hospital mortality 2833 (53.9) 663 (58.4) 1129 (49.3) 1041 (56.8) <0.001 266 (63.6) 2484 (52.9) 83 (57.6) <0.001
Data presented as total number (percentage) per group. P-values for group comparisons using Chi-squared test
Fig. 1Adjusted probability of in-hospital death by arterial carbon dioxide levels. Loess smoothing curve predicted from logistic regression model adjusted for spline functions of age, lowest glucose, AP4-adj and PaO2. Grey zones represent 95 % confidence intervals
Fig. 2Adjusted probability of in-hospital death by arterial oxygen levels. Loess smoothing curve predicted from logistic regression model adjusted for spline functions of age, lowest glucose, AP4-adj and PaCO2. Grey zones represent 95 % confidence intervals
[image:6.595.57.545.89.367.2] [image:6.595.57.539.406.703.2]cardiac arrest patients are admitted to Dutch ICUs. In the analyses of those conditions, the relatively small number of exposed patients increases the probability of type 2 errors. Associations are, therefore, more likely to be consistent with increasing statistical power in the studied subgroups. Moreover, reanalyzing the adjusted effects of oxygenation based on quintiles did not detect a significant association with mortality (data not shown). Hypothesizing that physicians would avoid hypoxia most attentively in the most critically ill patients, hyperoxia could be an indirect marker of illness severity or respon-sive care, and could thereby reflect a worse outcome. Accordingly, hypoxia and hypocapnia may also be markers of less attentive care or prehospital injury.
The absence of a significant interaction effect between PaCO2and PaO2suggests that it is mainly the effect of the individual variables that influences mortality in our model rather than the absolute effect caused by the
interaction between the two variables. The effect of PaO2on hospital mortality is therefore not likely to dif-fer significantly across strata of PaCO2, or vice versa. Further, the effect size did not significantly depend on the concurrent presence of aberrant arterial carbon dioxide and arterial oxygen levels. Conditions in which both parameters are concurrently and strongly modified may, therefore, not synergistically increase the risk. However, the univariate associations of PaCO2and PaO2 were subtly altered when adjusted for each other and both parameters should, therefore, judiciously be consid-ered as possible confounders.
For our analyses, we were restricted to the variables that were collected as part of the NICE registry. Our database does not contain prehospital variables, nor does it include all ABG samples per admission, but only a sin-gle measurement associated with the worst oxygenation in the first 24 h. Although this method has not previ-ously been shown to be inferior, the selected data may not be the most representative data over the total ICU stay and may, therefore, misclassify patients. In addition, selecting either the first, worst or highest value from arterial blood gas sampling emerges as an essential methodological issue for the intended analyses [28]. The first measured sample may reflect pre-ICU treatment, including oxygen administration in the ambulance and emergency department. Early oxygen administration can influence oxidative metabolism, respiratory markers, vasoconstrictive status and blood flow [29–31], and may thus be an important predictor of outcome. In fact, both highest and lowest systolic blood pressures were signifi-cantly higher in the hyperoxia groups. Further, hyperoxia frequently coincides with hyperventilation and concurrent hypocapnia [32]. Interestingly, systemic blood pressures were very similar across the PaCO2 subgroups in this cohort. PaCO2could yet be an important mediator in vas-cular effects, cardiopulmonary resuscitation and cerebral perfusion [13, 33]. In view of that, the association between hypocapnia and mortality may be explained by cerebral vasoconstriction, whereas hypercapnia may be less harmful due to increased peripheral tissue oxygenation [34–38].
[image:7.595.57.290.111.292.2]Although our findings are observational and do not necessarily imply causality, the present results are sup-ported by previous results [5, 15]. Our findings regarding Table 4Associations between derangements and hospital mortality
Variable Unadjusted odds ratio (95 % CI) Adjusted odds ratio (95 % CI) Pvalue
PaCO2derangement vs. normocapnia 1.38 (1.24–1.54) 1.21 (1.07–1.36) a
0.003
PaO2derangement vs. normoxia 1.45 (1.21–1.74) 1.27 (1.05–1.54) b
0.01
Interaction term - 1.07 (0.71–1.62) 0.75
PaCO2derangement = PaCO2< 35 or PaCO2> 45 mmHg; normocapnia = PaCO235–45 mmHg
PaO2derangement = PaO2< 60 or PaO2> 300 mmHg; normoxia = PaO260–300 mmHg a
Multivariable analysis adjusted for age, lowest glucose, AP4-adj and PaO2(splines) b
[image:7.595.59.543.636.691.2]Multivariable analysis adjusted for age, lowest glucose, AP4-adj and PaCO2(splines) CIconfidence interval
Table 3Adjusted associations between subgroups and hospital mortality
Group comparison Odds ratio (95 % CI) Pvalue
PaCO2groups
Hypocapnia vs. normocapnia 1.39 (1.18–1.63)a <0.001
Hypercapnia vs. normocapnia 1.10 (0.95–1.27)a 0.20
Hypercapnia vs. hypocapnia 0.79 (0.67–0.94)a <0.01
PaO2groups
Hypoxia vs. normoxia 1.34 (1.08–1.66)b <0.01
Hyperoxia vs. normoxia 1.13 (0.81–1.57)b 0.46
Hyperoxia vs. hypoxia 0.85 (0.58–1.24)b 0.39
Alternative PaO2categoriesc
55-80 vs. >300 mmHg 1.06 (0.76–1.50)b 0.72
80-102 vs. >300 mmHg 0.90 (0.64–1.27)b 0.55
102-300 vs. >300 mmHg 0.79 (0.56–1.11)b 0.17
Hypocapnia = PaCO2< 35 mmHg; normocapnia = PaCO235–45 mmHg;
hypercapnia = PaCO2> 45 mmHg
Hypoxia = PaO2< 60 mmHg; normoxia = PaO260–300 mmHg;
hyperoxia = PaO2> 300 mmHg a
Multivariable analysis adjusted for age, lowest glucose, AP4-adj and PaO2(splines)
b
Multivariable analysis adjusted for age, lowest glucose, AP4-adj and PaCO2(splines)
c
Stratification based on thresholds from ARDSnet oxygenation target (55–80 mmHg), upper threshold of median cohort quintile (102 mmHg), and threshold from previous studies (300 mmHg)
hyperoxia are in line with several recent studies [8, 23, 39], even though conflicting results have been documented [6, 7, 24, 40]. Parts of the heterogeneity in previous findings may be attributed to the adjustment for PaCO2. Pure oxygen therapy after cardiac arrest has previously been shown to worsen neurological outcome in animal models [41] and exposure to hypocapnia and hypercapnia after ROSC has been associated with poor neurological function at hospital discharge [16]. However, the effects of PaO2 targets on neurological recovery of critically ill patients are still uncertain.
In contrast to the previous study by Schneider et al. [15], both the unadjusted and adjusted association between mortality and hypocapnia were statistically significant. Specific study differences may be explained by population and methodological differences. Our multivariate model differed slightly and there was less dispersion of the carbon dioxide concentrations in our data. Other notable differences between both studies include the substantially lower median PaO2(92 vs. 106 mmHg), mean FiO2(58 vs. 71 %), and marginally lower mean PaCO2 (46 vs. 44 mmHg). Furthermore, the vast majority of patients in our cohort (80 vs. 40 %) reached a temperature lower than 34 °C during the first 24 h of
ICU admission. Under these conditions, PaCO2 and
PaO2 progressively decrease with decreasing body
temperature and the occurrence of hypocapnia and hypoxia may be underestimated with uncorrected ABG levels. However, temperature correction of ABG measure-ments is ambiguous and was not routinely performed in our study or in the study by Schneider et al.
In order to consistently assess the relationship between risk factors and outcome, it is important to re-evaluate previously established associations in different populations using robust methodology. The modified methodology of the present study provides further insights into the
independent and combined effects of PaCO2 and
PaO2 and accounts for clustering by hospital, inter-action effects and model variances. Still, residual con-founding by prehospital and Utstein variables cannot be ruled out, and derangements may not be isolated risk factors for mortality.
Conclusions
In this multicenter cohort study, we have studied the survival probability inferred from different levels of PaCO2 and PaO2 in post cardiac arrest patients. Most effects were attenuated after adjustment for identified confounders, but hypocapnia and hypoxia were independ-ently associated with hospital mortality. The close rela-tionship between both parameters argues for a concurrent assessment of the effects and further evaluation of target ranges is warranted.
Key messages
After resuscitation from cardiac arrest, exposure of patients to both hypo- and hypercapnia is common within 24 h of ICU admission
Hypoxia and severe hyperoxia are uncommon findings early in the ICU stay
Both PaCO2and PaO2had an independent U-shaped relationship with hospital mortality
After adjustment for relevant confounders,
hypocapnia and hypoxia were significant predictors of hospital mortality
A synergistic effect of concurrent derangements of PaCO2and PaO2was not observed
Additional file
Additional file 1: Figure S1.Flow diagram. (PDF 193 kb)
Abbreviations
ABG:Arterial blood gas; APACHE: Acute physiology and chronic health evaluation; GEE: Generalized estimating equation; ICU: Intensive care unit; NICE: National intensive care evaluation (Dutch ICU registry); PaCO2: Arterial
concentrations of carbon dioxide; PaO2: Arterial concentrations of oxygen;
ROSC: Return of spontaneous circulation.
Competing interests
Nicolette F. de Keizer and Marie-José Roos-Blom are employed by the National Intensive Care Evaluation (NICE) foundation. All other authors declare that they have no competing interests.
Authors’contributions
HH and MB had full access to the data in the study and take responsibility for the integrity of the data and the accuracy of the data analysis. HH, MB, DW, AA, NK, and EJ contributed substantially to the study design, data analysis and interpretation, and the writing of the manuscript. All authors read and approved the final manuscript.
Author details 1
Department of Intensive Care Medicine, Leiden University Medical Center, Post Box 9600, Leiden 2300 RC, The Netherlands.2Laboratory of Experimental Intensive Care and Anesthesiology, Academic Medical Center, Meibergdreef 9, Amsterdam 1105 AZ, The Netherlands.3Department of Medical Informatics, Academic Medical Center, Meibergdreef 9, Amsterdam 1105 AZ, The Netherlands.4National Intensive Care Evaluation (NICE) foundation, Meibergdreef 9, Amsterdam 1105 AZ, The Netherlands.
Received: 12 August 2015 Accepted: 12 September 2015
References
1. Berdowski J, Berg RA, Tijssen JG, Koster RW. Global incidences of out-of-hospital cardiac arrest and survival rates: systematic review of 67 prospective studies. Resuscitation. 2010;81:1479–87.
2. Chan PS, Nallamothu BK, Krumholz HM, Spertus JA, Li Y, Hammill BG, et al. Long-term outcomes in elderly survivors of in-hospital cardiac arrest. N Engl J Med. 2013;368:1019–26.
3. Sutherasan Y, Vargas M, Brunetti I, Pelosi P. Ventilatory targets after cardiac arrest. Minerva Anestesiol. 2014;81:39–51.
4. Morrison LJ, Deakin CD, Morley PT, Callaway CW, Kerber RE, Kronick SL, et al. Part 8: Advanced life support: 2010 International Consensus on
Cardiopulmonary Resuscitation and Emergency Cardiovascular Care Science with Treatment Recommendations. Circulation. 2010;122:S345–421.
5. Bellomo R, Bailey M, Eastwood GM, Nichol A, Pilcher D, Hart GK, et al. Arterial hyperoxia and in-hospital mortality after resuscitation from cardiac arrest. Crit Care. 2011;15:R90.
6. Janz DR, Hollenbeck RD, Pollock JS, McPherson JA, Rice TW. Hyperoxia is associated with increased mortality in patients treated with mild therapeutic hypothermia after sudden cardiac arrest. Crit Care Med. 2012;40:3135–9.
7. Kilgannon JH, Jones AE, Shapiro NI, Angelos MG, Milcarek B, Hunter K, et al. Association between arterial hyperoxia following resuscitation from cardiac arrest and in-hospital mortality. JAMA. 2010;303:2165–71.
8. Ihle JF, Bernard S, Bailey MJ, Pilcher DV, Smith K, Scheinkestel CD. Hyperoxia in the intensive care unit and outcome after out-of-hospital ventricular fibrillation cardiac arrest. Crit Care Resusc. 2013;15:186–90.
9. Nelskyla A, Parr MJ, Skrifvars MB. Prevalence and factors correlating with hyperoxia exposure following cardiac arrest–an observational single centre study. Scand J Trauma Resusc Emerg Med. 2013;21:35.
10. Vannucci RC, Towfighi J, Heitjan DF, Brucklacher RM. Carbon dioxide protects the perinatal brain from hypoxic-ischemic damage: an experimental study in the immature rat. Pediatrics. 1995;95:868–74. 11. Eastwood GM, Young PJ, Bellomo R. The impact of oxygen and carbon
dioxide management on outcome after cardiac arrest. Curr Opin Crit Care. 2014;20:266–72.
12. Roberts BW, Kilgannon JH, Chansky ME, Trzeciak S. Association between initial prescribed minute ventilation and post-resuscitation partial pressure of arterial carbon dioxide in patients with post-cardiac arrest syndrome. Ann Intensive Care. 2014;4:9.
13. Masterson C, Otulakowski G, Kavanagh BP. Hypercapnia: clinical relevance and mechanisms of action. Curr Opin Crit Care. 2015;21:7–12.
14. Wang CH, Chang WT, Huang CH, Tsai MS, Yu PH, Wang AY, et al. The effect of hyperoxia on survival following adult cardiac arrest: a systematic review and meta-analysis of observational studies. Resuscitation. 2014;85:1142–8. 15. Schneider AG, Eastwood GM, Bellomo R, Bailey M, Lipcsey M, Pilcher D, et
al. Arterial carbon dioxide tension and outcome in patients admitted to the intensive care unit after cardiac arrest. Resuscitation. 2013;84:927–34. 16. Roberts BW, Kilgannon JH, Chansky ME, Mittal N, Wooden J, Trzeciak S.
Association between postresuscitation partial pressure of arterial carbon dioxide and neurological outcome in patients with post-cardiac arrest syndrome. Circulation. 2013;127:2107–13.
17. Del Castillo J, Lopez-Herce J, Matamoros M, Canadas S, Rodriguez-Calvo A, Cechetti C, et al. Hyperoxia, hypocapnia and hypercapnia as outcome factors after cardiac arrest in children. Resuscitation. 2012;83:1456–61. 18. Michenfelder JD, Sundt Jr TM. The effect of Pa CO2 on the metabolism of
ischemic brain in squirrel monkeys. Anesthesiology. 1973;38:445–53. 19. Pastuszko P, Wilson DF. Activation of tyrosine hydroxylase in striatum of
newborn piglets in response to hypocapnic ischemia and recovery. Adv Exp Med Biol. 1997;411:65–73.
20. Safar P, Xiao F, Radovsky A, Tanigawa K, Ebmeyer U, Bircher N, et al. Improved cerebral resuscitation from cardiac arrest in dogs with mild hypothermia plus blood flow promotion. Stroke. 1996;27:105–13. 21. Arts D, de Keizer N, Scheffer GJ, de Jonge E. Quality of data collected for
severity of illness scores in the Dutch National Intensive Care Evaluation (NICE) registry. Intensive Care Med. 2002;28:656–9.
22. Smith PL. Splines as a useful and convenient statistical tool. Am Stat. 1979;33:57–62.
23. Vaahersalo J, Bendel S, Reinikainen M, Kurola J, Tiainen M, Raj R, et al. Arterial blood gas tensions after resuscitation from out-of-hospital cardiac arrest: associations with long-term neurologic outcome. Crit Care Med. 2014;42:1463–70.
24. Elmer J, Scutella M, Pullalarevu R, Wang B, Vaghasia N, Trzeciak S, et al. The association between hyperoxia and patient outcomes after cardiac arrest: analysis of a high-resolution database. Intensive Care Med. 2015;41:49–57. 25. Knol MJ, Egger M, Scott P, Geerlings MI, Vandenbroucke JP. When one
depends on the other: reporting of interaction in case–control and cohort studies. Epidemiology. 2009;20:161–6.
26. Brower RG, Lanken PN, MacIntyre N, Matthay MA, Morris A, Ancukiewicz M, et al. Higher versus lower positive end-expiratory pressures in patients with the acute respiratory distress syndrome. N Engl J Med. 2004;351:327–36. 27. Greenland S. Modeling and variable selection in epidemiologic analysis. Am
J Public Health. 1989;79:340–9.
28. Helmerhorst HJ, Roos-Blom MJ, van Westerloo DJ, de Jonge E. Association between arterial hyperoxia and outcome in subsets of critical illness: a
systematic review, meta-analysis, and meta-regression of cohort studies. Crit Care Med. 2015;43:1508–19.
29. Bak Z, Sjoberg F, Rousseau A, Steinvall I, Janerot-Sjoberg B. Human cardiovascular dose–response to supplemental oxygen. Acta Physiol (Oxf). 2007;191:15–24.
30. Graff B, Szyndler A, Czechowicz K, Kucharska W, Graff G, Boutouyrie P, et al. Relationship between heart rate variability, blood pressure and arterial wall properties during air and oxygen breathing in healthy subjects. Auton Neurosci. 2013;178:60–6.
31. Haque WA, Boehmer J, Clemson BS, Leuenberger UA, Silber DH, Sinoway LI. Hemodynamic effects of supplemental oxygen administration in congestive heart failure. J Am Coll Cardiol. 1996;27:353–7.
32. Ball J, Ranzani OT. Hyperoxia following cardiac arrest. Intensive Care Med. 2015;41:534–6.
33. Pynnonen L, Falkenbach P, Kamarainen A, Lonnrot K, Yli-Hankala A, Tenhunen J. Therapeutic hypothermia after cardiac arrest - cerebral perfusion and metabolism during upper and lower threshold normocapnia. Resuscitation. 2011;82:1174–9.
34. Aufderheide TP, Lurie KG. Death by hyperventilation: a common and life-threatening problem during cardiopulmonary resuscitation. Crit Care Med. 2004;32:S345–51.
35. Buunk G, van der Hoeven JG, Meinders AE. Cerebrovascular reactivity in comatose patients resuscitated from a cardiac arrest. Stroke. 1997;28:1569–73. 36. Ausina A, Baguena M, Nadal M, Manrique S, Ferrer A, Sahuquillo J, et al.
Cerebral hemodynamic changes during sustained hypocapnia in severe head injury: can hyperventilation cause cerebral ischemia? Acta Neurochir Suppl. 1998;71:1–4.
37. Davis DP, Idris AH, Sise MJ, Kennedy F, Eastman AB, Velky T, et al. Early ventilation and outcome in patients with moderate to severe traumatic brain injury. Crit Care Med. 2006;34:1202–8.
38. Curley G, Kavanagh BP, Laffey JG. Hypocapnia and the injured brain: more harm than benefit. Crit Care Med. 2010;38:1348–59.
39. Lee BK, Jeung KW, Lee HY, Lee SJ, Jung YH, Lee WK, et al. Association between mean arterial blood gas tension and outcome in cardiac arrest patients treated with therapeutic hypothermia. Am J Emerg Med. 2014;32:55–60.
40. Kilgannon JH, Jones AE, Parrillo JE, Dellinger RP, Milcarek B, Hunter K, et al. Relationship between supranormal oxygen tension and outcome after resuscitation from cardiac arrest. Circulation. 2011;123:2717–22. 41. Pilcher J, Weatherall M, Shirtcliffe P, Bellomo R, Young P, Beasley R. The
effect of hyperoxia following cardiac arrest - a systematic review and meta-analysis of animal trials. Resuscitation. 2012;83:417–22.
Submit your next manuscript to BioMed Central and take full advantage of:
• Convenient online submission
• Thorough peer review
• No space constraints or color figure charges
• Immediate publication on acceptance
• Inclusion in PubMed, CAS, Scopus and Google Scholar
• Research which is freely available for redistribution
Submit your manuscript at www.biomedcentral.com/submit