Rochester Institute of Technology
RIT Scholar Works
Theses
Thesis/Dissertation Collections
7-12-2006
An Automated algorithm for the identification of
artifacts in mottled and noisy images
Onome Augustine Ugbeme
Follow this and additional works at:
http://scholarworks.rit.edu/theses
This Thesis is brought to you for free and open access by the Thesis/Dissertation Collections at RIT Scholar Works. It has been accepted for inclusion in Theses by an authorized administrator of RIT Scholar Works. For more information, please [email protected].
Recommended Citation
AN AUTOMATED ALGORITHM FOR THE IDENTIFICATION OF
ARTIFACTS IN MOTTLED AND NOISY IMAGES
Approved by:
By
Onome Augustine U gbeme
A Graduate Thesis Submitted
m
Partial Fulfillment
of the
Requirements for the Degree of
MASTER of SCIENCE
m
Electrical Engineering
Professor
Eli Saber
---~--~---~~---Graduate Thesis Advisor
-
Dr. Eli Saber
Professor
---~----~~~~~~S. A. Dianat
Graduate Committee member - Dr. Sohail Dianat
Prof6ssor
_D_a_n_i e_I_P_h_i
I_li~p_s
___
Graduate Committee member
-
Dr. Daniel Phillips
Vincent J. Amuso
Professor ______
---,----~---,----=---_=_=_----:-_=__~:-Electrical Engineering Dept. Head - Dr
.
Vincent Amuso
Department of Electrical Engineering
COLLEGE OF ENGINEERING
ROCHESTER INSTITUTE OF TECHNOLOGY
ROCHESTER
,
NY
THESIS RELEASE PERMISSION FORM
ROCHESTER INSTITUTE OF TECHNOLOGY
COLLEGE OF ENGINEERING
Title: An Automated algorithm for the identification of artifacts in
mottled and noisy images
I, Gnome Augustine U gbeme, hereby grant permission to the
Wallace Memorial Library to reproduce my thesis in whole or part.
Signature:
Date:
Onome Ugbeme
1
/
~o
I
fJ{,
Abstract
Thisthesisproposes an algorithmforautomatically classifying a specific set ofimage
quality
(IQ)
defects onnoisy and mottled printed documents. A roughinitial estimate ofthedefects' locationi.e. defect detection ismanuallyprovidedwith a scanned image.The
approach then proceeds to derive a more accurate segmentation
by
performing severalimage processing routines on the digital image. This reveals regions of interest from
which
discriminatory
features are extracted. A classification offour defects is achievedvia a customized tree classifier which employs a combination ofsize, shape and region
attributes at corresponding nodes to yield appropriate
binary
decisions. Applications ofthis process include automated/assisted diagnosis and repair ofprinters or copiers inthe
field in a
timely
fashion. The proposed algorithm is tested onadatabaseof261 scannedimages provided
by
Xerox Corporation and several synthetic defects yielding a 96.6%classification rate.
Acknowledgements
I extend myutmost gratefulness to Dr. Eli
Saber,
my thesis advisor, for making thisthesis possible, providing valuable advice and supporting myresearch. I would also like
to thank Dr.
Wencheng
Wu of Xerox Corporation from whom I have gained an appreciableknowledge inimagequalityprocedures and guidelines. Special thanks toDr. Daniel Phillips and Dr. Sohail Dianat forbeing
a part ofmy committee and providinghelpful comments and questions that helped improve this thesis. The Center for
Electronic
Imaging
Systems(CEIS),
a NYSTAR-designated Center for AdvancedTechnology,
XeroxCorporation,
and the ElectricalEngineering
Department at theRochester Institute of
Technology
supported this project and created the opportunity toexplore this field.
Finally,
I would like to recognize myfamily
for the unconditionalsupport
they
gave methroughout theyears.Table
of
Contents
List
offigures
2
List
oftables
3
1.
Introduction
4
2.
Background
10
2.1.
Image
Quality
Defects
10
3.
Methodology
15
3.1.
Image
Pre-processing
17
3.2.
Region
ofInterest Identification
and processing....243.3.
Outlier
Processing
26
3.4.
Final Classification
viaMorphological
Reconstruction
28
4.
Experimental
results anddiscussions
32
5. Conclusion
38
List
of
figures
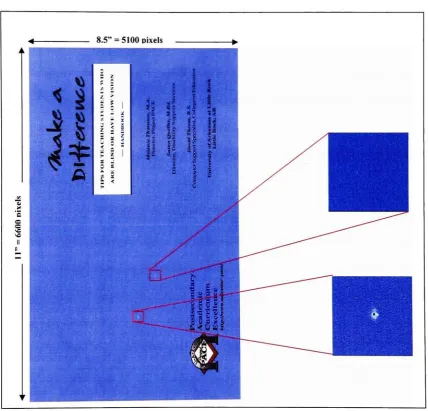
Figure 1.1 Sample scanned printed document
highlighting
manually croppedregions ofinterest 5
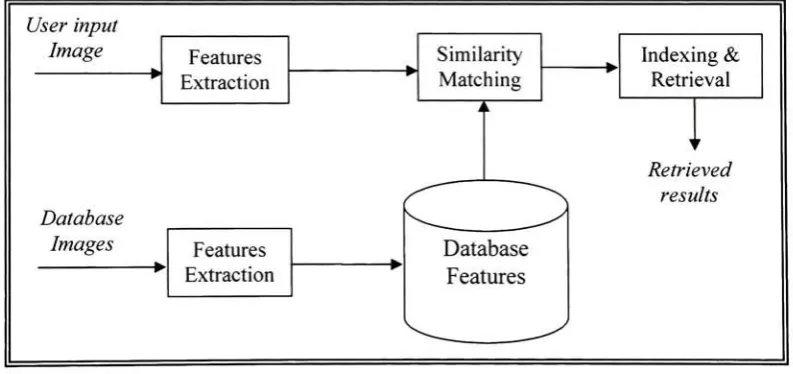
Figure 1.2 Typical Content Based Image Retrieval
(CBIR)
setup 6Figure2.1 Defectsofinterest 13
Figure 2.2
Varying
sizes ofDCDdefect 14Figure 3.1 Defectsegmentationandidentificationframework 16
Figure 3.2
De-screening
process 19Figure3.3 ComparisonofPCswithalternative grayscale method 22
Figure3.4 Local Normalization 23
Figure3.5 Local Normalization block diagram 24
Figure3.6 ROIfeatureextraction 26
Figure 3.7
Study
ofSNR 26Figure3.8
Missing
debrisidentificationprocedure 28Figure 3.9 Withinmask segmentation 29
Figure 3.10 Withinmask segmentation 29
Figure 3.11
Obtaining
thedifference image 30Figure 3.12 Differenceimages 31
Figure4.3 Additionof
increasing
levelsof gaussian noise andresultingList
of
tables
Table 4.1 Classificationresultsusingour proposedmethod 35
Chapter 1
Introduction
Image quality standsamongoneofthemostimportantattributes ofimage acquisition
and printing devices. In the past
decade,
we have seen a tremendous increase in thequality ofprinted documents due to significant technological advances in non-impact
printing. Present
day
print engines are required to meet consistent and stable imagecustomers. The current marketplace demands the best image quality atcompetitive costs
with minimum downtime.
Hence,
theability forprint engine vendorsto reliably achievethe highest level of image quality will ensure them a
leadership
role in the printingindustry.
Figure1.1 Samplescanned printeddocument
highlighting
manuallycropped regions ofinterestcontainingdefects.
However,
even though the quality of printed documents hasimproved
significantly
overthepast
decade,
current printengines still produce avarietyofimage qualitydefects [image:10.535.56.485.152.563.2]and artifacts (see Figure 1.1). These artifacts are manifested in a variety of ways and
occur in different
locations
on the printed document. Operator and/or engineerintervention isoften requiredtoperform corrective actionstoeliminate orreducetheirre
occurrences. In some cases, new defects never encountered before are diagnosed and
resolved in a
timely
manner. Thisdependency
on a trained operator that is capable ofidentifying
artifacts and performing the appropriate corrective action as quickly aspossibletends to hinderthe efficient flow ofbusiness inprint shops for instance.
Hence,
theneedforonline algorithms capable ofautomatically
identifying
artifacts andoutliningcorresponding corrective measures is continuously growing. This will provide end-users
with the ability to
independently
make a diagnosis of printers or copiers in atimely
fashion.
One approach to
tackling
this problem isby
utilizing Content Based InformationRetrieval
(CBIR)
techniques. In an effort to subdue manual annotations oflarge imagedatabases,
research interests in this area have abounded since the early 1990s.1'2CBIRemploys visual properties of a query image
-color, shape, texture,
frequency,
andregions ofinterest
(ROI)
-to traverse image databases accordingto user's interests (see
Figure 1.2). This is achieved
by
utilizinghighly
descriptive multidimensional featurevectors which can beextracted from global orlocal positionswithinthe imageusing one
or more oftheabove visual content properties. Someapplications requirefeaturesthatare
minimally sensitive to changes
-affine, reflections, perspective,
deformations,
orluminance3
- inthe image. For
instance,
shapefeatures can be represented with momentinvariants,4
Fourierdescriptors,5or
chain-codes.6
Similarity
measuresbetweenthefeaturecomputed. Often useddistance metrics include Euclidean,6'7 Minkowski,8 Mahalanobis8
and Kullback-Leibler
(KL)
divergence.10The decisionof a"matched" image is achieved
by
searching through the similarity values. This can be performed using an exhaustiveapproach or more efficiently via
indexing
schemes. Popularindexing
schemes includeR* quad-trees,12
or
Self-Organizing
Maps (SOMs).13' 14Thus,
an automaticdefect identification system canbe devisedtocompareadefective samplewithimagesin
an already existing online database from which
top
matches can be selected.Additionally,
the system can be designed todynamically
perform updates when newdefectsare encountered.
[image:12.535.71.468.339.526.2]Userinput Image Features Extraction
Similarity
Matching
KIndexing
& Retrieval ? Database Images i k Retrieved results Features Extraction Database ? FeaturesFigure 1.2 Typical Content Based Image Retrieval
(CBIR)
setup.Some systems counteract the defect recognition problem via a series of image
processing and pattern classification steps. Iivarinen and Visa14
employed unsupervised
SOMs forthe classification ofbase paper surface defects such asholes and spots. Their
classificationisbasedonfeaturesextractedfromtheinternal structure, shape, andtexture
-7-traits ofthedefective areas. Segmentationand morphological operations are amongstthe
pre-processing steps
they
carried out prior to feature extraction and classification.Additionally,
welddefect detectionhas beenaccomplishedby
Li and Liao15viaGaussian
distribution fittings ofhorizontal line profilesfrom thedefect images.
They
also employbackgroundremoval, dark imageenhancementandimagenormalizationbeforeproperties
oftheprofiles are exploited as features.
Mery
andBerti16
used texturalfeatures from co
occurrence matrices and 2-D Gaborfunctions. Prior to the feature extraction stage,
they
explore Laplacian of Gaussian edge detection to segment "key"
defective areas. More
recently, Ng17
proposed a novel histogram-based
thresholding
scheme to assist in thesegmentation of"smallsized"
sheet metaldefects. The successfulness ofthisapproachis
however limited to high contrast images containing a defect. In general, the algorithms
described above are designed to handle defects that possess a high level contrast to the
surrounding background.
Furthermore,
the algorithms cannot be successfully applied tothe recognition of all printed documents defects which sometimes have a subtle
appearance.
This thesis describes a method to
identify
artifacts resident on scanned copies ofprinted documents. These artifacts tend to have large intra class variations, possess low
contrastor exhibitilluminationvariations. It is assumedthat the defect localizationstage
i.e. arough enclosure ofdefectiveareas, has already beenperformed apriori
by
ahumanoperator. Thus the proposed method is responsible for accurately segmentingthe defect
andprovidingalabel
by
classifyingdiscriminatory
features extractedfromthe segmentedregions. To achieve this, the algorithm employs various image processing steps such as
amongst samples of the same class and facilitate subsequent shape, size and region
featureanalysis. Theeffectiveness ofthealgorithmis demonstratedon a sampledatabase
of scanned electrophotographic and synthetic images. These images possess significant
variations within each classto
thoroughly
test the sensitivityofthe methodto intra-classdifferences.
Additionally,
this approach differentiates between mottle and deletionimagesandfurther identifiesthesub-classes withinthe deletioncategory.
The rest ofthisreportisorganized asfollows: Chaptertwo provides abriefoverview
and discussion of the nature of the defects at hand. Chapter three describes the
methodology oftheapproach which includesthe image pre-processing steps carriedout,
the procedures usedto extracttheRegions ofInterest
(ROIs),
thereasoning behind classdecisions making and a validation ofchosen features. In chapter
four,
a comparisonbetweentheproposed grayscale formulationvia principal components and an alternative
grayscale approach is given. This section also discusses the final classification results.
Chapter 2
Background
2.1. Image
Quality
Defects
Printer image quality defects are undesirable qualities of an electrophotographic copy
produced
by
aprinter or copier. Even though these print engines have beenthoroughly
tested
during
the manufacturing process, theoccurrenceofdefectsremainsinevitable dueto the volume and
diversity
of printed material. Thus a number of standards haveemerged to define objective evaluation methods for print quality. The ISO-1366019
standardisawidelyaccepted standard fortheobjective characterization ofimage quality
-10-as it pertains to office equipment. It categorizes these qualities as either: character and
line attributes or large area attributes. Character and line defects include raggedness,
blurriness,
characterdarkness,
line width, contrast,fill,
and extraneous marks. Whilelarge areadefects referto graininess, mottle, and voidto name afew. More recently, the
ISO-19751 image
quality standards foroffice equipmenthas established task teams to
perform research workona more expansive categoryofdefectsnamely:
1)
Textandline (e.g. sharpor smoothedges andpropertext color),2) Macro-Uniformity
(e.g. streaks,bands,
and mottle defects existing on a scale greaterthan25mm2Field Of View
(FOV)),
3)
Micro-Uniformity
(e.g. streaks,band,
mottle, and graininess defects usuallyrestrictedtoa25mm maximum
FOV),
4)
GlossUniformity
(e.g. differentialgloss and glossartifacts),5)
Color Rendition (e.g. colorfidelity
andcontinuity),and6)
Effective Resolution.This thesis addresses a group ofdefects that can be characterized under the
Macro-Uniformity
attributes.The defects ofinterest includedeletions,
Debris Centered Deletion(DCD),
debris missingDCD,
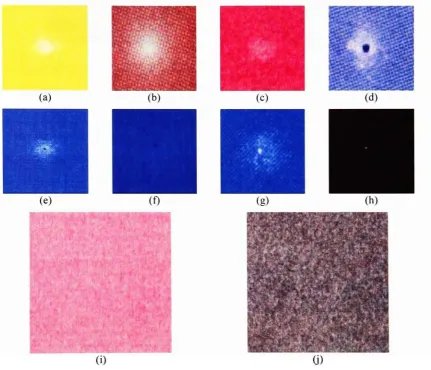
and mottle. Deletions (Figures. 2.1a-2.1c)
are usuallymanifested as elliptical regions containing a localized group of pixels lighter than the
uniform background and are in general aresult ofafault in thecharging process. DCDs
(Figures. 2.1d
-2.
If),
onthe otherhand,
resemble adeletionwithan added presence of acentralized collection oflocalized dark pixels (called a debris). The DCD appears as a
smalldarkspoton adeletion background. Aspecial case ofDCDsexists wherethedebris
is missing due to accidental "rub off
by
the electrophotographic process revealing thepaper color(see Figures.
2.1g
and 2.1h). Thisyields abnormally brightgray-levelvaluescompared to its immediate neighboring pixels. Mottledefects (Figures. 2.1i
-2.1j)
referto non-uniformity in the perceived print
density
(i.e. reflectance) and can be gaugedby
the relationship between light and dark regions. The ISO-13660 standard 18' 19 defines
mottle as non-uniformity occurring on a spatial scale between 1.27mm and 12.7mm. It
characterizes it as large area print quality attributes possessing aperiodic fluctuations of
density
at a spatialfrequency
less than 0.4 cycles per millimeter in all directions. Eventhoughmottle hasreceived quiteabitof attentioninthe
industry,
aquantifiable universalmeasure has yet to be developed. The best achieved benchmark so far has been
introduced in the ISO-19751 image quality standards for systems.20
Other defects e.g.
streaks and bands are certainly of significant interest but are not handled in this paper
since their shape properties differ greatly from the elliptical shapes identified
by
theproposed method.
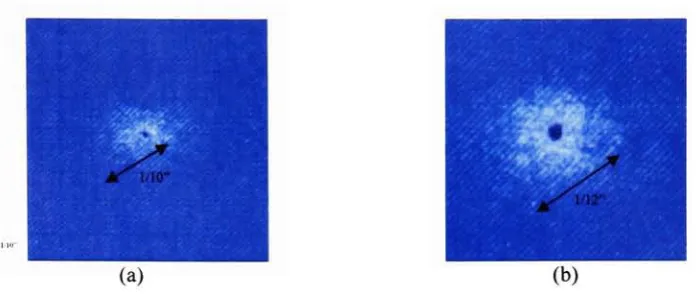
The axial lengths ofthe deletion and (debrismissing) DCD vary fromabout
1/32"
to
over
1/10"
(see Figure 2.2 for example) and can occur on different locations of the
printed document (see Figure 1.1).
Thus,
any proposed recognition scheme should benominally invariant to the sizes and locations ofthe defects.
However,
it should also beable to employthe size ofthedefectas anindicationofthe defect severity.
Furthermore,
the proposed algorithm should have the abilityto process different sized digital images
(i.e. cropped areas greaterthan
25mm2
for Macro-Uniformity).
The aforementioned assumptions about characteristics of the defect i.e. elliptical
distribution,
localized spatial arrangement ofthedeletions,
non-uniformity ofthe mottle,andcentralizeddebris presence ofthe DCD (or missing
DCD)
aretaken advantage ofinthe generation of
descriptive
features used in the classifier. The successfulness ofthisthesis will
help
in quantifying an objective approachtowards evaluating printing device [image:18.535.56.488.129.499.2]defects.
Figure 2.1 Defectsofinterest:
(a)-(c)
Deletion,(d)-(f)
Debris Centered Deletion(DCD), (g)-(h)
Debris-missing DCD,
and(i)-(j)
Mottle.-13-(a)
(b)
Figure 2.2
Varying
sizes ofDCDdefect:(a)
Majoraxiallength~ 1/10"and
(b)
Majoraxiallength- 1/12".
14-Chapter 3
Methodology
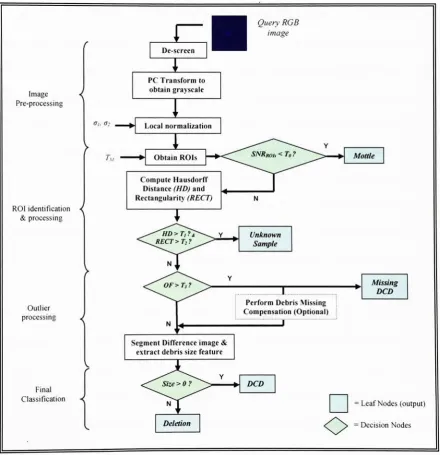
The proposed method is summarizedin Figure 3.1. It comprises offourmajor steps:
1)
pre-processing,2)
ROI identificationandprocessing,3)
outlierdiscovery,
and4)
finalclassification. The input to the algorithm is a scanned color sample (i.e. digital
image)
containing the defect. The
flowchart,
shown in Figure3.1,
represents a classificationapproach based on the expected statistics ofthe regions of interest in the images. It
depicts five leafnodes andfour decision nodes thatare used torepresentthe classes and
-15-decisions respectively. Each of the decision nodes employs size or shape features to
classify the defect
by
utilizing empirically selected thresholds. These thresholds areobtained
by
selecting random samples to constitute thetraining
data,
after which thefeature of interest is extracted from the image. A threshold that separates the
binary
classes atthedecisionnodesisthenchosen.Describednext arethepre-processingsteps.
1' De-screen
'
QueryRGB image Image < Pre-processingPC Transformto
obtain grayscale
Localnormalization
Tu
I
Obtain ROIsROIidentification < &processing
Compute Hausdorff Distance(HD)and Reetangularity (RECT)
Unknown Sample
Outlier
processing
Perform DebrisMissing Compensation(Optional)
Segment Difference image &
extractdebrissizefeature
Final Classification -<^ DCD Mottle Missing DCD Deletion
|
=Leaf Nodes(output)
[image:21.535.48.489.186.641.2]=Decision Nodes
Figure 3.1 Defectsegmentationandidentification framework.
16-3.1.
Image
Pre-processing
3.1.1.
De-screening
Locating
regions ofinterests involvesapplying a segmentation routineto separatetheimage into
foreground
andbackground areas.The foregroundregion consists ofpixels indefect areas which can be identified using a
binary
threshold value.However,
directthresholding
of the images without pre-processing generally leads to inaccurate ROIselections. Scanned imagestend to containhalftone screens (or marking screens)usedto
produce the image on the substrate
during
the electrophotographic,ink-jet,
orlithographic marking process. : Researchers have developed
de-screening
procedurestocounteract this problem. Dunn and
Mathew22
treated the halftone screens as texture
capable of
being
extracted using a single circularly-symmetric filter. Sharma etal?1
developed a process responsible for
determining
theidentity
ofthe underlying markingprocess
by
analyzingthepowerspectra of adigital image forthepresenceofhigh energyat high frequencies.
They
utilize this information for scanner or copier recalibrations inorderto produce adocument ofhigh
fidelity
withminimal screens. The samefrequency
domain
de-screening
approach is adopted here to minimize the effect ofthe screens onthe classification process. In particular, the power spectrum ofthe image is analyzed to
determine the existence ofhigh energy content (at high
frequencies)
that represents thesignature ofthe underlyinghalftonescreens. The screens arethenreduced via a repetitive
"notch"
frequency-domain
filtering
operation to yield a sufficiently smooth image forfurther analysis. This process is performed
individually
on each channel. A Butterworthnotch
filter5
of ordern= 15
givenby:
17-F = notch
1+
D
Dx(u,v)D2(u,v)
where:
Do
=Radius of
filter,
Dl(u,v)
=^(u-M/2-uJ
+(v-N/2-vJ
,(1)
D2(u,v)
=^(u-M/2
+u0f +(v-N/2 +v0f ,
M =Number ofcolumnsin image ,
N=Number ofrowsin image
.
is utilized. The variables u and v are the
frequency
domain coordinates. The origin ofFnotchhas beenshiftedto the center
frequency
coordinatesi.e.Folch(0,
0)
is locatedatu=
M/2andv=N/2.
Thus,
thenotchlocationsaresymmetrically locatedat(uq,
vo) and(-uq,
-vo). The order ischosenas n = 15in orderto preserve the contrast ofdebris pixelsintheDCDanddebris missingsamples.
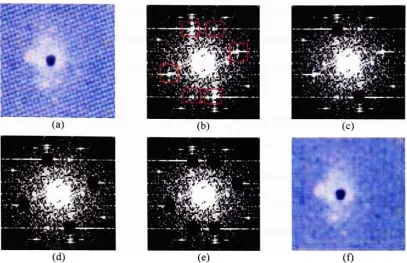
An illustration of this application on a DCD image is shown in Figure 3.2. The
frequency
spectrum(Figure3.2b)
shows significant power(outlinedby
theboxes)
athighfrequencies that correspond to the sinusoidal halftone screens. The black spots (Figures
3.2c
-3.2e)
are indications of successivefrequency
domainfiltering
operations.The finalde-screened image in Figure 3.2f is thus obtained fromthe inverse Fouriertransform of
thefilteredversionsofallthreechannels.
-18-Figure3.2
De-screening
process:(a)
Originalscanneddocument, (b) Frequency
spectrumofredchannelshowingpresence of abnormalhigh energyathigh
frequencies, (c)-(e)
Successivenotchfiltering, (f)
De-screenedversion ofFigure3.2a.3.1.2. Grayscale ConversionviaPrincipalComponent Analysis
Special instances arise where the "debris" is only visible in one channel.
Hence,
achannel
by
channel,i.e. 3-dimensional processing oftheimage isnotdesirable dueto theadded computational complexity and potential for inaccurate results.
Therefore,
theimage is transformed to a single grayscale channel. There are numerous RGB to
grayscale methods used in the computer vision literature. Some simply employ the
averageoftheRGB channelsas acorrespondinggrayscaleimage. Thisapproachdoes not
usuallyretainthesubtledetailssince theresultantgrayscaleisnotperceptuallyequivalent
to thebrightnessoftheoriginalcolorimage. A betterapproximation ofthebrightnesscan
be derived
by
summingweighted versions oftheR,
G,
andB channels. Othermethodshandle the problem via
de-saturation24
i.e. removal ofthe saturation information ofthe
image. In particular, MATLAB's grayscale conversion
(rgb2gray)25
computes a
[image:24.535.63.471.48.311.2]grayscale image
by
eliminating the hue and saturation components while retaining theluminance. Forour
dataset,
these conventional methods often failtopreservethecontrastofthe centered debris with respect to the deletion background.
Rather,
they
tend to besuccessful when applied to normal images e.g. portraits, landscape scenes, and road
scenesthathavean appreciable contrast and exhibitamultimodal histogramproperty. To
avoid this
limitation,
a principal component(PC)
analysis is performed on the RGBimage in orderto convert itto a single channelin an optimumfashion. Figure 3.3 shows
comparisons of the rgb2gray method with grayscale images obtained from the PC
transformation. This DCDimage (Figure
3.3a)
bears"questionable"debris which is only
visible in the blue channel (Figure 3.3d). The blue channel can thus be selected via
contrast selection schemesor
by
utilizingadditive/subtractivecolortheories5.Principal component
analysis26
is a linear data reduction approach that optimally
projects a^-dimensionaldataontoalower-dimensional subspaceina mean-squared error
sense. It does this
by
performing a coordinate rotation that aligns the transformedaxeswith the directions of maximum variance ofthe data. Let
^F,,^,
and3
represent theR,
G and B channels in lexicographic ordering and =[*?,
^ 3
]
T be thecorresponding 3 x MNconcatenation. The mean vector m=
[w,
m2m3]T
and covariance
matrixCarecomputedas follows:
I MN
^Tbl^W' *=l>2,and3.
(2)
C= o-%(jy CT T
arvaVj
_2 o\j,3ovov ov 0%0">i'
(3)
where:
r -I i MN
. c72t=4K-^)2j=^i-j;(^(/)-^)2,and
avaVt
=E^J-mX^k-mj]^1^^J(l)-mJX^k(l)-mk).C isareal,symmetric matrixwhichcanbeexpressed as:
C= UAUT
(4)
where U is a 3 x 3 orthonormal matrix ofeigenvectors corresponding to the ordered
eigenvalues
Xi
>fa
>fa
contained in the diagonal matrix A =diagfl/,
fa,
fa). TheprincipalcomponentsofTarethencalculatedby:
Y=UTx= [YlY2Y3]T
(5)
Hence,
the variance ofthe original information is distributed amongst the eigenvalues,with the 1st eigenvalue
(fa)
producing aPC(Yi)
that accounts fora given percentage ofthe totalvariance oftheRGB data.
Therefore,
a75%testisenforcedonthe 1steigenvalueas ameasure oftheconfidence ofthePCtransformation.The
R, G,
orBchannelthathasthe highest variance is chosen as the grayscale image if this criterion fails. Sample
reordered versions of
Yu Y2,
andY3
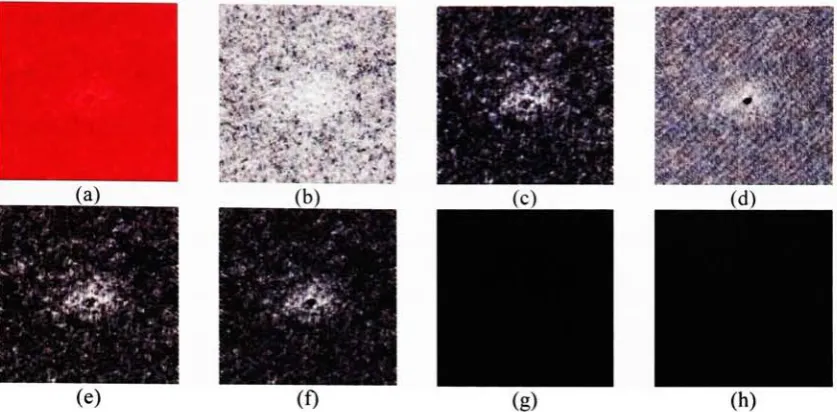
are shownin Figures3.3f-3.3h.#
Figure3.3 ComparisonofPCswith alternative grayscale method:
(a)
Original DCDimagewith"invisible"
debris,
(b)-(d)
correspondingR, G,
andBchannelsrespectively,(e)
MATLAB rgb2grayprocedure,(f)
1stPC, (g)
2ndPCand(h)
3rdPC.3.1.3. LocalNormalization
Once a high contrast grayscaleimage has been obtained, a local normalization
(LN)
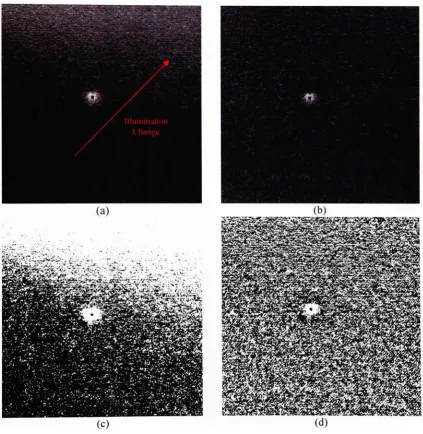
procedure is employed to compensate for non-uniform background situations. The LN
process is designed to handle large illumination variations (see Figures 3.4a and
3.4c)
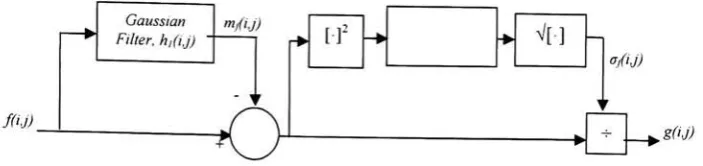
characteristic of anumberofsamplesinthedatabase. This approachis givenby:
f(i,j)-mf(i,j)
g(!,j)=
-vf(Uj)
(6)
where:
f(i,j)
istheselected/transformedimage(grayscale).m/ij) isanestimationofthelocal meanof
f(i,j)
a/i,j) isanestimationofthelocal standarddeviation
g(i,j)istheoutputimage
The above outlined approach efficiently removes variations in the image (see Figure
3.4b). The block diagram in Figure 3.5 depictsthe implementation ofthe LNprocedure.
[image:27.535.71.490.49.255.2]An estimation ofthe image's local mean is obtained
by
filtering
with a 70 x 70 spatialGaussian lowpass
filter,
hrfij)
of standarddeviation,
o\= 21. This Gaussian mask also
ensuresthatanycandidate pixel is assigned ahigherweightwhileutilizingthecorrection
routine. The []2
and
V[]
symbols (see Figure3.5)
represents"square"and "squareroot"
operations respectively and are used to complete the computation of the standard
deviation. Thesecondsmoothing
filter,
h2(i,j)
is equivalenttoh,(i,j).^g*5BwPfcii'!i 5/
TraSSe
Figure 3.4 LocalNormalization:
(a)
Non-uniformbackgroundsample,(b)
Localnormalizedversion ofFigure
3.4a,
(c)
Binarizedresult ofFigure 3.4aand(d)
Binarizedresult ofFigure3.4b. [image:28.535.59.483.210.644.2]JfiJ)
Gaussian Filter,hi(ij)
m/U)
[f
V[]
-.o/ij)
[image:29.535.100.452.83.166.2]gfij)
Figure 3.5LocalNormalization block diagram.
3.2. Region
of
Interest
Identification
andProcessing
3.2.1.
Binary
thresholding
The normalized
image,
gfij) is further processedby
utilizing a median basedthresholding
approach toidentify
the ROIs. Otherthresholding
schemes tend toimmediately
separate the debris without providing any deletion boundary. The medianthreshold was thus observed to be more robust to noise and outliers within the image
when compared to a mean-based thresholding. Ifthe median is given
by
TM
, then thebinary
imageb(ij)
iscomputed as:b(i,j)
=I
ifg(i,J)>TM
0,
ifg(i,j)<TM'
(7)
The images inFigures 3.4cand3.4dwere obtained
by
utilizingEquation9.3.2.2. Morphological
filtering
(non-Mottle vs.Mottle-type)
An opening morphology operation27
is then employed to remove noisy objects from
the
binary
image,
b(ij). Figure 3.6 depicts a comparison of typicalmorphologically
openedimages obtained from a
deletion, DCD,
and mottleimages,
respectively. Noticethe different dimensions ofeach image. Therelationship
between
thelargest
region andits neighbors is employed as a
discriminatory
feature since ittends to beinvariant
to thedefectsize.
Specifically,
theratio oftherootmean square(RMS)
ofthearea ofthelargestobject (i.e. thelargest defect region) to theRMS ofthe area of other objects is employed
as the feature ofinterest. This is equivalenttocomputing the signal-to-noise ratio
(SNR)
ofthe ROI. This
feature
isthereaftercomparedtoanempiricallydeterminedthresholdT0
to yield class
decisions
(atthe first decision node) between mottle and deletion-type (ornon-mottle) images. Figure 3.7 shows typical distributions ofthe number ofpixels in
each regionfora mottle and non-mottletype. Ifthesignal ofinterest is given
by
the(areaof
the)
major ROI then a large SNR is expected for the non-mottle image while a lowSNRistypicalofa mottleimage.
In order to ensure that only defects
bearing
a deletion-type signature are consideredfor further processing, we impose a shape contour test
by
utilizing the Hausdorffdistance. In particular, the contour ofthe major ROI is compared to a fitted ellipse's
contour which is created using a similar approach to that found in29.
Additionally,
therectangularity ofthemajor ROI measured
by
theratio ofthe area ofthe regionto thearea ofits minimum
bounding
rectangle(MBR)
is employed as another feature. Thesetwofeatures i.e. Hausdorff distanceandrectangularity, ensurethatonly defects exhibiting
an elliptical shape configuration (or are non-rectangular) are regarded for further
processing.
They
are compared with thresholdsTt
andT2
to separate unknown defectsfrom deletion-typesamples. Thiscompletesthe seconddecisionnode.
350pixels
0>
[image:31.535.64.468.44.301.2](e)
(f)
Figure 3.6 ROIfeatureextractionfor:
(a)-(c) Deletion,
DCDandMottleimages,
(d)-(f)Respective morphologicallyopenedimages.
300 400
Reaions
(a)
Figure 3.7
Study
ofSNRof:(a)
Typicalmottledimageand(b)
Typicalnon-mottletype.3.3. Outlier
Processing
Thefirststeptowardsprocessing only deletion-typeimagesutilizestheconvexhullof
the major ROI as a mask (Figure
3.8a)
for the replacement ofpotential missing debrispixels. To obtain these pixels, athreshold is automatically computed and applied to the
masked region. Let p represent a given gray level. This threshold is obtained
by
first [image:31.535.55.488.347.503.2]generating the histogram
h(p)
forpmi<p
<pmax
as shown in Figure 3.8b. Thenthe setcontainingpossiblebrightoutlier pixelswithinthemaskis definedby:
Kl={p:h(p)>0
and p> 0.75-{pmax-Pmm
)}
(8)
where the constraint /?>0.75
(pmax
-p^) is designed to limit the desired threshold to
only bright pixel values. Define a new set
51
whose elements are the backward
differences betweenadjacent elements of911. Thedesiredthresholdcanbeobtained as:
Outlier Threshold- min(9*
}
where 6 = 5
for the given dataset. To avoid conflicts, i.e. two (or more) bright outlier
regions revealed
by
thethreshold,
the largest region is simply chosen. Then anempirically determined value
T3
is compared with the difference ofthe outlier and theneighboring regionsas:
median\0G
}
-median\Np
}
>T3
(10)
where
Og
=Potential Outlier group and,
Np
= Neighborhoodpixels contained in a
bounding
box aroundOg
(Figure 3.8d). This helps to quantify the outlier measure oftheregion in question to determine if it is significantly different from its neighbors. Figure
3.8 shows a successful identification ofthe missing pixels where the
0G
region (Figure3.8c &
3.8d)
has beenobtainedviathresholding
withthe desired outlierthreshold value.The
Np
region(Figure3.8d)
is createdfrom a 1-pixelboundary
around Oc. Since theOg
region satisfies the constraint posed in Equation
12,
the bright pixels within that regioncanbereplaced withadarkpixel value(i.e. 0).
-27-Create
masked region
histogram
-.**.***,F.<i
^_ii
(a)
64
61
84
79
59
61
Np- -"
"
61
69 110 128
89
64
51 120
143 161
120
74
J4--Kt
la
145 102
74
Sameas
69
691
87 115
77
61
84
56
74
71
59
69
Create I-pixel
boundaryaround mask
(d) (c)
Figure3.8
Missing
debris identificationprocedure.3.3. Final
classification viaMorphological
Reconstruction
To efficiently differentiate between deletionandDCD
defects,
themajordifference isexploited - the
presence of a group of dark pixels in an approximate center of the
elliptical region. This is a difficult task as demonstrated in 32 wherein information from
thehistogramwas utilizedto deviseathresholdthatlocalizespossible debrispixels. Due
to the noisy nature of deletion samples, additional steps
involving
the acceptance orrejection of segmenteddarkpixels are needed. Forthelow contrastDCD images (Figure
2.1e),
thedebrispixelsare notsuccessfullyidentifiedafterthresholding. Figure3.9showsintermediate results obtained
by
applying differentthresholding
mechanisms to pixelswithinthecreated mask (Figure
3.9b)
foraDCD sample. Thebestresult (Figure3.9e)
is [image:33.535.52.490.72.385.2]28-achieved
by
a hole emphasizing routine which utilizes morphological reconstruction tofill "holes"
in the image and thereafter compute a difference image. Otsu's
method31
(Figure
3.9c)
doesnot provide adesirableoutcome whilethemodifiedOtsu'sapproach17'(Figure
3.9d)
is close to the ground truth result but is noisier compared to themorphological reconstruction approach. Figure 3.10 illustrates a similar situation with a
deletion image.
The fill-hole process is a special morphological
transformation30
(called a geodesic
transformation)
which accepts two images-a m-arker -and -amask. The mask is used to
restrict the growth (or
decay)
of the marker imageduring
regular morphological [image:34.535.55.489.317.590.2]operations.
Figure 3.9 Withinmask segmentation:
(a)
Originalimage, (b)
maskedimage, (c)
Otsu'sthresholding,
(d)
Modified Otsu'sthresholding16,24and
(e)
Morphologicalreconstruction approach.Figure 3.10Withinmask segmentation:
(a)
Originalimage, (b)
maskedimage, (c)
Otsu'sthresholding,
(d)
ModifiedOtsu'sthresholding1624
and
(e)
Morphologicalreconstruction approach.For this process, the marker is set to the maximum value ofthe image except along its
borderwhere thevalues oftheoriginal image are
kept,
while themaskis representedby
the image itself. An erosion ofthe marker is then
iteratively
performed until a stable [image:34.535.53.491.463.550.2]-29-result is achieved. Thefinal eroded marker constitutesthefilledimage andthe holes can
be obtained
by
subtracting the input image from its filled version (see 27 for a detailedexplanation). A sample ofthisobtaineddifference image is shownin Figure
3.11;
noticehow the previously unperceivable debris becomes
highly
prominent in the differenceimage.
Image fill
C>
Obtainoutlier
group &
measureSNR
?
[image:35.535.62.472.212.327.2]Difference image
Figure 3.11
Obtaining
thedifferenceimageFigure 3.12ashows aperspective version ofthedifferenceimage in Figure 3.11. The
grayscale SNR ofthe major peak regionin the difference image is used to quantify the
disparity
between DCD anddeletionsamples. Ifthepeak regions (brightoutliers) denotethe debris of
interest,
then the DCD are expected to possess a higher SNR level whencompared to the deletion. A low SNR is an indication that no further processing is
requiredandthereforeno prominent outliers exists.
30-Generate 1 difference image
Peakregion
1
or
^
i Ljt.CO)
906
L
V''am ^juJU, BSB Bua4 0
.^j
|^^
<l<*"""*-^_ ^^^^^^ BO SO *""---.._^ *
[image:36.535.62.498.62.341.2]S H Generate difference image Peakregion
(a)
(b)
Figure 3.12 Difference images:
(a)
DCD (From Figure3.11),
SNR=22dBand
(b)
Deletion, lOdB.Thenumber ofpixels representingthe debris isutilized asthe
discriminating
featurebetween deletion and DCD samples. As an added vote ofconfidence, the Mahalanobis
distance8
in a normalized range
[0,
100]
ofthe segmented debris fromthe center ofthemask (i.e. convex hull of major ROI as in Figure
3.8a)
is employed as a vote ofclassification confidence ofthe DCD. We expect true DCD samples to thus have a low
mahalanobisvalue,while thedeletionsamples possessavote of confidenceequivalentto
a normalized version ofthe SNR ofthe difference image. The normalizing constant in
thiscaseisobtainedfrom a set of
training
data.Chapter 4
Experimental
Results
and
discussions
Theperformance oftheproposed algorithmistestedon adatabase of273 imagesthat
consists of:
1)
261 scanned images ofRGB format providedby
Xerox Corporation withaccompanying ground truth
labels,
and2)
12 Non-defect and synthetic images (Figure4.1)
comprising oflogos,
and"rectangular"
shape defects. The scanned images were
comprised of88
DCDs,
80deletions,
and 93 mottleimages (see Table 4.1). Thesyntheticimages were introduced to test the algorithm's robustness and ensure only regions
-32-satisfying the "elliptical" ROI property are processed as deletion-type defects. The
images
are scanned with anEPSONGT 30000 flatbedscanner at ascanningresolutionof600 dots per inch
(dpi)
in accordance with the ISO-13660 standards. No spatial imageprocessing is applied onthe image
(during
scanning) so asto determine how muchpreprocessing the algorithm would be responsible for. MATLAB33 was chosen as the
classification prototyping environment due its ability to easily perform computations
involving
matrices. It however has a speed disadvantage due to its inherent nature tointerpretprograms. Asmentioned
before,
thedefect is manually localizedand croppedby
a human operator thus resulting in digital images ofvarying dimensions greater than
25mm2. Outofthe88 DCD
images,
20 had missing beadswhere some couldpossibly beclassified as deletionsinsteadofDCDs
by
ahumanobserver.TEXACO
"(a)"
[image:38.535.57.474.348.461.2](b)
(c)
(d)
Figure 4.1 Syntheticsamples:
(a)
DCD,(b)
Deletionand(c)-(d)
Logos.Table 4.1 illustrates asummary ofthe
algorithms' performance. The classification of
the DCD class yields a 93.2% accuracy. The mis-classified samples are a result oflow
contrast (Figure
4.2a)
images where the bead was not visible. Giventhe lackof contrastand the absence ofthe bead (Figure
4.2b),
it isentirely possible that the originals couldhave beenclassifiedasDCDsordeletions
by
an operator and/orservice engineer.Figure 4.2 Misclassifiedsamples:
(a)
DCDwithlowcontrast,(b)
DCDwith a nonvisiblebead,
(c)-(d)
Deletionswith possibledebris missingregions.Deletion classification yields 96.3% accuracy. Mis-classified samples appear to
possess a potential missing debris group ofpixels (Figure 4.2c
-4.2d)
andthereby
areclassified asDCDs
by
our proposed algorithm. Once again, this misclassificationcanbeattributedtoapotential confusionfromthegroundtruthinformation.
Theresultsforthe remainingcategoriesare also showninTable
4.1,
wherethemottleand arbitrary images were classified with a 99% and 100% accuracy respectively. The
-34-total correct classification rate is 96.6% whichis obtained from an average ofthe given
individualaccuracies.
The effectiveness ofthe PC transform forgrayscale conversion is also demonstrated.
Table 4.2 shows the resultant classification obtained from using MATLAB's rgb2gray
method. It can be seen from Table 4.2 that the MATLAB rgb2gray functions results in
lowerclassificationaccuracy especiallyforthecaseofDCDs.
CLASSIFICATION RESULTS Number
DCD/D bri
True Class of
* '
Deletion Mottle Unknown
Accuracy
missing J
images
DCD/Debris missing 88 82 5 1 93.2%
Deletion 80 2 78 97.6%
Mottle 93 1 92 99%
Other 12 12 100%
Table 4.1 Classificationresultsusingour proposed method.
CLASSIFICATION RESULTS
Debris missing 88 64 20
Deletion 80 3 77
Mottle 93
Other 12
_, . Numberof DCD/Debris ~ . A.
,, ^, TT . .
True Class . . . Deletion Mottle Unknown
Accuracy
images missing _ 4 72.7% 96.25% 93 100% 12 100%
Table 4.2Classificationresultsusing MATLAB rgb2grayapproach.
The robustness ofthe algorithm against varying degrees ofrandom Gaussian noise
was tested.
First,
the noise present in the normal images was quantifiedby
selectingrandom samples and extracting arbitrarysized cropped regions fromvarious locations in
the image. Wefoundthe imagestohave anintrinsic noiselevelwith standarddeviationa
~ 0.
04,
thus anyadditional noisetendsto further depletethecontrast.Repeated testswithwhite Gaussiannoise (a=
0.01, 0.02,
and0.05)
are summarizedin Figure 4.3 fromwhich35-it canbe easilyseenthat the classificationaccuracy is
inversely
proportional to the levelof noise added. This is dueto a significant
drop
incontrast withadditional noise. Mottleidentification
tends toholdupwell againstthenoisedueto thealready noisynatureofthemottle
images;
misclassifiedmottle imagesapproach adeletion image. Themisclassified
deletion
images
are classifiedas Mottleand tend toworsen withincreasing
noise. As thelevelof noise is
increased
from a =0.01, 0.02,
and0.05,
the total classification(averageof all the classifications) is reduced from
91.3%, 86%,
and 73.4%. Since a flatbedscanner does not
typically
corrupt the digital image with noise, this does not representamajorlimitationofthealgorithm.
100
90
80
70
60
50
40
30
20
- Mottle
- DCD Deletion
0.01 0.02 0.03 0.04 0.05
[image:41.535.60.482.293.477.2]GaussianNoiseStandardDeviation, o
Figure 4.3 Additionof
increasing
levelsofgaussiannoiseandresultingperformance.The algorithm isresponsible for
locating
and classifying one majordefectper digitalsample. The total processingtime takenfora sample of size 118 * 118 is approximately
2.5s for a deletion-type image and approximately 2s for a mottle-type image. This is as
expected since the mottle-type images are
immediately
classified at the first decisionnode. An increase intheresolutiontoabout 350 x 350 increasesthecomputationtime to
approximately 18s for a deletion-type image and approximately20s for a mottle
image.
36-The computation costs involved is not at all
burdening
for the given MATLABprototypingenvironment.
Chapter 5
Conclusion
and
Future Work
This thesis proposes an algorithm for automatically
identifying
and classifying aspecificset ofimage quality defectsinprinteddocuments. The algorithm accepts scanned
versions ofsuspicious defectedprinted media, attempts to accurately locatemajor defect
regions and indicate the defect type
(Deletion, DCD,
or mottle). Due to large variationsbetween elements ofthe same class, several pre-processing techniques were carried out
on each image to attain some level ofuniformity amongstthe samples.
Using
a custom-38-decisiontree classifier,
binary
decisions were madeby
employing simple shape and sizeconstraints at each decision node. The use of principal component analysis to obtain a
grayscale image helpstopreservethe contrastoftheoriginal RGB sample.
Additionally,
the use oflocalnormalizationprocedures assisted in avoidingmisclassification situations
by
making thebackground
uniform wherever possible. Also given the noisy nature andlow contrast of some the sample, anaccuracyof96.6% was still attained.
However,
thisaccuracy tends to depreciate with
increasing
noise levels using the pre-computedthresholds.
Since this procedure has proved to be quite successful, the next step involves an
automation of the defect localization process
by
possiblyincorporating
the originalelectronic documentto
help
localizeareas ofsignificantdefectpresence. Therobustnessofthe algorithm against
increasing
levels ofnoise will also be improveduponby
makingthecomputation ofthethresholdvaluesdependentonthegiven noiselevel.
39-References
1. Y.
Rui,
T. S.Huang,
and S.Chang,
"Image Retrieval: CurrentTechniques,
Promising
Directions,
andOpen Issues,"Journal of Vis. Comm. andImage Rep.
10,
pp. 39-62(1999).2. A. M. W.
Smeulders,
M.Worring,
S.Santini,
A.Gupta,
and R.Jain,
"Content-based image retrieval attheend oftheearly years,"
IEEE Trans, onPatt. Analysis andMachine
Intelligence,
Vol.22,
No.12,
pp.1349-1380,
Dec. 2000.3. H.
Burkhardt,
and S.Siggelkow,
"Invariant features fordiscriminating
betweenequivalence classes,"
Nonlinear Model-based Image Vid. Proc. and
Anal,
JohnWiley
andSons,
2000.4. M. K.
Hu,
"Visual pattern recognitionby
moment invariants," in J. K.Aggarwal,
R. O.
Duda,
and A.Rosenfeld,
Comp. Meths. in ImageAnal,
IEEE computerSociety,
LosAngeles, CA,
1977.5. R. C. Gonzalez and R. E.
Woods,
Digital ImageProcessing
2ndEdition,
PrenticeHall,
NewJersey,
2002.6. B. M.
Mehtre,
M.Kankanhalli,
andW. F.Lee,
"Shapemeasuresforcontentbasedimage retrieval: A
comparison,"
Information
Processing
& Management33(3),
1997.7. Y.
Rui,
T. S.Huang,
and S.Mehrotra,
"Content-based image retrieval withrelevance feedback inMARS," Proc. ofInt. Conf. onImage
Proc,
Vol.2,
pp. 815-818, 1997.
8. W. Y.
Ma,
and B. S.Manjunath,
"Netra: A toolbox for navigating large image databases,"Multimedia
Systems,
Vol.7, No.3,
pp.:184-198, 1999.9. R. O.
Duda,
P. E.Hart,
andD. G.Stork,
Pattern Classification2ndEdition,
JohnWiley
andSons,
2001.10,
N.Vasconcelos,
"On the complexity of probabilistic imageretrieval," IEEEInt.
Conf. on Comp. Vis. andPatt.
Recognition,
Vol.2,
pp.400-407,
July
2001.11. N.
Beckmann,
H.Kriegel,
R.Schneider,
and B.Seeger,
"The R*-tree: Anefficient robust access method for points and
rectangles,"
ACM SIGMOS Int.
Conf. on
Mang
Of
Data,
AtlanticCity, May
1990.12. H.
Samet,
"The quadtree and related hierarchical datastructures,"
ACM
Computing
Surveys, Vol.16, No.2,
pp.187-260,
1984.13. H. J.
Zhang,
and D.Zhong,
"A Schemeforvisual feature-basedimageindexing,"
Proc. ofSPIEconf. onStorageandRetrieval for Imageand Video Databases
III,
pp.
36-46,
SanJose,
Feb. 1995.14. J. Iivarinen and A.
Visa,
"An Adaptive Texture and Shape Based Defect Classification,"Proc. ofthe 14th Int. Conf. on Patt.
Rec,
Vol.1,
pp.117-122,
Brisbane, Australia,
Aug. 1998.15. Y. Li andT. W.
Liao,
"Weld DefectDetectionBasedonGaussianCurve,"
IEEE,
1996.
16. D.
Mery
and M. A.Berti,
"Automatic detection ofwelding defects using texturefeatures,"
Insight,
Vol.45(10),
Oct. 2003.17. H.
Ng,
"Automaticthresholdingfor Defect Detection,"Proc. ofthe 3rd Int. Conf.onImageand
Graphics,
2004.18. J. C.
Briggs,
D. J.Forrest,
A. H.Klein,
and M.Tse,
"Living
with ISO-13660:Pleasures and Perils," Proc. ofthe IS&T's
NIP15,
Int. Conf. on DigitalPrinting
Tech., Orlando, Florida,
Oct. 1999.19. ISO/IEC DIS 13660 Draft International
Standard,
"Office Equipment-Measurement of image quality attributes for
hardcopy
output-Binary
monochrome text and graphic images," Int. Org. for
Standardization,
ISO/IEC JTC1SC28,
1996.20. D. Rene
Rasmussen,
K. D.Donohue,
Y. S.Ng,
W. C.Kress,
F.Gaykema,
andS.Zoltner,
"ISO 19751 macro-uniformity."21. G.
Sharma,
et al, "Methods and apparatus foridentifying
marking process andmodifying image data based on image spatial
characteristics,"
US Patent
#6353675B1,
Mar. 2002.22. D. F. Dunn and N. E.
Mathew,
"Extracting
Color Halftones from PrintedDocuments
Using
TextureAnalysis,"Proc. oftheInt. Conf. onImage Proc., Vol.
1,
pp. 787-790, Oct. 1997.23. William K.
Pratt,
Digital ImageProcessing,
JohnWiley
&Sons,
NewYork,
1991.
24.
http://gug.sunsite.dk/docs/Grokking-the-GIMP-vL0/node54.html
25. http://www.mathworks.com/access/helpdesk/help/toolbox/images/rgb2gray.html
26. J. E.
Jackson,
A User's Guide to Principal Components.Wiley
Series inProbability
andMathematical Statistics. JohnWiley
&Sons,
NewYork,
London,
Sydney,
1991.27. P.
Soille,
MorphologicalImage Analysis: PrinciplesandApplications.Springer-Verlag,
1999.28. D.
Huttenlocker,
G.Klanderman,
and W.Rucklidge,
"Comparing
images usingthe Hausdorff distance,"
IEEE Trans. Patt.. Anal. Mach. Intell. 15
(9) (1993)
850-863.
29. E. Saber and A. Murat
Tekalp,
"Frontal-view face detection and facial featureextraction using color, shape and symmetry based cost
functions,"
Patt. Rec.
Letters,
Vol.19,
pp.669-680,
1998.29. P. L.
Rosin,
"Measuring
shape:ellipticity,rectangularity,andtriangularity,"
Proc.
15th Intern. Conf. onPatt.
Recognition,
2000.31 N.
Otsu,
"Athresholdselection methodfrom gray-levelhistogram,"IEEETransactionson
Systems,
ManandCybernetics,
SMC-8,
pp.62-66,
1978.32. O. A.
Ugbeme,
E.Saber,
and W.Wu,
"An automated defect classificationalgorithmforprinted
documents,"
Proc. ofInt. Conf. in
Imaging
Science,
2006.33. The Math
Works,
Inc.,
MATLAB ReferenceGuide,
1994.