R E S E A R C H A R T I C L E
Open Access
HIV and TB co-infection in the ART era: CD4
count distributions and TB case fatality in
Cape Town
Richard Kaplan
1*, Sabine Hermans
1,2,3, Judy Caldwell
4, Karen Jennings
4, Linda-Gail Bekker
1,5and Robin Wood
1,5Abstract
Background:In Cape Town, the roll-out of antiretroviral therapy (ART) has increased over the last decade with an estimated coverage of 63% of HIV- positive patients in 2013. The influence of ART on the characteristics of the population of HIV-positive patients presenting to the primary care TB programme is unknown. In this study, we examined trends in CD4 count distribution, ART usage and treatment outcomes among HIV-positive TB patients in Cape Town from 2009 to 2013.
Methods:Data from the electronic TB register on all newly registered drug-sensitive TB patients≥18 years were analyzed retrospectively. Descriptive statistics were used to compare baseline characteristics, the CD4 count distribution and TB treatment outcomes both by year of treatment and ART status at the start of TB treatment. Survival analyses were used to assess the change in mortality risk during TB treatment over time, stratified by ART status at start of TB treatment.
Results:118,989 patients were treated over 5 years. HIV prevalence among TB patients decreased from 50.9% in 2009 to 49.0% in 2013. The absolute number of HIV-positive TB cases declined by 13.2% between 2010 and 2013. More patients entered the TB programme on ART in 2013 compared to 2009 (30.0% vs 9.9%). Among these, the CD4 count distribution showed a year by year shift to higher CD4 counts. In 2013, over 75% of ART-naïve TB patients still had a CD4 count < 350 cells/mm3. ART initiation among ART-naive patients increased from 37.0 to 77.7% and TB case fatality declined from 7.4 to 5.2% (p< 0.001). In multivariate analysis a decrease in TB mortality was most strongly associated with CD4 count (Adjusted HR 0.82 per increase of 50 cells/mm3, 95% CI: 0.81–0.83,p< 001) and the initiation of ART during TB treatment (Adjusted HR 0.39, 95% CI: 0.35–0.42,p< 0.001).
Conclusion:Comprehensive changes in the ART and TB treatment programmes resulted in incremental increases in ART coverage for HIV-positive TB patients and a subsequent decrease in TB case fatality due to increased ART uptake in HIV-positive ART-naïve patients. However TB still remained a major presenting opportunistic infection with the majority of cases occurring at low CD4 counts.
Keywords:Tuberculosis, HIV, Antiretroviral therapy, Mortality, TB case fatality, CD4 count
* Correspondence:Richard.Kaplan@hiv-research.org.za
1The Desmond Tutu HIV Centre, Institute for Infectious Disease and
Molecular Medicine, Faculty of Health Sciences, University of Cape Town, Anzio Road, Observatory, Cape Town 7925, South Africa
Full list of author information is available at the end of the article
Background
In sub-Saharan Africa, the increase in the tuberculosis (TB) epidemic has been shown to strongly correlate with the increase in HIV-prevalence [1, 2]. This has been driven predominantly by a rise in HIV-positive TB cases among patients with severe immune suppression [2].
Public health interventions aimed at reducing TB inci-dence rates have included the WHO three I’s strategy of intensified case-finding, isoniazid preventive therapy and infection control as well as wide-scale antiretroviral ther-apy (ART) for HIV-positive patients [3]. In HIV-positive patients, ART has been shown to be strongly associated with a reduction in TB incidence rates [4]. However, previous studies of HIV/TB co-infected patients in sub-Saharan Africa have shown that most patients diag-nosed with TB had low CD4 counts and were not receiv-ing ART at the time of TB diagnosis [5–7].
In South Africa, the coverage of the ART rollout has increased substantially over the last decade [8]. In Cape Town with an HIV prevalence of 5.2% in 2013, the roll-out of ART in primary health care clinics was esti-mated to provide coverage of 63% of HIV-positive pa-tients in that same year [9]. While the increase in coverage has been shown to coincide with a decline in the HIV-positive TB epidemic in the city, the influence of ART on the characteristics of the HIV-positive pa-tients presenting with TB is unknown.
This study therefore aimed to determine the annual changes in HIV prevalence, CD4 count distribution, ART initiation and TB treatment outcomes among HIV-positive TB patients as well as the risk factors for TB case fatality in this cohort of patients receiving TB treatment in Cape Town from 2009 to 2013.
Methods
Setting and treatment
In Cape Town, TB treatment is provided in 101 primary care clinics by nursing staff with support from medical officers. During the period of the study, forty of these clinics also provided antiretroviral therapy with the re-mainder referring patients off- site for ART.
ART eligibility criteria and treatment regimens for HIV/TB co-infected patients changed twice during the period of the study. Prior to mid-2010, ART initiation was recommended for adult HIV-positive patients with a CD4 count <200copies/mm3 or WHO Stage 4 disease. The recommended first line treatment regimens were stavudine or zidovudine with lamivudine and efavirenz or nevirapine [10]. In 2010, updated South African ART guidelines extended the CD4 eligibility criteria to <350cells/mm3and recommended a first line regimen of tenofovir, lamivudine and efavirenz and in August 2012, the guidelines were amended again to provide ART for all TB/HIV co-infected patients irrespective of the CD4
count [11, 12]. Second line ART was either zidovudine or tenofovir depending on prior exposure during first line treatment plus lamivudine and lopinavir/ritonavir. Due to rifampicin interactions with protease inhibitors, patients with TB on second line ART had the lopinavir/ ritonavir boosted with extra ritonavir or the dose dou-bled slowly over a 3 week period [10,11].
TB diagnosis and treatment guidelines also changed during the study period. Up to 2011, microbiological TB confirmation was determined through sputum smear microscopy or TB culture. [13] From August 2011, Gen-eXpert MTB/RIF was rolled out and by February 2013 it had completely replaced smear microscopy as the pri-mary test for TB [14]. During the study period, new TB patients received treatment with a daily fixed dose com-bination tablet of rifampicin, isoniazid, pyrazinamide and ethambutol (RHZE) during the intensive phase of TB treatment followed by rifampicin and isoniazid (RH) in the continuation phase. Prior to 2013, retreatment TB patients received streptomycin 5 days a week for 2 months, rifampicin, isoniazid, pyrazinamide and eth-ambutol daily for 3 months, followed by rifampicin, iso-niazid and ethambutol for a further 5 months. [13] In 2013, streptomycin was phased out and all patients with drug sensitive TB received RHZE in the intensive phase and RH in the continuation phase [14].
Study design and population
This was a retrospective cohort analysis of newly regis-tered drug sensitive TB patients ≥18 years. The data for the analysis was extracted from the electronic TB register (ETR.net) for Cape Town which is a database of case re-cords of all patients who received TB treatment in primary care TB clinics in Cape Town. Included in the study were adult patients who started TB treatment in any of Cape Town’s primary health care TB treatment facilities from 1 January 2009 to 31 December 2013. To avoid duplication of cases, patients who transferred between primary care TB clinics for treatment were excluded. Although patients with drug resistant TB were not routinely entered into the
ETR.netdatabase, some patients in the database were sub-sequently noted to have drug resistant TB. These patients were also excluded from the analysis.
Operational definitions
The TB definitions of TB treatment outcomes were ac-cording to the 2009 WHO TB Treatment Guidelines. [15] TB success was defined as the summation of cure and completion. TB case fatality was defined as death during TB treatment irrespective of cause of death. Pa-tients who did not have a TB treatment outcome were recorded as“not evaluated”.
result at the beginning of TB treatment, or was recorded as receiving ART and/or co-trimoxazole prophylaxis and/or had a recorded CD4 cell count result at start of TB treatment. HIV-negative status was defined by a HIV-negative test result recorded in the database. All other patients were considered to be of unknown HIV status.
Data analysis
Descriptive statistics were used to compare baseline characteristics, the CD4 count distribution and TB treat-ment outcomes both by year of treattreat-ment and ART sta-tus at the start of TB treatment. These were summarised as proportions for categorical variables and medians with inter-quartile ranges (IQRs) for continuous vari-ables. Differences in HIV prevalence and median CD4 counts over time were tested using the chi-square test for trend and the Cuzick nonparametric test for trend respectively. Survival analyses were used to assess the change in mortality risk during TB treatment over time stratified by ART status at start of TB treatment (log-rank test for equality in survivor function). Censor-ing occurred at dates of death, default, transfer out, fail-ure, cure or completion. Uni- and multivariable Cox proportional hazard models were used to determine risk factors for TB mortality in the HIV-positive patients on ART at start of TB treatment and not on ART at start of TB treatment. The proportionality assumption was assessed visually using –ln((−ln(survival)) plots. The analyses were performed using Stata IC 13.0 (StataCorp, USA).
Ethics approval
The Cape Town City Health Directorate approved the use of an anonymised database of routinely collected TB data for this analysis. As the data used in this analysis were col-lected as part of the routine monitoring and evaluation of the South African National TB programme, patients were not requested to provide informed consent for the use of their data. Confidentiality was ensured through the re-moval of patient identifiers prior to the analysis. This study was approved by the University of Cape Town Research Ethics Committee.
Results
Cohort characteristics
Over the 5 year study period from 1 Jan 2009 to 31 Dec 2013, 149,360 TB patients were treated in 101 primary care clinics in Cape Town. Of these, 30,371 were ex-cluded from this analysis as they were under the age of 18 (n= 22,468) or transferred care between the primary care TB clinics (n= 6746) or were found to have had drug resistant TB (n= 1157). Of the remaining 118,989 newly registered adult patients with drug sensitive TB,
60482 (50.8%) were HIV-positive and formed the cohort for this analysis (Additional file 1: Appendix 1). The re-mainder were either HIV-negative [55,377 (46.5%)] or had an unknown HIV status [3130 (2.6%)]. The HIV prevalence among TB patients decreased from 50.9% in 2009 to 49.0% in 2013. The absolute numbers of adult TB cases increased by 1.7% from 24,291 in 2009 to a peak of 24,697 in 2010 and then declined by 8.6% to 22,585 cases in 2013. This was largely due to a decline in HIV-positive TB cases. These first increased by 3.0% from 12,372 in 2009 to 12,749 in 2010 and then de-creased by 13.2% to 11,060 in 2013. Over the same time period, HIV-negative TB cases increased by 5.6% from 10,673 in 2009 to 11,276 in 2010 with a marginal de-crease of 54 cases (0.5%) between 2010 and 2013. The analysis of the 60,482 HIV-positive TB patients showed that 11,708 (19.4%) were on ART at the start of TB treat-ment while 48,749 (80.6%) were not on ART at the start of TB treatment.
HIV-positive patients on ART
The patient characteristics of this cohort are shown by year in Table 1a. The proportion of patients on ART at the start of TB treatment increased over the 5 years from 9.9% in 2009 to 30.0% in 2013. The median age was 35 [interquartile range (IQR) 30–41 years] and 6799 (58.1%) were female. The proportion of extra-pulmonary TB cases decreased from 27.5% in 2009 to 16.8% in 2013. Over this time period, the median CD4 count at the start of TB treatment increased from 150 [IQR 74–242 cells/mm3] to 202 [IQR 91–348 cells/mm3]. There was a decline in retreatment cases particularly from 2012 to 2013 where the proportion of re-treatment cases decreased from 43.1 to 41.1%.
HIV-positive patients not on ART
Table 1b shows the characteristics by year of the HIV-positive patients who were not on ART at the start of TB treatment. The median age was 34 [IQR 29– 41 years] and 25,384 (52.1%) were female. In this cohort there was also a decline in the proportion of extra-pulmonary TB cases over the 5 years from 20.5% in 2009 to 17.7% in 2013 but this decline was less than in the patients on ART at the start of TB treatment. Re-treatment cases were unchanged between 2009 and 2012 but decreased from 28.8% in 2012 to 24.7% in 2013. The median CD4 count in this cohort was 152 [IQR 69–281 cells/mm3] in 2009, rising to 176 [IQR 74– 319 cells/mm3] in 2012 but then decreasing to 162 [IQR 67–313 cells/mm3] in 2013.
treatment recording a higher proportion of retreatment TB cases compared to patients not on ART (43.1% vs 28.2%) and a higher proportion of extra-pulmonary TB (21.3% vs 19.6%). The majority of patients in both groups were female but more female patients were re-corded on ART compared to not on ART (58.1% vs 52.1%) (Tables1aand Table1b).
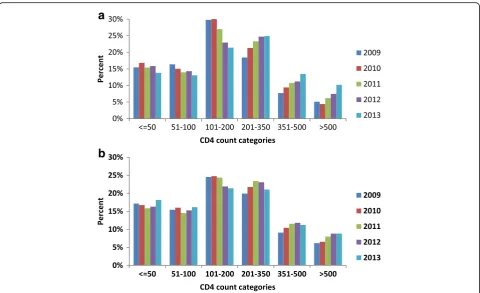
The CD4 count distribution and ART uptake
Figure 1a shows the CD4 count distribution of the patients who were on ART at the start of TB treat-ment. The CD4 count distribution showed a small year by year shift from CD4 count categories less than 200 cells/mm3 to CD4 categories greater than 200 cells/mm3 with the greatest shift occurring in the CD4 category of 101–200 cells/mm3. In the patients who were not on ART at the start of TB treatment (Fig. 1b), there was also a shift in CD4 count distri-bution from the category 101–200 cells/mm3 to
categories higher than 200 cells/mm3 but this change was far less pronounced.
ART uptake during TB treatment among those not on ART at the start of TB treatment increased substantially over the five year period from 37.0% in 2009 to 77.7% in 2013. However, when ART uptake was compared across CD4 categories, in 2013 despite guidelines that pre-scribed universal coverage for all HIV-positive TB pa-tients, a greater proportion of patients with higher CD4 counts did not start ART: in the CD4 count category from 0 to 200 cells/mm3, 17.9% of patients did not start ART, in the category of 201–500 cells/mm3, 22.8% did not start ART and in category > 500 cells/mm3, 36.8% did not start ART. (data not shown).
[image:4.595.59.540.99.471.2]Figure 2 shows ART status by CD4 count categor-ies per 50 cell/mm3 increase for the years 2009, 2011 and 2013. Over the five year period, total ART coverage of TB patients increased considerably both through the increase in numbers of patients present-ing on ART as well as substantial increases in ART Table 1Baseline characteristics by year of HIV-positive patients on ART (Section A) and not on ART (Section B) at the start of TB treatment
Start year 2009 2010 2011 2012 2013 Total
All HIV-positive patients 12,372 12,749 12,490 11,811 11,060 60,482
Section A.
HIV-positive patients on ARTn(%) 1221 (9.9) 1617 (12.7) 2235 (17.9) 3322 (28.1) 3313 (30.0) 11,708 (19.4)
Age, years, median [IQR] 35 [29–41] 34 [29–40] 36 [30–41] 35 [30–42] 36 [30–42] 35 [30–41]
Gender
Femalen(%) 746 (61.1) 980 (60.6) 1323 (59.2) 1870 (56.3) 1880 (56.7) 6799 (58.1)
Classification
New TBn(%) 678 (55.5) 888 (54.9) 1249 (55.9) 1890 (56.9) 1953 (58.9) 6658 (56.9)
Retreatment TBn(%) 543 (44.5) 729 (45.1) 986 (44.1) 1432 (43.1) 1360 (41.1) 5050 (43.1)
Category
PTBn(%) 885 (72.5) 1184 (73.2) 1725 (77.2) 2668 (80.3) 2758 (83.2) 9220 (78.7)
EPTBn(%) 336 (27.5) 433 (26.8) 510 (22.8) 654 (19.7) 555 (16.8) 2488 (21.3)
Median CD4 150 [74–242] 153 [75–254] 169 [80–290] 178 [80–315] 202 [91–348] 175 [81–305]
Section B.
HIV-positive patients not on ART n (%) 11,142 (90.1) 11,130 (87.3) 10,255 (82.1) 8,481 (71.8) 7,741 (70.0) 48,749 (80.6)
Age, years, median [IQR] 34 [28-40] 34 [28-40] 34 [29-41] 35 [29-41] 35 [29-41] 34 [29-41]
Gender
Femalen(%) 5,839 (52.4) 5,973 (53.7) 5,367 (52.3) 4,313 (50.9) 3,892 (50.3) 25,384 (52.1)
Classification
New TBn(%) 7,957 (71.4) 7,930 (71.2) 7,259 (70.8) 6,035 (71.2) 5,830 (75.3) 35,011 (71.8)
Retreatment TBn(%) 3,185 (28.6) 3,200 (28.8) 2,996 (29.2) 2,446 (28.8) 1,911 (24.7) 13,738 (28.2)
Category
PTBn(%) 8,860 (79.5) 8,808 (79.1) 8,186 (79.8) 6,964 (82.1) 6,370 (82.3) 39,188 (80.4)
EPTBn(%) 2,282 (20.5) 2,322 (20.9) 2,069 (20.2) 1,517 (17.9) 1,371 (17.7) 9,561 (19.6)
uptake during TB treatment for all CD4 count cat-egories. Overall total ART coverage for HIV-positive TB patients during TB treatment increased from 45.0% in 2009 to 85.2% in 2013.
TB treatment outcomes
There was an increase in TB treatment success rates over the 5 year period for both HIV positive TB pa-tients who presented on ART (from 78.1 to 80.9%) and patients who were not on ART (76.7 to 79.6%) (Table 2). This was largely driven by a decrease in TB case fatality. For the patients who presented with TB while on ART, the TB case fatality decreased from 5.6% in 2009 to 4.7% in 2013 while for patients who were not on ART, the TB case fatality decreased from 7.4% in 2009 to 5.2% in 2013.
Survival analysis
Figure 3 shows Kaplan–Meier plots of survival by year for the HIV-positive patients on ART (Fig. 3a) and not on ART at start of TB treatment (Fig. 3b). Survival by year for the HIV-positive patients on ART at the start of TB treatment was not significantly different over the 5 year period (p= 0.47) but for the patients not on ART
at the start of TB treatment, the year on year improve-ment in survival was significant (p< 001).
Risk factors for mortality during TB treatment for patient on ART and not on ART at the start of TB treatment
For patients on ART at the start of TB treatment, a mul-tivariable analysis using Cox proportional hazard models showed a higher risk of TB mortality associated with in-creasing age (Adjusted hazard ratio (aHR) 1.28 per 10 years increase of age, 95% CI: 1.17–1.40, p< 0.001) and a lower risk of TB mortality associated with new TB (aHR 0.71, 95% CI: 0.61–0.84, p< 0.001) and increasing CD4 counts (aHR 0.87 per increase of 50 cells/mm3, 95% CI: 0.84–0.89, p< 0.001). TB mortality was not as-sociated with calendar year of treatment, gender or type of TB. (Table3).
Risk factors for TB mortality during TB treatment for HIV-positive patient not on ART at the start of TB treat-ment were increasing age, female gender, retreattreat-ment TB, and extra-pulmonary TB (Table 4). An increase in CD4 count was associated with a decrease in mortality (aHR 0.82 per increase of 50 cells/mm3, 95% CI: 0.81–0.83, p< 001) and the initiation of ART during TB treatment was most strongly associated with lower TB mortality (aHR 0.39, 95% CI: 0.35–0.42,p< 0.001).
a
b
[image:5.595.58.539.86.379.2]Discussion
Despite a great increase in the estimated ART coverage in Cape Town, the decrease in the HIV-positive adult TB case load was modest (13.2%). The effect of the ART treatment programme is apparent from the increase in numbers presenting on ART at the start of TB treatment and the upward shift in the CD4 count distribution of these patients. This is further supported by the decline in extra-pulmonary TB cases which is indicative of a less immunocompromised patient population.
However in 2013, 70% of HIV-positive TB patients were not on ART when presenting with TB, indicating that despite the roll-out of an extensive HIV treatment programme, TB still remained an important gateway to HIV care. The CD4 count distribution of these patients was largely unchanged with over 75% having a CD4 cell count less than 350 cells/mm3. For these patients, the multivariate analysis showed that ART uptake during TB treatment was most strongly associated with decreased TB mortality. Higher CD4 counts were also associated with decreased mortality but over the five year period, the rise in median CD4 count for patients who were not on ART at the start of TB treatment was modest indicat-ing that the improved mortality was most likely driven by the considerable increase in ART uptake (37.0 to 77.7%). Total ART coverage for HIV-positive TB patients during TB treatment increased from 45.0% in 2009 to 85.2% in 2013.
This represents a substantial programmatic improve-ment in how TB/HIV coinfected patients have been managed in Cape Town. The decline in TB case fatality for TB patients who were not on ART from 7.4 to 5.2% compares very favourably with other treatment pro-grammes. In a systematic review and meta-analysis on the impact of ART on mortality in HIV-positive patients on TB treatment, Odone et al. reported an estimated
[image:6.595.56.292.88.483.2]Fig. 2CD4 count distribution by ART status for the year 2009, 2011 and 2013
Table 2TB treatment outcomes by year for HIV-positive patients by ART status at start of TB treatment
Total Successn(%) Deathn(%) Defaultn(%) Failuren(%) Transfer Outn(%) Not evaluatedn(%)
HIV-positive patients (On ART at START)
2009 1221 954 (78.1) 68 (5.6) 101 (8.3) 3 (0.3) 42 (3.4) 53 (4.3)
2010 1617 1280 (79.2) 102 (6.3) 138 (8.5) 8 (0.5) 45 (2.8) 44 (2.7)
2011 2235 1799 (80.5) 134 (6.0) 192 (8.6) 8 (0.4) 69 (3.1) 33 (1.5)
2012 3322 2651 (79.8) 178 (5.4) 309 (9.3) 19 (0.6) 122 (3.7) 43 (1.3)
2013 3313 2681 (80.9) 156 (4.7) 305 (9.2) 15 (0.5) 96 (2.9) 60 (1.8)
HIV-positive patients (Not on ART at START)
2009 11,142 8546 (76.7) 826 (7.4) 1005 (9.0) 36 (0.3) 494 (4.4) 235 (2.1)
2010 11,130 8746 (78.6) 738 (6.6) 1009 (9.1) 40 (0.4) 449 (4.0) 148 (1.3)
2011 10,255 8135 (79.3) 619 (6.0) 977 (9.5) 24 (0.2) 363 (3.5) 137 (1.3)
2012 8481 6718 (79.2) 513 (6.1) 848 (10.0) 28 (0.3) 274 (3.2) 100 (1.2)
[image:6.595.57.539.548.732.2]case fatality of 8–14% based on an analysis of 21 studies in Africa, Asia and the United Kingdom [16].
The low case fatality rate in Cape Town should how-ever be interpreted with caution as the default rate of 9.4% in 2013 could partially represent unascertained mor-tality. The default rate however remained stable over the five year period for TB patients who were not on ART at the start of TB treatment. This confirms an overall abso-lute improvement in treatment outcomes as reflected in the higher combined cure and completion rate.
While the overall improvement in ART uptake from 2009 to 2013 was substantial, patients with higher CD4 counts in 2013 were less likely to start ART during TB treatment than those with lower CD4 counts. This may be partially due to the ART treatment guidelines which indi-cate that ART can be delayed for up to two months in pa-tients with higher CD4 counts but may also be due to patient choice or clinicians’practice [17]. While this is a small portion of the total population of TB cases, it does represent a missed opportunity to enrol patients on ART
[image:7.595.60.539.88.278.2]Fig. 3aKaplan-Meier plot of survival by year for HIV-positive patients on ART at start of TB treatment (p= 0.47).bKaplan-Meier plot of survival by year for HIV-positive patients not on ART at start of TB treatment (p< 001)
Table 3Univariable and multivariable analyses of factors associated with mortality for patients on ART at start of TB treatment
PYRS Deaths Univariable Multivariable
Characteristic HR (95% CI) P-value aHR (95% CI) P-value
Calendar year
2009 11,479 1400 1 1
2010 11,646 1275 1.11 (0.81–1.51) 0.51 1.18 (0.85–1.63) 0.32
2011 11,350 1135 1.06 (0.79–1.42) 0.71 1.17 (0.86–1.59) 0.32
2012 11,095 1099 0.95 (0.72–1.26) 0.74 1.07 (0.80–1.44) 0.64
2013 10,010 922 0.90 (0.68–1.20) 0.47 1.05 (0.77–1.42) 0.76
Age (per 10 years increase) 5581 634 1.27 (1.17–1.38) < 0.001 1.28 (1.17–1.40) < 0.001
Female gender 3232 329 1 1
Male gender 2349 305 1.28 (1.09–1.50) 0.002 1.02 (0.86–1.20) 0.84
Re-treatment TB 2606 340 1 1
New TB 2975 294 0.72 (0.61–0.83) < 0.001 0.71 (0.61–0.84) < 0.001
PTB 4411 494 1 1
EPTB 1170 140 1.06 (0.88–1.28) 0.56 1.05 (0.86–1.27) 0.43
CD4 (per increase of 50 cells/mm3) 5389 603 1
0.87 (0.84–0.89)
< 0.001 1
0.87 (0.84–0.89)
P< 0.001
[image:7.595.65.539.483.714.2]and could be detrimental to their long term prognosis par-ticularly if ART is not started after the TB episode.
While this study shows improved ART uptake during TB treatment and improved TB treatment outcomes, the relatively small reduction in the HIV-positive TB case load does not provide support for ART as a highly effective method for curtailing the population TB case load. This is consistent with our recent evaluation of trends in TB noti-fication rates during ART scale-up in Cape Town [9]. This is also supported by a number of modelling scenarios that indicate a limited effect of ART on TB incidence unless scale-up encompasses near universal coverage for all HIV-positive patients. [18–20].
The limitations of this study are the retrospective study design and the reliance on programmatic data. This is par-ticularly apparent in the reported decline in retreatment cases from 2012 to 2013 which coincided with the phasing out of streptomycin in 2013 and may be due to an ascer-tainment error as retreatment cases were often identified by the inclusion of streptomycin in the TB treatment regi-men [14]. A further limitation is that the data cut-off point for this study was end December 2013 and our findings therefore may not reflect the current TB prevalence and treatment outcomes in Cape Town.
Conclusion
This study showed comprehensive changes in the ART and TB treatment programmes resulted in incremental
increases in ART coverage for HIV-positive TB patients and a subsequent decrease in TB case fatality due to in-creased ART uptake in HIV-positive ART-naïve TB pa-tients. However TB still remained a major presenting opportunistic infection with the majority of cases occur-ring at low CD4 counts.
Additional file
Additional file 1:Appendix 1. Extract from the electronic TB register (ETR.net) of case records for all newly registered adult patients with drug sensitive TB who were treated in primary care TB clinics in Cape Town over the study period. (XLSX 12993 kb)
Abbreviations
ART:Antiretroviral therapy; HIV: Human immunodeficiency virus; TB: Tuberculosis
Acknowledgements
This study was performed in collaboration with the Cape Town City Health Directorate.
Funding
This work was supported by the European Union [Marie Curie International Outgoing Fellowship for Career Development PIOF-GA-2012-332311 to SH], the South African Medical Research Council [MRC-RFAUFSP-01-2013/CCAMP to RW], the National Institutes of Health [R01AI058736 and R01AI093269 to RW] and the Bill & Melinda Gates Foundation [OPP1116641 to RW].
Availability of data and materials
[image:8.595.59.543.108.360.2]All data generated or analysed during this study are included in this published article and a supplementary information file (See Additional file1: Appendix 1).
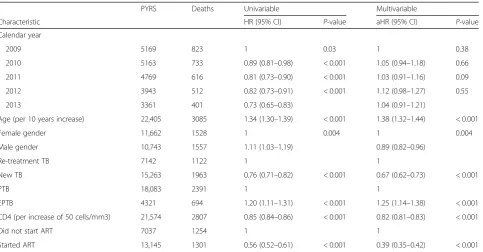
Table 4Univariable and multivariable analyses of factors associated with mortality for patients who were not on ART at start of TB treatment
PYRS Deaths Univariable Multivariable
Characteristic HR (95% CI) P-value aHR (95% CI) P-value
Calendar year
2009 5169 823 1 0.03 1 0.38
2010 5163 733 0.89 (0.81–0.98) < 0.001 1.05 (0.94–1.18) 0.66
2011 4769 616 0.81 (0.73–0.90) < 0.001 1.03 (0.91–1.16) 0.09
2012 3943 512 0.82 (0.73–0.91) < 0.001 1.12 (0.98–1.27) 0.55
2013 3361 401 0.73 (0.65–0.83) 1.04 (0.91–1.21)
Age (per 10 years increase) 22,405 3085 1.34 (1.30–1.39) < 0.001 1.38 (1.32–1.44) < 0.001
Female gender 11,662 1528 1 0.004 1 0.004
Male gender 10,743 1557 1.11 (1.03–1.19) 0.89 (0.82–0.96)
Re-treatment TB 7142 1122 1 1
New TB 15,263 1963 0.76 (0.71–0.82) < 0.001 0.67 (0.62–0.73) < 0.001
PTB 18,083 2391 1 1
EPTB 4321 694 1.20 (1.11–1.31) < 0.001 1.25 (1.14–1.38) < 0.001
CD4 (per increase of 50 cells/mm3) 21,574 2807 0.85 (0.84–0.86) < 0.001 0.82 (0.81–0.83) < 0.001
Did not start ART 7037 1254 1 1
Started ART 13,145 1301 0.56 (0.52–0.61) < 0.001 0.39 (0.35–0.42) < 0.001
Authors’contributions
RK, SH and RW designed the study. JC and KJ provided the data for the study. RK, SH and RW analysed the data. RK, SH and RW drafted the manuscript. RK, SH, JC, KJ, LB and RW provided substantive input on the first draft of the manuscript and reviewed and approved the final version.
Ethics approval and consent to participate
The Cape Town City Health Directorate approved the use of an anonymised database of routinely collected TB data for this analysis. As the data used in this analysis were collected as part of the routine monitoring and evaluation of the South African National TB programme, patients were not requested to provide informed consent for the use of their data. Confidentiality was ensured through the removal of patient identifiers prior to the analysis. The use of this data for the study was approved by the University of Cape Town Research Ethics Committee (HREC Ref Number 800/2014).
Consent for publication
N/A
Competing interests
The authors declare that they have no competing interests
Publisher’s Note
Springer Nature remains neutral with regard to jurisdictional claims in published maps and institutional affiliations.
Author details
1The Desmond Tutu HIV Centre, Institute for Infectious Disease and
Molecular Medicine, Faculty of Health Sciences, University of Cape Town, Anzio Road, Observatory, Cape Town 7925, South Africa.2Department of
Global Health, Academic Medical Center, University of Amsterdam, Amsterdam Institute for Global Health and Development, Amsterdam, the Netherlands.3Department of Internal Medicine, School of Medicine, Makerere
University College of Health Sciences, Kampala, Uganda.4City Health, City of
Cape Town, South Africa.5Department of Medicine, University of Cape Town, Cape Town, South Africa.
Received: 11 April 2017 Accepted: 16 July 2018
References
1. Corbett EL, Marston B, Churchyard GJ, De Cock KM. Tuberculosis in sub-Saharan Africa: opportunities, challenges, and change in the era of antiretroviral treatment. Lancet. 2006;367(9514):926–37.
2. Corbett EL, Watt CJ, Walker N, Maher D, Williams BG, Raviglione MC, Dye C. The growing burden of tuberculosis: global trends and interactions with the HIV epidemic. Arch Intern Med. 2003;163(9):1009–21.
3. 2015 Global Tuberculosis Report, 20th Edition, World Health Organisation. http://apps.who.int/iris/bitstream/handle/10665/191102/9789241565059_ eng.pdf;jsessionid=FEEE2DE6300639F8F812CA29F84C4C0C?sequence=1. Accessed 19 July 2018.
4. Suthar AB, Lawn SD, del Amo J, Getahun H, Dye C, Sculier D, Sterling TR, Chaisson RE, Williams BG, Harries AD, et al. Antiretroviral therapy for prevention of tuberculosis in adults with HIV: a systematic review and meta-analysis. PLoS Med. 2012;9(7):e1001270.
5. Kaplan R, Caldwell J, Middelkoop K, Bekker LG, Wood R. Impact of ART on TB case fatality stratified by CD4 count for HIV-positive TB patients in Cape Town, South Africa (2009-2011). J Acquir Immune Defic Syndr. 2014;66(5): 487–94.
6. Hermans SM, Castelnuovo B, Katabira C, Mbidde P, Lange JM, Hoepelman AI, Coutinho A, Manabe YC. Integration of HIV and TB services results in improved TB treatment outcomes and earlier prioritized ART initiation in a large urban HIV clinic in Uganda. J AcquirImmune Defic Syndr. 2012;60(2): e29–35.
7. Shaffer DN, Obiero ET, Bett JB, Kiptoo IN, Maswai JK, Sawe FK, Carter EJ. Successes and challenges in an integrated tuberculosis/HIV Clinic in a Rural, resource-limited setting: experiences from Kericho. Kenya AIDS Res Treat. 2012;2012:238012.
8. Johnson L. Access to antiretroviral treatment in South Africa, 2004–2011. Southern African J HIV Med. 2012;13(1):2012.
9. Hermans S, Boulle A, Caldwell J, Pienaar D, Wood R. Temporal trends in TB notification rates during ART scale-up in Cape Town: an ecological analysis. J Int AIDS Soc. 2015;18(1):20240.
10. Health NDoH: National Antiretroviral Treatment Guidelines.South African Department of Health: 1st ed, Pretoria, South Africa2004.
11. Clinical Guidelines for the management of HIV and AIDS on adults and adolescents. National Department of Health, South Africa. 2010; [https:// www.fidssa.co.za/Content/Documents/2010_Adult_ART_Guidelines.pdf]. 12. HAST Component WCDoH: Update to Antiretroviral Guidelines, Circular
H116/2012. In.; 2012.
13. NDoH: National Tuberculosis Management Guidelines 2009. South African Department of Health 2009.
14. WCDoH: Circular No: H22/2013. Management and treatment of TB in adults and children older than 8 years. In.; 2013.
15. World Health Organisation. Treatment of tuberculosis: guidelines - 4th ed. Geneva: World Health Organization; 2009.
16. Odone A, Amadasi S, White RG, Cohen T, Grant AD, Houben RM. The impact of antiretroviral therapy on mortality in HIV positive people during tuberculosis treatment: a systematic review and meta-analysis. PLoS One. 2014;9(11):e112017.
17. National NDoH: National consolidated guidelines for the prevention of mother-to-child transmission of HIV (PMTCT) and the management of HIV in children, adolescents and adults. National Department of Health, South Africa. 2014;http://www.sahivsoc.org/Files/Consolidated%20ART%20 guidelines%20_Jan%202015.pdf.
18. Knight GM, Dodd PJ, Grant AD, Fielding KL, Churchyard GJ, White RG. Tuberculosis prevention in South Africa. PLoS One. 2015;10(4):e0122514. 19. Pretorius C, Menzies NA, Chindelevitch L, Cohen T, Cori A, Eaton JW, Fraser
C, Gopalappa C, Hallett TB, Salomon JA, et al. The potential effects of changing HIV treatment policy on tuberculosis outcomes in South Africa: results from three tuberculosis-HIV transmission models. AIDS (London, England). 2014;28(Suppl 1):S25–34.