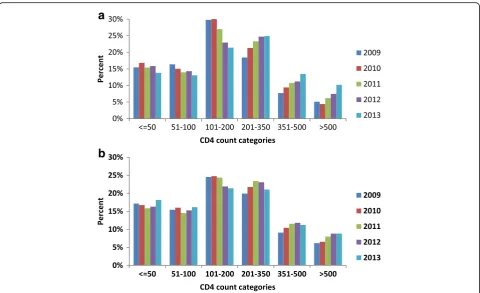
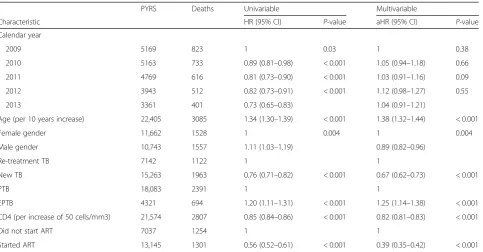
HIV and TB co infection in the ART era: CD4 count distributions and TB case fatality in Cape Town
Full text
Figure


Related documents
Inbred strain SB/Le male mice (genotype sa bg/sa bg Ato/Aw) at generation F,, or more, from the colony known to have progressive pneumonitis, were mated to
Average length of hospital stay, average annual costs and average costs per hospital admission (Euros) by primary diagnosis type, complications and age groups were also estimated..
The adsorption sites of adsor- bents used in fluoride adsorption significantly affects the adsorption process (equilibrium state and adsorption kinetic), since the adsorption
In the treated groups, suspension of test bhasmas Lauha Mandura bhasma was given in 11 mg/kg dose along with mercuric chloride solution 9 mg/kg.. A control group was also kept
performance is worst .Thus, CBRP is a better protocol in terms of Average delay of varying pause time.. 71 | P a g e
The result of bivalent t-test shows statistically highly important diff erence of cumulative biogas production from maize silage with lower and higher mix ratio (Tab. III)..
Taken together, our data suggest that generation of ROS and induction of apoptosis and cell cycle arrest in response to GANT61 is independent of Hh/Gli signaling in LO68
Prevalence of dementia in Canada, 1991, by type of dementia, sex and age group – numbers and rates per 1,000 population Source: Canadian Study of Health and Aging Working
