Methanol along the path from envelope to protoplanetary disc
Maria N. Drozdovskaya,
1‹Catherine Walsh,
1Ruud Visser,
2Daniel Harsono
1,3and Ewine F. van Dishoeck
1,41Leiden Observatory, PO Box 9513, NL-2300 RA Leiden, The Netherlands
2Department of Astronomy, University of Michigan, 500 Church Street, Ann Arbor, MI 48109, USA 3SRON Netherlands Institute for Space Research, PO Box 800, NL-9700 AV Groningen, The Netherlands 4Max-Planck-Institut f¨ur Extraterrestrische Physik, Giessenbachstrasse 1, D-85748 Garching, Germany
Accepted 2014 September 1. Received 2014 August 18; in original form 2014 April 29
A B S T R A C T
Interstellar methanol is considered to be a parent species of larger, more complex organic molecules. A physicochemical simulation of infalling parcels of matter is performed for a low-mass star-forming system to trace the chemical evolution from cloud to disc. An axisymmetric 2D semi-analytic model generates the time-dependent density and velocity distributions, and full continuum radiative transfer is performed to calculate the dust temperature and the UV radiation field at each position as a function of time. A comprehensive gas–grain chemical network is employed to compute the chemical abundances along infall trajectories. Two physical scenarios are studied, one in which the dominant disc growth mechanism is viscous spreading, and another in which continuous infall of matter prevails. The results show that the infall path influences the abundance of methanol entering each type of disc, ranging from
complete loss of methanol to an enhancement by a factor of>1 relative to the prestellar phase.
Critical chemical processes and parameters for the methanol chemistry under different physical conditions are identified. The exact abundance and distribution of methanol is important for the budget of complex organic molecules in discs, which will be incorporated into forming planetary system objects such as protoplanets and comets. These simulations show that the comet-forming zone contains less methanol than in the precollapse phase, which is dominantly of prestellar origin, but also with additional layers built up in the envelope during infall. Such
intriguing links will soon be tested by upcoming data from theRosettamission.
Key words: astrochemistry – comets: general – protoplanetary discs – stars: protostars.
1 I N T R O D U C T I O N
The birth of a star is accompanied by the emergence of a proto-planetary disc, which serves as a nursery for young planets. These systems are formed from dense, cold cores (Shu, Adams & Lizano 1987). With time, a rotating core evolves into the constituents of a protostar and a protoplanetary disc, to conserve angular momentum, leaving behind a remnant envelope. Young star-forming systems set the initial conditions for planet and comet formation, but it remains unclear what level of chemical complexity is attained in the early protoplanetary and cometary material. It is necessary to consider the chemical evolution as the envelope collapses in order to know the chemical composition of the regions in which protoplanets emerge. Complex organics formed at the early stages of star formation are
E-mail:[email protected]
likely important ingredients for the prebiotic chemistry of planetary systems.
Starting from simple chemical ingredients, such as water (H2O)
and carbon monoxide (CO), star-forming systems flourish in chem-ical complexity. Complex organic molecules have been observed in high-mass and low-mass protostars, as discussed in reviews by Herbst & van Dishoeck (2009) and Caselli & Ceccarelli (2012). However, the mechanism for their formation remains a puzzle. Laboratory experiments of UV-irradiated methanol (CH3OH) ice
have shown that the radicals produced by the photodissociation of CH3OH go on to produce species that are more complex, such as
glycolaldehyde (CH2OHCHO) and methyl formate (HCOOCH3)
(see e.g. ¨Oberg et al. 2009b). Methanol is thus considered to be a vital precursor of complex organic molecules. Furthermore, laboratory studies demonstrate that CH3OH can easily form
un-der conditions as cold as 12 K via grain-surface hydrogenation reactions (Watanabe & Kouchi 2002; Fuchs et al. 2009), mak-ing it abundant (∼1–10 per cent of water ice) under prestellar
at University of Leeds on November 15, 2016
http://mnras.oxfordjournals.org/
conditions (Dartois et al. 1999; Gibb et al. 2004; Pontoppidan, van Dishoeck & Dartois2004; ¨Oberg et al.2011). This suggests that methanol is readily available in prestellar environments to provide the key radicals to form larger, more complex organic molecules.
This paper explores the chemical history of the material that enters a protoplanetary disc by tracing the chemical evolution of in-falling parcels of matter along trajectories from the early envelope into the disc. The aim is to gain insight into the evolving chemistry with changing physical conditions along infall paths. Visser et al. (2009a), henceforth referred to asV09, studied the chemical evolu-tion of H2O and CO ices in a similar manner. Their key conclusion
was that large outer regions of the disc contain pristine water, i.e. H2O that has never been sublimated, dissociated, reformed, nor
re-frozen on its path from cloud to disc. A follow-up study, Visser, Doty & van Dishoeck (2011), henceforth referred to asV11, dis-cussed the full gas-phase chemistry. They concluded that comets form from material with different chemical histories. The physical model ofV09andV11is a 2D, semi-analytic simulation and is also the model used in this work. The motivation for 2D physicochem-ical collapse models spawns from the successes of 2D disc models (see e.g. Aikawa & Herbst1999).
Over the years, a number of other codes have also been developed with their own advantages and disadvantages. 1D physicochemi-cal models (e.g. Ceccarelli, Hollenbach & Tielens1996; Garrod, Weaver & Herbst 2008) are not able to treat the vertical struc-ture of the disc realistically, while 3D hydrodynamic simulations including radiative transfer and chemistry are computationally chal-lenging. In fact, this has only been attempted recently up to the first hydrostatic core phase (Furuya et al.2012; Hincelin et al.2013), which is a transient pressure-supported stage with a lifetime of a few thousand years, after the onset of collapse, and prior to the for-mation of a true protostar (Larson1969). The results of this work are explicitly compared to the conclusions drawn by Hincelin et al. (2013) later in this paper, since both works analyse the survival of molecules with individual methods, but up to different stages of evolution.
In recent years, large data sets on ice observations in low-mass protostars have become available from dedicated Spitzer Space Telescopeand ground-based surveys. From these bigger samples,
¨
Oberg et al. (2011) made an inventory of the major ice compo-nents and their variations from source to source. For the case of methanol, variations from 1–25 per cent with respect to H2O
ice are found, but the mean values and their spread are within a factor of 2 of those found in comets. Observational surveys have also been carried out for quiescent clouds prior to star formation (Boogert et al.2011,2013), which have demonstrated that methanol ice is now commonly detected at the level of a few per cent with respect to water ice in cold clouds that have never been heated. Recently, a signpost of active methanol chemistry, the methoxy radical (CH3O), was detected in a cold dark cloud (Cernicharo
et al. 2012). Finally, an intriguing link between interstellar and cometary chemistry is suggested based on other data such as chem-ical complexity and observed isotope fractionations (Mumma & Charnley2011).
This work expands uponV11 by considering the evolution of more complex ices, using a significantly larger and more com-prehensive gas–grain chemical network. The work presented here focuses on methanol to probe the budget of complex organic com-pounds for two different sets of initial physical conditions. The critical steps and processes in the methanol chemistry are also investigated.
The paper is structured as follows. The physical and chemical models and methods employed are described in Section 2. The simulated physical and chemical results are shown in Section 3. Three different infall trajectories per physical scenario are discussed in detail, and the methanol ice budgets and histories for both discs are investigated. The astrophysical implications of the obtained results are addressed in Section 4. Finally, the concluding remarks can be found in Section 5.
2 M O D E L S
2.1 Physical framework
The process of star formation is simulated using the model devel-oped byV09andV11, and further advanced by Visser & Dullemond (2010) and Harsono et al. (2013). This scheme is an axisymmetric 2D, semi-analytic computation of the physical structure throughout the collapse and the disc formation stages. The collapse dynamics in the model are taken from Shu (1977). The effects of rotation are incorporated (Cassen & Moosman1981; Terebey, Shu & Cassen 1984) and evolving outflow cavities are included. Magnetic fields are not considered.
The effects of any accretion shock at the disc surface are not taken into account, following the discussion inV09(section 2.5). Neufeld & Hollenbach (1994) investigated how interstellar dust is processed as it passes through an accretion shock. Vaporization was determined to be the dominant mechanism of ice and grain destruc-tion. They showed that the maximum grain temperature reached depends on the pre-shock velocities and densities. In the models presented here, the highest velocities and densities are reached at the earliest times, when the material accretes close to the protostar. At such positions, all ices would thermally desorb anyhow. Fur-thermore, this material is incorporated into the star before the end of collapse of the system. Sputtering of ices can also occur (Jones et al.1994). The gas and dust that make up the disc experience a shock of at most 10 km s−1, which is not energetic enough to release
strongly bound ices such as H2O and CH3OH. For the grain sizes
assumed here, heating of the dust grains by the stellar UV photons dominates over the accretion shock heating (V09). Thus, the release of weakly bound molecules, like CO, is still treated correctly in the formulation employed here.
With this model, 2D time-dependent density and velocity distri-butions are obtained, with a self-consistent treatment of large-scale physical structures. The evolution of the central overdensity is sim-ulated up to the formation of the first hydrostatic core for 2×10⁴yr
and thereafter treated as a protostar (hereafter, the central overden-sity throughout its evolution will be referred to as the star for sim-plicity). This allows for the determination of the stellar UV radiation field and thus the reaction rates of processes such as photodesorp-tion, photodissociation and photoionization. No external sources of radiation are included in this work since most star-forming regions are deeply embedded and thus shielded from external sources of UV photons. Accretion shocks on to the star, which are believed to be the source of excess UV around T Tauri stars (Bertout, Basri & Bouvier1988), are not considered. The central star thus solely controls the dust temperature, another important parameter for the chemistry. For further details, the reader should refer to the original publications on this model (V09; Visser & Dullemond2010;V11; Harsono et al.2013).
This model is used to simulate the system up to the accretion time,tacc, defined as when the primary accretion phase on to the star
at University of Leeds on November 15, 2016
http://mnras.oxfordjournals.org/
Figure 1. A cartoon depicting the physical components of an embedded phase of star formation, the planet-forming zone and a trajectory of an infalling parcel. Typical gas densities,nH(cm−3), and the dust temperatures, Tdust(K), are also indicated. Figure not to scale (by R. Visser, adapted from Herbst & van Dishoeck2009).
ends and the outer shell of the envelope reaches the protoplanetary disc. This parameter is defined as
tacc=
M0G
m0cs3,
(1)
whereM0is the initial core mass,Gis Newton’s gravitational
con-stant,m0=0.975 is a constant coming from the analytical solution
of the hydrodynamics equations of a collapsing isothermal sphere (Shu1977) andcsis the effective sound speed.
The 3D continuum radiative transfer codeRADMC-3D1 is used
to compute the dust temperature and the shielded stellar radiation in 2D as a function of time based on the output of the collapse model. As a first-order approximation, it is assumed that the gas and dust are coupled, and thus the temperatures of both are equal. This assumption is most likely false for the outflow cavities, because the density is too low for gas–grain collisions to cool the gas efficiently, while the dust can still cool radiatively (Draine1978; Weingartner & Draine2001). The UV radiation calculated withRADMC-3Daccounts
for shielding and scattering by the material located between the star and the point of interest. A gas to dust mass ratio of 100 is assumed. Opacity tables for icy grains from Crapsi et al. (2008) are used. In this work, opacities for bare grains, dependent upon the dust temperature, are not incorporated. This is expected to cause temperature variations of at most∼10 K around the∼100 K zones, which is where the dominant ice component, H2O ice, is sublimated
for both the midplane and the surface layers of a disc (McClure, private communication).
The collapse model computes trajectories of parcels of gas and dust as they fall in towards the star and into the protoplanetary disc, as illustrated in Fig.1. Using the time-dependent velocity distribution, it is possible to follow material along infall streamlines. Each parcel’s temporal and spatial coordinates can then be coupled to the corresponding values for physical parameters, such as density, dust temperature and stellar radiation, to which the parcels are
[image:3.595.322.538.73.159.2]1http://www.ita.uni-heidelberg.de/∼dullemond/software/radmc-3d/
Table 1. Initial physical conditionsa.
Disc case Spread-dominatedb Infall-dominatedc
0 (s−1) 10−14 10−13
cs (km s−1) 0.26 0.26
M0 (M) 1.0 1.0
tacc (yr) 2.46×10⁵ 2.46×10⁵
Md (M) 0.11 0.44
Rout (au) 51 294
Note:a0: solid-body rotation rate;cs: effective sound speed;M0: initial core mass;tacc: accretion time;Md: disc mass attacc;Rout: outer disc radius attacc.
bCase 3 fromV09. cCase 7 fromV09.
exposed. With a sample of trajectories it is thus possible to trace the physical and chemical histories of various regions in the envelope and the protoplanetary disc. The motion of a large number of parcels from early to late times is shown in fig. 7 ofV09.
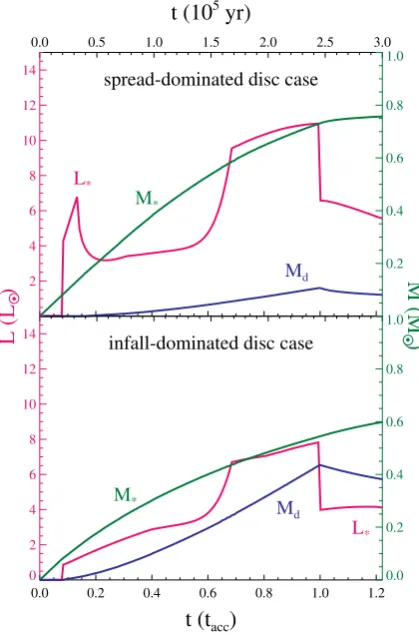
The initial physical conditions control the subsequent evolution of the system. Here, two sets of initial parameters are considered, based on cases 3 and 7 fromV09, respectively, termed ‘spread-dominated’ and ‘infall-dominated’, and summarized in Table1. Fig.2shows se-lect physical properties of the two scenarios. The two cases studied differ in the solid-body rotation rate,0, by an order of magnitude.
Sincetaccis independent of0,taccis equal for the two cases under
Figure 2. The time evolution of physical properties for the two cases stud-ied. Each panel shows its respective evolution of stellar luminosity,L∗(L), stellar mass,M∗(M), and disc mass,Md(M). The top panel displays the data for the spread-dominated disc case, i.e. case 3 fromV09. The bottom panel corresponds to the infall-dominated disc case, i.e. case 7 fromV09.
at University of Leeds on November 15, 2016
http://mnras.oxfordjournals.org/
[image:3.595.323.533.358.676.2]consideration in this work, at a value of 2.46×10⁵yr (Table1).
A slower solid-body rotation rate implies that more envelope ma-terial will be incorporated into the star and the disc will be less massive. Furthermore, since most of the material is used to build up the star, viscous spreading is the dominant mechanism of disc growth. As a result, the star formed in the spread-dominated disc case (case 3 fromV09) is of higher mass and more luminous than that of the infall-dominated disc case (case 7 fromV09), as shown in Fig.2.
On the other hand, the disc formed in the infall-dominated case is more massive than that formed in the spread-dominated case. The sizes of the discs vary by a factor of∼4 attaccand the dominant
motions that build the discs are not the same, which is reflected by the disc radial velocity profiles. This affects the trajectories of incoming parcels and the chemistry along them. For case 3 from V09, which was also central toV11, the disc has an outer radius of 51 au and mainly grows by viscous spreading, thus termed ‘spread-dominated’. For case 7 fromV09, the disc has an outer radius of 294 au and primarily grows by the accretion of more envelope material on to it, thus termed ‘infall-dominated’. Due to the modifications betweenV09andV11, the modelled protoplanetary disc sizes have decreased significantly (a factor 2–3 difference in the outer disc radii for reasons explained in detail in Visser & Dullemond2010 and Harsono et al.2013). Due to the modifications in the model, it became necessary to modify the equation for the outflow cavity wall to
z=0.98
t tacc
−3
R1.5,
whereRandzare cylindrical coordinates in au. The full opening angle in our situation attacc is 11◦.58 atz=1000 au and 5◦.39 at
z=10 000 au, both of which are approximately a factor 3 smaller than that inV11.
In this work, the embedded phase of low-mass star formation is modelled, that is while the remnant envelope is still present. Few observations of such early discs are available, which makes it hard to constrain their dimensions. For example, the Keplerian disc in L1527 has been estimated to have an outer radius of∼125 au (Tobin et al.2012,2013; Sakai et al.2014). The set of Keplerian discs discussed in Harsono et al. (2014) have outer radii in the
∼50–310 au range and masses varying from several thousandths to several tenths M. By considering two different cases in this work with disc parameters in these ranges, future measurements are anticipated for confirmation.
2.2 Chemical network
The physical model described above yields trajectories that trace streamlines of material infalling from the envelope into the pro-toplanetary disc. For simplicity, the chemical calculations are per-formed independently from the physical computations. The physi-cal conditions (density, dust temperature, radiation field) at various time steps along the trajectories are used as input for the chemi-cal code, which computes chemichemi-cal abundances at each step. The procedure yields chemical abundances as a function of physical evo-lution for parcels probing various regions in the envelope and the protoplanetary disc, and is pictorially summarized in fig. 1 inV11. The chemical model contains 666 species and 8759 reactions. The gas-phase network is the RATE12 release of the UMIST Database for
Astrochemsitry2(McElroy et al.2013). The network accounts for
2http://www.udfa.net
gas-phase two-body reactions. Three-body reactions are not con-sidered, as they only become important at densities higher than
∼1010cm−3, which are only attained briefly at the latest time steps
in the evolution. Photoreactions (photoionization and photodissoci-ation) by stellar and cosmic ray-induced UV photons (generated by the cosmic ray excitation of H2, taken to be 104photons cm−2s−1),
and direct cosmic ray ionization (with a rate of 5.0×10⁻¹⁷s−1)
for gas-phase species, are also included in RATE12. Photoreactions are computed according to equation 2 fromV11, which takes the evolving stellar temperature into account. Self- and mutual shield-ing are taken into account for H2, CO and N2based on recent work
(Visser, van Dishoeck & Black2009b; Li et al.2013). Grain–cation recombination is also included.
The model is supplemented with gas–grain interactions and grain-surface chemistry (and several additional reactions for complex or-ganic molecules) extracted from the Ohio State University (OSU) network3(Garrod et al.2008) and are calculated according to the
de-tailed description in Walsh et al. (2014b) and the references therein. The chemistry is described by a two-phase model, i.e. gaseous and solid phases solely: that is, the ice surface and bulk are not treated as distinct phases. The rate equation approach is adopted for grain-surface reactions, based on Hasegawa, Herbst & Leung (1992) and Hasegawa & Herbst (1993). If one of the reactants is either an H or a He atom, then quantum tunnelling is allowed through the ac-tivation energy for a reaction and through diffusion barriers on the grains (Cazaux & Tielens2004; Watanabe et al.2010). For all other species, only classical hopping is permitted. The relation between the diffusion barrier (Ediff) and the binding energy of a molecule
to the surface (Edes, which is also sometimes called the desorption
energy) is taken to beEdiff=0.3×Edes. The set of binding
ener-gies compiled for use in conjunction with RATE12 is used with the exception of water ice. A higher value of 5773 K from Fraser et al. (2001) for pure water ice is adopted instead.
The gas–grain interactions included are adsorption on to grain surfaces (also known as freeze-out) and thermal desorption (Hasegawa et al.1992; Hasegawa & Herbst1993). Ices can also desorb non-thermally. Photodesorption (either by stellar or cosmic ray-induced UV photons), cosmic ray-induced thermal desorption (via heating of grains) and reactive desorption are all taken into account. The most recent experimental values for the photodesorp-tion yields are adopted for the photodesorpphotodesorp-tion rates ( ¨Oberg, van Dishoeck & Linnartz2009a; ¨Oberg et al.2009c). Furthermore, a coverage factor is used in light of recent experiments, which sug-gest that photodesorption occurs only from the top two monolayers (Bertin et al.2012). The efficiency of reactive desorption is set to 1 per cent (Garrod, Wakelam & Herbst2007; Vasyunin & Herbst 2013), but the efficiency of this process is not yet constrained by experiments and is likely variable, dependent on the reaction and the substrate (see e.g. Dulieu et al.2013).
Finally, grain-surface photoionization and photodissociation by stellar and cosmic ray-induced UV photons are included. As a first-order approximation, the equivalent rates for the gas phase are used. This is likely overestimating the grain-surface photodissociation rates, since the mechanisms for UV photodissociation and photodes-orption of ices are now understood to be related as demonstrated in molecular dynamics studies (Andersson et al.2006; Andersson & van Dishoeck2008; Arasa et al.2010,2011,2013; Koning, Kroes & Arasa2013) and experimental work (Bertin et al.2012; Fayolle et al. 2013).
3http://www.physics.ohio-state.edu/∼eric/research.html
at University of Leeds on November 15, 2016
http://mnras.oxfordjournals.org/
Table 2. The precollapse physical and chemical conditionsa.
nH(cm−3) 4×10⁴
Tdust(K) 10
[image:5.595.323.536.102.469.2]FUV(erg cm−2s−1) 0 n(H)/nH 5.0×10⁻⁵ n(H2)/nH 5.0×10⁻¹ n(He)/nH 9.8×10⁻² n(C)/nH 1.4×10⁻⁴ n(N)/nH 7.5×10⁻⁵ n(O)/nH 3.2×10⁻⁴ Note: aInitial abundances of F, Na, Mg, Si, P, S, Cl and Fe are all in the 10−8–10−9range relative tonH, see table 3 of McElroy et al. (2013) and the references therein.
Table 3. Select molecular abundances at the end of the precollapse phase of 3×10⁵yr and their binding energies.
Species n(Xgas)/nH n(Xice)/nH Edes(X) (K) H2 5.0×10⁻¹ 9.0×10⁻⁷ 430a CO 3.7×10⁻⁵ 8.2×10⁻⁵ 1150a H2O 5.1×10⁻⁸ 1.8×10⁻⁴ 5773b H2CO 7.8×10⁻⁹ 6.9×10⁻⁶ 2050a CH3OH 8.3×10⁻¹¹ 8.0×10⁻⁷ 4930c
Note:aGarrod & Herbst (2006) – estimate. bFraser et al. (2001) – measurement for pure ice. cBrown & Bolina (2007) – measurement for pure ice.
The grains are assumed to have a radius of 0.1µm and n(grains)/nH = 2.2 × 10⁻¹², where by definition
nH = n(H)+ 2× n(H2). The density of grain surface sites is
1.5×1015cm−2and the barrier thickness for quantum tunnelling
between grain surface sites is taken to be 1 Å, assuming a rectangu-lar barrier (Hasegawa et al.1992).
Prior to running the chemical model on a set of trajectories, it is necessary to obtain the initial chemical conditions at the onset of collapse. Assuming that the precollapse conditions are identical for the entire 2D plane, the precollapse phase for a single point is simulated at constant physical conditions for 3×10⁵yr. The
prec-ollapse physical and chemical conditions are tabulated in Table2. The chemical abundances obtained at the end of the precollapse phase are used as initial chemical abundances for the trajectories. For reference, Table3tabulates select molecular abundances at the end of the precollapse phase with their respective binding energies.
2.3 Methanol chemistry
The key chemical reactions involving CH3OH are summarized in
Fig.3. Early models suggested that methanol could form in the gas phase via ion–molecule reactions under dark cloud conditions (Millar & Nejad1985; Herbst & Leung1986). This is thought to be a two-step process invoking initially radiative association (Blake et al.1987; Luca, Voulot & Gerlich2002), followed by dissocia-tive recombination (Geppert et al.2006). However, it was quickly suspected that this formation route is inefficient at low tempera-tures (Millar, Leung & Herbst1987). Later it was experimentally shown that, although fast, only 3 per cent of the product channels of dissociative recombination lead to methanol (Geppert et al.2006). Moreover, radiative association has to compete with other ion–
Figure 3. A schematic chemical network for methanol, summarizing the key reactions and processes at low temperatures (Tdust100 K). In the illustration,hνcorresponds to the energy of a photon, CR stands for a cosmic ray, g. s. – for grain surface, g. s. reform. – for grain-surface reformation andTdesis the desorption temperature.
molecule processes that have much larger rate coefficients resulting in too low gas-phase production of CH3OH to explain dark cloud
observations (Garrod et al.2006).
Currently, it is accepted that at low dust temperatures (<100 K and when external UV is negligible), grain-surface chemistry is responsible for the production of methanol via the sequential hy-drogenation of CO:
CO→H HCO→H H2CO H
→H3CO/H2COH H
→CH3OH,
as first proposed by Tielens & Hagen (1982). This mechanism has been extensively studied experimentally by various groups (Hi-raoka et al.2002; Watanabe & Kouchi2002; Hidaka et al.2004; Watanabe et al.2004) and confirmed for 12 K≤Tdust≤20 K (Fuchs
et al.2009). The second and fourth steps in the above mechanism are barrierless, because the H atoms are reacting with radicals. CO and H2CO do not have unpaired valence electrons, thus the
ad-ditions of H atoms are endothermic reactions. A reaction barrier
at University of Leeds on November 15, 2016
http://mnras.oxfordjournals.org/
[image:5.595.78.255.277.352.2]of EA= 2500 K for step one and for both routes (leading to
ei-ther methoxy or hydromethoxy) of step three is adopted (Ruffle & Herbst2001; Woon2002; Garrod & Herbst2006). This forma-tion route is possible for dust temperatures as low as 10 K, because quantum tunnelling allows the H atom to overcome this ‘large’ bar-rier (Cuppen & Herbst2007). These processes are also reflected in the temperature-dependent ‘effective’ reaction barrier measured in the laboratory, which are of the order of ∼400–500 K (Fuchs et al.2009), i.e. much lower than the theoretical value of 2500 K. Above∼20 K, the parent CO molecule sublimates from the grains and the residence time of the H atom on grain surfaces is too short for this reaction sequence to occur efficiently. As a result, methanol production significantly slows.
Similar to water and carbon monoxide, methanol can undergo thermal and non-thermal desorption, as shown in laboratory exper-iments. This work assumesEdes =4930 K for CH3OH, as stated
in Table 3, which is the value measured for pure methanol ice (Brown & Bolina2007). At low temperatures (Tdust100 K),
ther-mal desorption is inefficient for methanol; therefore, under prestel-lar conditions it can only desorb non-thermally from the grains. Under dark conditions non-thermal desorption is sparked by the absorption of UV photons generated by the cosmic ray excitation of H2molecules. Weakly bound molecules like CO (see Table3) are
thought to be thermally desorbed due to the cosmic ray heating of dust grains (at temperatures lower than their respective desorption temperatures). However, CH3OH is a strongly bound species and its
primary mechanism of coming off the grains is cosmic ray-induced photodesorption (Hasegawa et al.1992; Shen et al.2004; Roberts et al.2007).
Currently, the chemical network includes the gas phase and, in turn, the grain-surface photodissociation rates from RATE12. It is
the photodissociation products of CH3OH ice that are thought to
pave the way to more complex species, such as glycolaldehyde and methyl formate, making this process and its parameters crucial for the chemistry. The photodissociation pathways of CH3OH are
CH3OH+hν→CH3+OH,
CH3OH+hν→CH2OH+H,
CH3OH+hν→CH3O+H,
as investigated by Garrod & Herbst (2006), ¨Oberg et al. (2009b) and Laas et al. (2011). These studies have analysed how the chemistry of methyl (CH3), hydromethoxy (CH2OH) and methoxy (CH3O)
radi-cals leads to complex species. In this work, the ‘standard’ branching ratios are adopted, namely 60 : 20 : 20 per cent for the reactions in the order given above (table 1 in Laas et al.2011). The exploration of the dependence of the formation of complex organics on the branching ratios in this model is a topic of upcoming work.
2.4 Caveats
Certain crucial chemical parameters affect the key chemical pro-cesses that govern the methanol abundance under different physical conditions. The first key aspect is the availability of reactant species (H, CO, HCO, H2CO, CH3O, CH2OH) on the grains, which is
de-termined by their binding energies. Methanol can only be formed if those species are present on the grains, and a change in the binding energies can influence the dominance of thermal and non-thermal desorption mechanisms. Secondly, these species need to be mobile
in order to meet and react. The relation betweenEdiffandEdesis
cru-cial here. In this work, a factor of 0.3 is used (Hasegawa et al.1992), but other values also appear in the literature, e.g. 0.5 in Garrod & Herbst (2006). Hence, the mobility of individual species is related to the binding energy. Under cold conditions (Tdust20 K), greater
mobility could enhance the amount of methanol formed. However, under warmer conditions (20K Tdust 100 K), the amount of
methanol formed could be reduced if the photoproducts efficiently diffuse to form other species, rather than recombine immediately. This means that values ofEdesfor the photoproducts (CH3, CH3O,
CH2OH, OH) of methanol also need to be constrained. Thirdly, the
efficiencies of the first and third hydrogenation steps en route to CH3OH, set by the value ofEA, affect its production. The large
difference between the theoretical and experimental (‘effective’) values has been pointed out in the previous section, and it is not clear how to treat this properly in models. Finally, the binding energy of methanol itself determines where it survives upon formation.
There are also two physical parameters that can have profound significance for the chemistry of methanol. The first one is the assumed dust model. Different values for the grain radius, the num-ber density, the numnum-ber of surface sites and the quantum barrier heights can affect adsorption rates of species on to the grains and the grain-surface diffusion rates (Hasegawa et al.1992). Currently, the dust grains are assumed to consist of compact spheres that are well-mixed with the gas. Aspects such as settling and dust coag-ulation have not been accounted for; however, they may be very important for adsorption and grain-surface associations due to the reduction of the grain surface area available for freeze-out and in-creased shielding from UV irradiation in the midplane (Aikawa & Nomura2006; Fogel et al.2011; Vasyunin et al.2011; Akimkin et al.2013). The other important physical parameter is the assumed ice model. Currently, frozen-out species are considered as a single entity, while it is known that ices are actually layered and that the mantle and the surface monolayers have different chemistry (see e.g. Ehrenfreund et al.1998; Taquet, Ceccarelli & Kahane2012). For example, in clouds water freezes out first, followed by CO at later times. Methanol ice is thus expected to be sequestered and associated with CO rather than water ice (Boogert et al.2011). Fur-thermore, accounting for the ice composition and structure would affect all of the chemical parameters mentioned above.
3 R E S U LT S
In this work, there are two discs with different dominant disc growth mechanisms, one that is spread dominated and another that is infall dominated. In Section 3.1, the physical evolution for these two cases is presented. In Section 3.2, the chemical evolution is analysed. In each scenario, three trajectories entering the disc are studied in detail. Each disc has two trajectories with different methanol ice behaviours that are common to both cases, and one trajectory that is unique to its scenario. Finally, the methanol ice budget and history are presented for both cases at∼taccin Section 3.3.
3.1 Physical evolution
3.1.1 Spread-dominated disc case
The top panel of Fig.4shows the physical structure at the end of the simulation, at∼tacc, for the spread-dominated case. The star is at
the origin and is surrounded by a protoplanetary disc with midplane densities of∼1012cm−3at 8 au. The outflow cavities are identified
as the regions wherenH<104cm−3. The remnant envelope has
at University of Leeds on November 15, 2016
http://mnras.oxfordjournals.org/
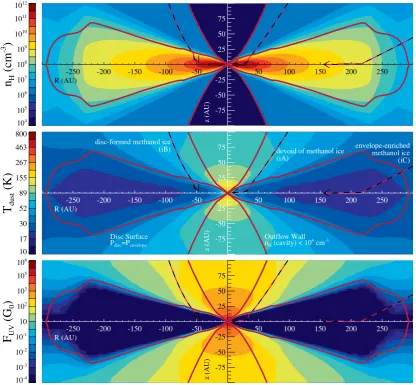
Figure 4. For the spread-dominated disc case from top to bottom: the gas density,nH(cm−3), the dust temperature,Tdust(K), and the combined field of the shielded stellar radiation and the cosmic ray-induced UV field,FUV(G0). All these panels are at∼taccfor the spread-dominated disc case. The disc surface and the outflow walls are labelled. Furthermore, three infall trajectories are depicted with black and pink lines as they move inwards from the far-out envelope att=0 to the protoplanetary disc bytacc.
densities in the∼106–1010cm−3range. The disc surface is defined
along the points where the envelope and disc pressures are equal, Penvelope=Pdisc(Visser & Dullemond2010).
The middle panel of Fig.4shows the dust temperature at the same time step for the spread-dominated disc case, as computed withRADMC-3D(Section 2.1). The highest temperatures are found
within the outflow cavities, since this is where the density is low-est, and it is thus easier for the radiation to permeate and heat the dust. The central temperature (inner 0.1 au) exceeds 850 K, while the midplane of the protoplanetary disc remains in the∼40– 70 K range depending on the radial distance from the star. Within 5 au, the dust temperatures in the disc exceed 100 K. The envelope temperature varies in the∼20–110 K range on larger scales and increases with proximity to the star. Due to the fact that the disc is only 51 au in radial size, it is easily heated passively by reprocessed stellar radiation and, consequently, is fairly warm (above 40 K) in its entirety.
The bottom panel of Fig.4shows the total strength of the far-UV (FUV) 912–2066 Å (6–13.6 eV) flux, which has contributions from
the shielded stellar radiation field and the cosmic ray-induced UV field, at the same time step for the spread-dominated disc case. The strength of the interstellar UV radiation field,G0, is 1.6×10⁻³erg
cm−2s−1(Habing1968). The envelope regions closest to the
out-flow walls are subjected to a UV radiation field that is 1–100 times stronger than the interstellar field and the outflow cavities are ex-posed to even stronger radiation (>100G0). The protoplanetary disc
remains fully shielded from the stellar radiation (AV 10 mag).
Other regions are subject to weak UV irradiation, below the in-terstellar value. All zones of the system, even the midplane of the disc, are subject to a weak, but constant, cosmic ray-induced UV radiation, which is assumed to be the typical∼10−7erg cm−2s−1
(Prasad & Tarafdar1983).
All panels of Fig.4depict three infall trajectories with black and pink lines as they move inwards from the far-out envelope att=0 and into the protoplanetary disc bytacc. These three trajectories
are representative of the key methanol ice behaviours encountered in the spread-dominated disc case and are labelled accordingly. This is further elaborated upon in Section 3.2. Table 4lists the
at University of Leeds on November 15, 2016
http://mnras.oxfordjournals.org/
Table 4. Final parcel positions (attacc).
Case Label Parcel behaviour R(au) z(au)
Spread-dominated disc sA Devoid of CH3OHice 3.4 0.55
sB Readsorbed prestellar CH3OHice 21.6 0.89
sC Envelope-enriched CH3OHice 49.4 1.44
Infall-dominated disc iA Devoid of CH3OHice 1.3 0.03
iB Disc-formed CH3OHice 46.4 3.75
iC Envelope-enriched CH3OHice 155.3 0.06
final positions of the three parcels attacc, which are all within the
protoplanetary disc. This disc grows primarily by viscous spreading, as reflected in the outward motion for two of the three trajectories after they enter the disc. A total of 250 trajectories were calculated for the spread-dominated disc case, sampling the full spatial extent of the disc at tacc, and most of them embark on an outward path
upon disc entry.
3.1.2 Infall-dominated disc case
The physical parameters for the infall-dominated disc case vary from those for the spread-dominated case presented previously. The top panel of Fig.5shows the density distribution at∼taccfor
the infall-dominated disc case (on a much larger spatial scale than in Fig.4due to the difference in disc sizes). The midplane densities of this much larger disc vary from∼1011 cm−3within the inner
30 au to∼108cm−3beyond 250 au. The outflow cavities are again
low-density zones of<104cm−3. Note that the outflow cavities
appear to be of different sizes between Fig.4and Fig.5only due to the difference in scales on the two figures. For this case, the remnant envelope is of a lower density,∼105cm−3, which peaks at
∼108cm−3close to the disc boundary.
The middle panel of Fig.5displays the dust temperature at the same time step for the infall-dominated disc case. Overall this sys-tem is colder than the spread-dominated disc case, which correlates with this being a less massive star, and the disc being larger in size and mass. The disc has a large outer zone (70 au) that is at
∼20 K. The temperature exceeds 100 K only within 5 au, similar to the spread-dominated case, despite this disc having lower tempera-tures otherwise. The remnant envelope is generally cool and a dust temperature of∼100 K is exceeded only within∼30 au inRandz. The outflow cavities are again the hottest regions with temperatures >150 K close to the star (z <23 au) and a central peak temperature (inner 0.1 au) of just under 800 K.
The bottom panel of Fig.5portrays the total strength of the FUV flux at the same time step for the infall-dominated disc case. The outflow cavities are subject to the strongest radiation,>1000G0
Figure 5. As Fig.4, but for the infall-dominated disc case.
at University of Leeds on November 15, 2016
http://mnras.oxfordjournals.org/
[image:8.595.87.504.331.716.2]withinz∼60 au. The disc remains shielded from the stellar UV flux and again subject only to the cosmic ray-induced UV photon flux. However, in this case, a small disc surface layer exists, im-mediately below the labelled disc surface, that encounters UV flux at the interstellar level. Furthermore, larger regions of the envelope experience a UV flux∼10G0. Both effects are a consequence of
the lower densities along the line of sight between the star and the remnant envelope (as seen in the top panel of Fig.5). Additionally, this disc has a larger geometrical height due to its larger mass.
All panels of Fig.5show three infall trajectories that are rep-resentative of the dominant methanol ice behaviours encountered for the infall-dominated disc case and are labelled as such. This is further discussed in Section 3.2. Table4lists the final positions of these parcels attacc. This disc grows primarily by infall of matter as
opposed to viscous spreading. Hence, none of the three trajectories have an outward component, and viscous spreading is observed only for a handful of parcels from the other 250 trajectories calculated for this case.
3.2 Chemical evolution
During the precollapse phase, CO forms via ion–molecule chem-istry, reaching a peak canonical gas-phase abundance of∼10−4
relative tonH. (All abundances discussed hereafter are relative to
nH unless stated otherwise.) CO subsequently adsorbs on to the
grains on a time-scale of∼105yr. Upon CO freeze-out, CH 3OH
is efficiently formed on the grains from CO via sequential hydro-genation, as discussed in Section 2.3 (Tielens & Hagen1982). This persists for 3×10⁵yr, the duration of the precollapse phase in
the simulation. At the onset of collapse, the modelled methanol ice abundance is 8.0×10⁻⁷, corresponding to 0.44 per cent of water
ice, which is consistent with observations of quiescent clouds with-out star formation (Boogert et al.2013). Photodesorption by cosmic ray-induced UV photons strips some of the ice from the dust grains, yielding a gas-phase methanol abundance of 8.3×10⁻¹¹, which
is in agreement with∼10−10from Garrod & Herbst (2006) and on
the lower end of observed values∼10−8–10−9(Friberg et al.1988;
G´omez et al.2011). Although, extraction of gas-phase abundances from observations remains challenging and needs to be approached cautiously.
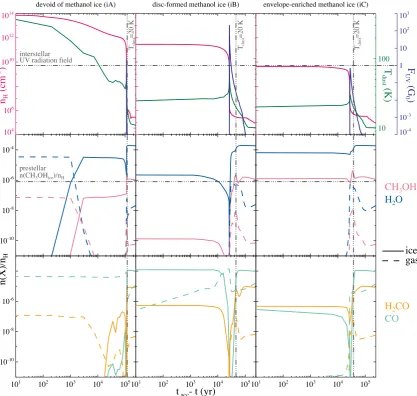
The precollapse abundances obtained are used as the initial con-ditions for the computation of the chemical evolution along infall trajectories. Fig.6shows select molecular abundances for the three parcels introduced in the previous sections for the spread-dominated disc case and Fig.7shows the same for the infall-dominated disc case. The figures should be read from right to left along the ab-scissa, which corresponds to decreasing time steps from early to late times. All six parcels start out with the same precollapse methanol abundance. As they undergo infall, the physical evolution they ex-perience varies, which includes radically different temperatures, FUV fluxes and densities. These physical parameters are crucial for the chemistry and, as a result, the parcels obtain unique molecular abundance profiles. The figures should be analysed with the key reactions and processes, as depicted in the network in Fig.3, in mind. The time-scales of various processes are also of importance. For example, thermal desorption is very fast (of the order of 103yr
fornH∼ 1012 cm−3, Tdust ∼ 150 K), while methanol ice
grain-surface formation is slow (of the order of 105yr forn
H∼104cm−3,
Tdust∼10 K). Besides methanol, Figs6and7shows the abundance
of CO, H2O and formaldehyde (H2CO) for reference. Next, the
chemical evolution is discussed for each characteristic methanol ice behaviour encountered.
3.2.1 Enrichment of methanol ice
For the spread-dominated disc case, the parcel with envelope-enriched methanol ice is depicted in the right-hand column of Fig.6and labelled sC. It encounters densities in the 2.1×10⁵–
7.1×1010cm−3range along its infall path with a steep jump of
several orders of magnitude around 105yr before the end of the
simulation, which corresponds to the parcel’s entry into the disc. The temperature varies from 10 K to its maximum value of 54 K, followed by a decrease to 40 K. The UV radiation encountered by the parcel briefly spikes up to a maximum of 2.6×10⁻³G
0. The
temperature and the UV flux peak around the density peak, because immediately prior to disc entry is also where the parcel is closest to the star sans the shielding effects of the disc. Similar spikes in the physical parameters occur for all of the parcels considered, how-ever at different times depending on when they enter the disc. After the disc entry, parcel sC remains inside the warm and heavily UV shielded disc, while moving outwards as the disc spreads viscously (Fig.4).
Prior to the temperature reaching 20 K, methanol ice continues to be formed efficiently on the grains via sequential hydrogenation of CO, which explains the initial rise in the methanol ice abundance. This occurs while the parcel is still infalling through the envelope; therefore, the methanol in parcel sC is envelope enriched. Once the temperature surpasses 20 K, CO thermally desorbs off the grains and the formation of methanol slows down. Soon thereafter the temper-ature increases further; however, it remains well below 100 K, so methanol does not thermally desorb along this trajectory. The UV flux is also briefly elevated; however, since its peak value is approx-imately four orders of magnitude lower than the interstellar value, neither photodesorption nor photodissociation remove significant amounts of methanol ice from the grains.
Upon disc entry, the rapid and large density increase to
∼1010 cm−3leads to the adsorption of gaseous methanol, which
is reflected by a bump in the solid methanol abundance profile. The bump is levelled within∼104 yr by the cosmic ray-induced
UV photons. Thereafter, the methanol ice abundance is preserved at the envelope-enriched level along the parcel’s path through the disc. This is because the disc zones that the parcel encounters are all at temperatures below the desorption temperature of methanol and above the desorption temperature of CO. Furthermore, little stellar UV penetrates the disc. As a result, inefficient non-thermal destruction by the cosmic ray-induced UV photons balances the slow formation of methanol ice via the OH and CH3route (whose
abundance is very low due to the absence of stellar UV photons), the photodissociation (by the cosmic ray-induced UV photons) of more complex species into CH3OH and adsorption.
For the infall-dominated disc case the parcel with envelope-enriched methanol ice is depicted in the right-hand column of Fig.7 and is labelled iC. The density for this parcel is in the 9.5×10⁴–
4.3×109cm−3range. The temperature increases from 10 K to a
peak value of 31 K, then decreases to 20 K. The UV flux peaks at a value of 0.7G0. This parcel encounters the lowest densities and
temperatures, as it enters the outermost disc region considered (see e.g. Figs4and5).
The methanol ice profile of this parcel is very similar to that of parcel sC. In fact, the same processes are at play here. That is also the reason for this parcel being the envelope-enriched methanol ice analogue for the infall-dominated disc case, although the parcel mo-tion is very different. However, there is one key difference between parcels iC and sC, namely that for parcel iC the temperature drops below the desorption temperature of CO towards its final position.
at University of Leeds on November 15, 2016
http://mnras.oxfordjournals.org/
Figure 6. Physical conditions and molecular abundances as a function of time for the three parcels for the spread-dominated disc case. The figures should be read from right to left along the abscissa, which corresponds to going from early to late times. In the top three panels, the pink curves are the gas densities,nH (cm−3), the green curves are the dust temperatures,T
dust(K), and the dark blue curves are the combined fields of the shielded stellar radiation and the cosmic ray-induced UV field,FUV(G0). The level of the interstellar UV radiation field is labelled, as are the points at which theTdust=20 K limit is surpassed, where CO ice desorbs. The lower six panels display the chemical abundances relative tonH(see text). The colours correspond to different species, solid lines are used for the solid phase and dashed line for the gas phase. The initial prestellar methanol ice abundance is labelled as well. The centre middle panel includes a blow-up of the critical transition region.
Once CO is again frozen out on the grains, methanol formation can occur. This is not seen here, because the simulation only runs for approximately another 104yr upon the readsorption of CO, which
is not long enough for the grain-surface chemistry to produce a significant amount of methanol. In other words, parcels enter the outer disc later in the evolution and do not have enough time to form methanol within the disc.
3.2.2 Destruction of methanol ice
The left-hand column of Fig.6depicts the parcel that is devoid of methanol ice for the spread-dominated disc case and labelled sA. It undergoes an increase in density in the 6.9×10⁴–1.0×1013cm−3
range with a spike that coincides with a brief strong burst of UV radiation with a maximum value of 901G0. The temperature again
peaks prior to disc entry, but keeps rising to reach its maximum value of 161 K at its final position. This is explained by the parcel’s
motion in the disc, which is inwards in its entirety for all times, which, in turn, is a result of this parcel entering the disc within 10 au.
While the temperature is below 20 K, more methanol is formed as was the case for parcels sC and iC with envelope-enriched methanol ice. However, this parcel approaches the star much closer than the previous parcels and the temperature prior to disc entry peaks at 130 K. Methanol ice is thereby rapidly removed by thermal des-orption. Furthermore, the UV flux exceeds the interstellar value causing, not only photodesorption of methanol ice, but also pho-todissociation of both solid and gaseous methanol. This explains why the gas-phase methanol is also destroyed prior to disc entry. Once in the disc, the temperatures remain too high for any methanol to form. This parcel is devoid of not only methanol ice, but also of methanol gas.
The left-hand column of Fig.7illustrates a parcel that is devoid of methanol ice for the infall-dominated disc case and labelled iA.
at University of Leeds on November 15, 2016
http://mnras.oxfordjournals.org/
Figure 7. As Fig.6, but for the infall-dominated disc case.
The densities are in the 2.3×10⁵–7.7×1013cm−3range. The
tem-perature, although containing certain spikes, tends to increase from 10 K to higher values with the final point attaining the maximum of 444 K. The UV spikes with a peak value of 2.5G0.
This parcel is similar to parcel sA in the sense that they both have no solid methanol left at their final positions. However for parcel sA, thermal desorption, photodesorption and photodissociation en-sured the destruction of methanol ice. Gaseous methanol was also photodissociated at the same time. In parcel iA, methanol ice un-dergoes pure thermal desorption, since the disc fully shields from stellar UV. As a result, gaseous methanol survives in the inner disc at the abundance level close to that of prestellar methanol ice.
3.2.3 Readsorption of prestellar methanol ice
The parcel containing readsorbed prestellar methanol ice is depicted in the middle column of Fig.6and labelled sB. It is unique to the spread-dominated disc case. The density curve lies in the 8.4×10⁵–
1.8×1012cm−3range. The temperature similarly rapidly spikes
from 10 to 151 K, then gradually decreases to 59 K. This parcel enters the disc earlier than parcel sC and also far away from the star
(R>25 au for both). This ensures that the UV flux remains at the cosmic ray-induced level at all times. Contrary to the path of parcel sC, which initiates outward motion upon entry into the disc, this parcel first continues to move inwards, encountering high temper-atures within the inner disc (10 au), while staying fully shielded from stellar UV, to only later embark on an outward journey.
Parcel sB spends little time below 20 K due to its early disc entry. As a result, CO does not stay on the grains sufficiently long for any significant amount of additional methanol to be formed. The prestellar methanol is carried straight into the disc. However, once the parcel enters disc zones with temperatures higher than 100 K, rapid thermal desorption of methanol occurs and all the ice is released into the gas. Once the parcel migrates outwards and the temperature drops again, methanol rapidly adsorbs on to the grains due to the high densities. The methanol molecules are still of prestellar origins hereafter; however, the abundance is lower than the initial prestellar value. This is due to the fact that some methanol was destroyed while it was in the gas phase in the hot inner zones of the disc. The readsorbed prestellar methanol ice is preserved towards the final position of this parcel for the same reasons as it was preserved in parcel sC.
at University of Leeds on November 15, 2016
http://mnras.oxfordjournals.org/
3.2.4 Disc formation of methanol ice
The middle column of Fig. 7 depicts the parcel that contains disc-formed methanol ice and labelled iB. It is unique to the infall-dominated disc case. The densities lie in the 9.3 × 10⁴–
2.9×1011cm−3range. The temperatures rise from 10 K to a peak
value of 73 K, then decrease down to 24 K. The UV flux briefly spikes at 215G0.
Initially, the methanol profile is similar to that seen for parcels sC and iC that contain envelope-enriched methanol ice; however, before the disc entry the UV flux is two orders of magnitude higher for this parcel. As a result, methanol gas is rapidly photodissociated. Methanol ice undergoes photodesorption, but most importantly also more frequent photodissociation. At the point of this strong UV spike, the temperature rises to 73 K; therefore, once a methanol ice molecule dissociates, it is much more likely that the photofragments thermally desorb off the grains rather than recombine. This leads to the rapid destruction of methanol ice, which is seen in the figure as a deep dip in the solid methanol abundance. The exact depth of the dip depends on the combination of the UV flux and the temperature. Once the parcel enters the disc, it is fully shielded from the stellar UV photons and the temperature decreases. In fact, the temperature drops to the level of∼20 K and CO once again freezes out on to the grains. This in turn allows methanol formation via sequential hydrogenation of CO, but now within the disc. Due to the short time of∼104yr, the increase in methanol ice seen in the figure is slow
and at a low abundance. The methanol ice found at the final position of this parcel is, in fact, partially disc-formed methanol ice.
3.3 Methanol ice in discs
3.3.1 Methanol ice budget
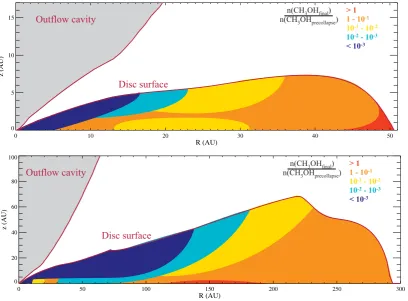
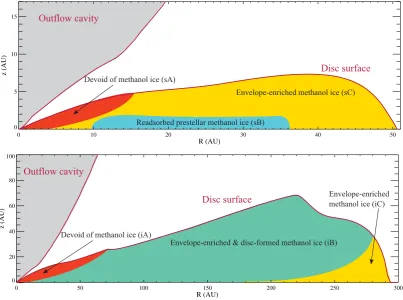
To sample the two discs studied, around 250 trajectories per case were computed. From this information, approximate zones can be delineated in the discs based on the amount of methanol ice that they contain. This is done by means of schematics in the top panel for the spread-dominated disc case and in the bottom panel for the infall-dominated disc case in Fig.8. The zones are coloured depending on the value of the ratio of the methanol ice abundance at∼taccto
the constant value at the onset of collapse (end of the prestellar core phase, Table3).
[image:12.595.91.500.371.672.2]For the spread-dominated disc case in the top panel of Fig.8, the inner∼5 au (in the midplane) is devoid of methanol ice, which is around the methanol snowline. Further out, there is radially de-pendent layering in the upper parts of the disc. The further away from the star, the less harsh the conditions (in terms of temperature and UV radiation) that parcels encounter upon infall and there-fore, the more methanol ice is preserved on the grains. The outer zones of the disc lose the least methanol ice compared with that injected at the onset of collapse. (This holds for the precollapse abundances computed here.) The striking feature of this figure is the midplane, which contains less methanol ice than the prestel-lar core. This demonstrates the effect of the physics of the system on its chemistry. The trajectory undertaken by the parcels to get to the midplane in that radial range is by first approaching the star, and then viscously spreading outwards with the growing disc.
Figure 8. Methanol ice budget schematic for the spread-dominated disc case in the top panel and for the infall-dominated disc case in the bottom panel. The colours represent the value of the ratio of the methanol ice abundance at∼taccto the value at the onset of collapse (end of prestellar core phase) in the zones. The outflow cavity and the disc surface are also labelled. The zonal divisions are based on∼250 trajectories per case.
at University of Leeds on November 15, 2016
http://mnras.oxfordjournals.org/
For example, for a final position of∼20 au in the midplane, the approach must be as far in as∼8 au. Therefore, the parcels making up the midplane lose methanol ice during their approach by rapid thermal desorption. Once under methanol-ice preserving conditions again, methanol is quickly readsorbed on to the grains, however, at abundances lower than the initial prestellar value. Since the disc formed in this spread-dominated scenario is warm (above∼40 K) methanol is not formed in the disc itself via the CO hydrogenation route. The CH3and OH route is viable at this temperature; however,
these transient species are not efficiently formed due to the strong shielding from stellar radiation by the disc. The methanol ice formed via this route, the photodissociation (by the cosmic ray-induced UV photons) of more complex species into CH3OH and adsorption are
balanced out by the inefficient non-thermal destruction of CH3OH
by the cosmic ray-induced UV photons. It is the most outer disc zones that are rich in methanol ice due to cold, shielded conditions and further production in the envelope.
Comparing to the infall-dominated disc case in the bottom panel of Fig.8, similarities and differences are present. Due to the lower remnant envelope densities in this case and therefore stronger UV flux at larger radii close to the disc surface, a much larger zone is methanol-ice poor. The methanol snowline still lies around∼5 au at the midplane. However, in this case the disc surface layers as far out as∼100 au lack solid methanol due to the strong FUV radiation, and thus due to rapid photodissociation, encountered immediately prior to entering the disc. Otherwise, a similar radially dependent layering still perseveres in the disc. The large outer zones of this infall-dominated disc contain more methanol ice than initially present in the system, as is the case for the spread-dominated disc for the same reasons. Contrary to the spread-dominated disc case, in this
case, the disc is cold enough for CO to freeze out and methanol ice formation to initiate within the disc. Additionally, no methanol-ice-poor midplane is seen. Here, the midplane is populated by infalling parcels that are still methanol-ice rich, rather than those that have suffered methanol ice loss close to the star. Within the inner∼50 au the picture is more complicated, since different types of parcels flow inwards into that area. There are those from the surface layers that are methanol-ice poor, but there are also those from the outer zones, which are methanol-ice rich.
3.3.2 Methanol ice history
From the sets of trajectories computed, it is not only possible to compute the methanol budget, but also to deduce the methanol history in the disc. The select parcels discussed in Section 3.2, namely in Figs6and7, display methanol ice profiles characteristic of various zones of the two discs. By classifying the profiles from all the parcels computed, the history of zones in the discs can be understood. The coloured regions are dominated by trajectories with the respective characteristic methanol ice profile; however, this division is approximate.
[image:13.595.96.500.396.696.2]The top panel of Fig.9shows the methanol ice history for the spread-dominated disc case. The inner∼5 au midplane zone, con-taining parcels of type sA, is devoid of methanol ice, as anticipated from Fig.8. The dominant portion of this disc contains envelope-enriched methanol ice, which is built up from parcels of type sC. Although all the parcels of this zone undergo methanol ice forma-tion during infall, they do not necessarily contain more than the prestellar amount. Prior to entering the disc, some of them still lose
Figure 9. Methanol ice history schematic for the spread-dominated disc case in the top panel and for the infall-dominated disc case in the bottom panel. The zones are coloured depending on the characteristic methanol ice profiles for parcels building up those zones (see text) and are labelled accordingly. The zonal divisions are based on∼250 trajectories per case.
at University of Leeds on November 15, 2016
http://mnras.oxfordjournals.org/
methanol ice due to the temperatures and UV fluxes encountered, which is reflected in the budget schematic in Fig.8. The third and final zone of this disc is the one containing readsorbed prestellar methanol ice and parcels of type sB. This zone corresponds to the methanol-ice-poor midplane seen in Fig.8.
In comparison to the conclusions drawn in V11 for water in their figs 4 and 6, for the spread-dominated case, methanol is also absent within a similar inner disc zone. Furthermore, the readsorbed prestellar methanol ice in the midplane corresponds with the same behaviour seen for water by Visser et al. for a comparable region. The unique aspect of methanol ice is however the enrichment in the envelope en route to the disc, thanks to the formation pathway via CO. There are no analogous low-temperature formation pathways for water, and thus it is simply preserved from the prestellar phase into the outer disc zones, as seen inV11.
The bottom panel of Fig.9depicts the methanol ice history for the infall-dominated disc case. Similar to the spread-dominated case and once again anticipated from the respective methanol budget figure, the inner∼5 au comprise the zone that is devoid of methanol ice and that contains parcels of type iA. The largest zone in this disc is that containing a mixture of disc-formed and envelope-enriched methanol ice, which is built up from parcels of type iB. This zone exists uniquely in this colder disc. The disc-formation and envelope-enhancement of methanol ice does not imply that there is more than the prestellar value. The methanol budget is not the same across this zone, as seen in Fig.8. The last zone of this disc is associated with envelope-enriched methanol ice, which is where parcels of type iC come to reside.
4 A S T R O P H Y S I C A L I M P L I C AT I O N S
Figs6–9show that the different physical conditions encountered along the various infall trajectories affect the chemical composition of the infalling material and set its history. The dust temperature and the UV radiation, in particular, drive the chemical changes. These two physical parameters determine the feasibility of criti-cal chemicriti-cal processes. Large variations in the density affect all processes and may result in, for example, rapid freeze-out. As a result, the material that enters a protoplanetary disc shows strong chemical differentiation according to regions. The inner∼4 au zone is expected to be methanol-ice poor in both discs studied and the prestellar fingerprint completely erased. Gas-phase preservation of the fingerprint is case dependent. The extended outer regions, on the contrary, are methanol-ice rich and enriched during infall. In the case of the colder, infall-dominated disc, further enrichment occurs thanks to methanol ice formation within the disc itself. In the spread-dominated disc case, the midplane is methanol-ice poor, but does contain readsorbed prestellar methanol ice. In the infall-dominated disc case, the midplane is methanol-ice rich and contains both envelope-enriched and disc-formed methanol ice, depending on the time spent by each parcel in the disc.
In this work, regions have been identified where methanol is abundant. Methanol is thought to be a key precursor to larger, more complex organic molecules ( ¨Oberg et al.2009b; Laas et al.2011; Walsh et al.2014b). This means that one of the main ingredients is readily available in the extended outer regions of discs and in the midplane in the infall-dominated disc case. The formation and distribution of complex organic molecules during disc formation and envelope dissipation will be investigated in future work.
Several limitations and uncertainties in the chemical model were identified in Section 2.4. The qualitative results presented are robust against chemical uncertainties, which are expected to have
quanti-tative effects only. It is certain that the inner disc is methanol-ice poor, while the outer regions are methanol-ice rich. However, to what exact radial ranges the two belong is not definite. In addition, the physical model does not account for all known physical pa-rameters, e.g. magnetic fields, viscous heating and mixing are not included. It is also important to realize that the physical model is most useful for understanding what type of material is delivered to the early discs, and thus primarily serves for obtaining the initial conditions for other disc models that include more complete disc physics.
4.1 Comparisons to previous works
In comparison with the 3D work of Hincelin et al. (2013), our model runs up totacc=2.46×10⁵yr, while their simulations stop at the first
hydrostatic core stage, namely at∼3.8×10⁴yr. As can be seen from
Figs6and7, prior to (tacc−38×103yr)=2.08×10⁵yr profound
chemical changes that occur thereafter are not probed. Hincelin et al. concluded that the chemical composition in the outer disc is pristine while the temperature in the disc remains below the respective desorption temperatures. In this work, the outer parts of each disc have also been shown to preserve the prestellar methanol ice, but it is also further enriched en route through the envelope. Furthermore, it is found that photodesorption and photodissociation, in addition to thermal desorption, cause the destruction of methanol ice in the inner region of the spread-dominated disc. The UV field is also strong enough to destroy gas-phase methanol in that case. Thermal desorption is responsible for stripping methanol in the inner zone of the infall-dominated disc (since these parcels drift inwards along the shielded midplane rather than infalling into the disc under irradiated conditions). In the simulations of Hincelin et al., regions of the disc attain temperatures higher than the desorption temperature of methanol already as early as the first hydrostatic core. This is not the case in this work. Here, the desorption temperature of methanol is only exceeded within the inner∼5 au attacc. The reason for this is
most likely the radiative transfer method. Hincelin et al. make use of the flux-limited diffusion approximation, while here full continuum radiative transfer is performed.
The 2D hydrodynamical work of Brinch, van Weeren & Hogerheijde (2008) obtained density and temperature profiles sim-ilar to those obtained in this work; however, their model did not include outflow cavities and was primarily focused on the envelope rather than the disc. The duration of their simulation is equal to that used here, namely 2.5×10⁵yr. The code of Yorke &
Boden-heimer (1999) adopted by Brinch et al. used flux-limited diffusion, which results in a temperature difference of a few Kelvin in the en-velope. The differences in disc temperatures, in comparison to the full continuumRADMC-3Dcalculation, cannot be quantified. Brinch
et al. also included accretion shocks on to the disc, which results in elevated temperatures (∼60 K) along the disc surface. Their model was coupled with chemistry by van Weeren, Brinch & Hogerheijde (2009), in a similar approach to that performed here.
Van Weeren et al. used the RATE06 release of the UMIST data base as their gas-phase network, i.e. the predecessor of the gas-phase network used here. For the surface reactions, van Weeren et al. used the network assembled in Hasegawa et al. (1992) and Hasegawa & Herbst (1993) in conjunction with the modified reaction rates ap-proach. Here, the larger, more up-to-date OSU network Garrod et al. (2008) is employed in combination with the classical rate equation method. The majority of the results presented in van Weeren et al. pertain to gaseous methanol, which becomes readily abundant at later times in the inner∼100 au at an abundance of∼10−5due to
at University of Leeds on November 15, 2016
http://mnras.oxfordjournals.org/