This is a repository copy of The evolution of the global selenium cycle: Secular trends in Se isotopes and abundances.
White Rose Research Online URL for this paper: http://eprints.whiterose.ac.uk/86400/
Version: Accepted Version
Article:
Stüeken, EE, Buick, R, Bekker, A et al. (7 more authors) (2015) The evolution of the global selenium cycle: Secular trends in Se isotopes and abundances. Geochimica et
Cosmochimica Acta, 162. 109 - 125. ISSN 0016-7037 https://doi.org/10.1016/j.gca.2015.04.033
© 2015, Elsevier. Licensed under the Creative Commons Attribution-NonCommercial-NoDerivatives 4.0 International http://creativecommons.org/licenses/by-nc-nd/4.0/
[email protected] https://eprints.whiterose.ac.uk/
Reuse
Unless indicated otherwise, fulltext items are protected by copyright with all rights reserved. The copyright exception in section 29 of the Copyright, Designs and Patents Act 1988 allows the making of a single copy solely for the purpose of non-commercial research or private study within the limits of fair dealing. The publisher or other rights-holder may allow further reproduction and re-use of this version - refer to the White Rose Research Online record for this item. Where records identify the publisher as the copyright holder, users can verify any specific terms of use on the publisher’s website.
Takedown
If you consider content in White Rose Research Online to be in breach of UK law, please notify us by
1
The evolution of the global selenium cycle: secular trends in Se isotopes and
1
abundances
2
3
E. E. Stüeken1*, R. Buick1, A. Bekker2, D. Catling1, J. Foriel3, B. M. Guy4, L. C. Kah5,H. G. 4
Machel6, I. P. Montañez7, S. W. Poulton8 5
6
1. Department of Earth & Space Sciences and Astrobiology Program, University of Washington, 7
Seattle, WA 98195-1310, USA 8
2. Department of Earth Sciences, University of California, Riverside, CA 92521, USA 9
3. Department of Earth and Planetary Sciences and McDonnell Center for the Space Sciences, 10
Washington University in St. Louis, St. Louis, MI 63130, USA 11
4. Dept. of Geology, University of Johannesburg, Auckland Park 2006, South Africa; Present
12
Address: Mineral Services, SGS South Africa, 58 Melville Street, Booysens, Johannesburg 2091,
13
South Africa
14
5. Department of Earth & Planetary Sciences, University of Tennessee, Knoxville, TN 37996, 15
USA 16
6. Department of Earth & Atmospheric Sciences, University of Alberta, Edmonton, Alberta T6G 17
2E3, Canada 18
7. Department of Earth and Planetary Sciences, University of California, Davis, CA 95616, USA 19
8. School of Earth and Environment, University of Leeds, Leeds, LS2 9JT, UK 20
* corresponding author. [email protected]
2 Abstract
23
The Earth’s surface has undergone major transitions in its redox state over the past three 24
billion years, which have affected the mobility and distribution of many elements. Here we use 25
Se isotopic and abundance measurements of marine and non-marine mudrocks to reconstruct the 26
evolution of the biogeochemical Se cycle from ~3.2 Gyr onwards. The six stable isotopes of Se 27
are predominantly fractionated during redox reactions under suboxic conditions, which makes Se 28
a potentially valuable new tool for identifying intermediate steps from an anoxic to a fully 29
oxygenated world. 82/78Se shows small fractionations of mostly less than 2‰throughout Earth’s 30
history and all are mass-dependent within error. In the Archean, especially after 2.7 Gyr, we find 31
an isotopic enrichment in marine (+0.37 ± 0.27‰) relative to non-marine samples (-0.28 ± 32
0.67‰), paired with increasing Se abundances. Student t-tests show that these trends are 33
statistically significant. Although we cannot completely rule out the possibility of volcanic Se 34
addition, these trends may indicate the onset of oxidative weathering on land, followed by non-35
quantitative reduction of Se oxyanions during fluvial transport. The Paleoproterozoic Great 36
Oxidation Event (GOE) is not reflected in the marine 82/78Se record. However, we find a major 37
inflection in the secular 82/78Se trend during the Neoproterozoic, from a Precambrian mean of 38
+0.42 ± 0.45‰ to a Phanerozoic mean of -0.19 ± 0.59‰. This drop probably reflects the 39
oxygenation of the deep ocean at this time, allowing Se oxyanions to be stable throughout the 40
water column. Since then, reduction of Se oxyanions has likely been restricted to anoxic basins 41
and diagenetic environments in sediments. In light of recent Cr isotope data, it is likely that 42
oxidative weathering before the Neoproterozoic produced Se oxyanions in the intermediate 43
redox state SeIV, whereas the fully oxidized species SeVI became more abundant after the 44
3 1. Introduction
46
Se is an essential micronutrient for many organisms (e.g. Mayland, 1994; Gladyshev, 47
2012). In natural environments it can be found in four redox states, as SeVI (SeO42-), SeIV (SeO3 2-48
or HSeO3-), Se0, and organic and inorganic Se-II. In the modern ocean, the oxyanions SeVI and 49
SeIV are most abundant and show typical nutrient abundance profiles with depletion in the photic 50
zone, replenishment below the photic zone due to organic matter remineralization and constant 51
concentration in the deep ocean (Cutter and Cutter, 2001). Organic Se-II is common in surface 52
waters but it is almost entirely re-oxidized at depth and thus insignificant below the photic zone. 53
In anoxic water columns, remineralization of organic matter does not occur, such that organic Se -54
II phases dominate below the chemocline and Se oxyanions remain low throughout the water 55
column (Cutter, 1982; Cutter, 1992). Sediments that formed in anoxic environments therefore 56
mostly contain reduced phases, including Se 0 and organic and pyrite-bound Se-II (Kulp and Pratt, 57
2004; Fan et al., 2011). 58
The six stable isotopes of Se (masses 82, 80, 78, 77, 76 and 74) are most strongly 59
fractionated during kinetic redox transformations, which favor the lighter masses. In laboratory 60
experiments, abiotic reduction of Se oxyanions to Se0 or Se-II with HCl, NH2OH, ascorbic acid, 61
Fe2+ in green rust or sulfide can impart larger negative fractionations ( = 10-25‰, where = 62
82/78Sereactant – 82/78Seproduct) than biotic reduction ( = 6-14‰) (Krouse and Thode, 1962; Rees 63
and Thode, 1966; Rashid and Krouse, 1985; Johnson et al., 1999; Herbel et al., 2000; Ellis et al., 64
2003; Johnson and Bullen, 2003; Mitchell et al., 2013). However, in natural systems, abiotic 65
reduction is thought to be kinetically inhibited such that biological fractionation likely dominates 66
(Johnson and Bullen, 2004). Large fractionations can also occur during equilibration of Se 67
4
forms become isotopically enriched by up to 33‰ (Li and Liu, 2011). Although it has so far not 69
been demonstrated that equilibrium processes are insignificant in natural environments, the 70
dominance of kinetic fractionation in other isotopic systems like S, as well as the co-occurrence 71
of different Se redox species in thermodynamic disequilibrium in natural samples (e.g. Cutter 72
and Bruland, 1984; Kulp and Pratt, 2004) suggests that kinetic processes are most important 73
(reviewed by Johnson and Bullen, 2004). Moderate negative fractionations from <0.6‰ to 2.6‰ 74
have been reported for SeVI assimilation into biomass (Johnson et al., 1999; Hagiwara, 2000; 75
Clark and Johnson, 2010), but those values greater than 0.6‰, which were measured by 76
Hagiwara (2000), have been questioned due to possible fractionation during sample preparation 77
(Johnson and Bullen, 2004). Hence isotopic fractionation associated with assimilation is 78
probably on the order of 0.6‰ or less and thus minor. Similarly, SeIV adsorption on Fe oxides 79
results in small negative fractionations of up to 0.7‰ (average 0.1‰) (Johnson et al., 1999; 80
Mitchell et al., 2013). Volatilization of organic Se-II from incubated soils can impart moderate 81
fractionations of up to 2.7‰ (Johnson et al., 1999; Schilling et al., 2011a), but Se gases have 82
such a short atmospheric residence time of only a few hours (Wen and Carignan, 2007) that this 83
pathway is insignificant over geologic timescales. Consequently, it appears that large Se isotope 84
fractionations of greater than 1‰ in geological samples should be evidence of biological 85
reduction of Se oxyanions. As noted by others (Ellis et al., 2003; Johnson, 2004; Johnson and 86
Bullen, 2004), isotopic fractionations associated with oxyanion reduction may be smaller in 87
natural ecosystems than under experimental conditions due to differences in physiology between 88
cultured microorganisms and natural consortia. However, individual reports of fractionations up 89
to 4‰ in some marine shales (Wen et al., 2014; Stüeken et al., submitted) suggest that Se 90
5
deposition. Smaller fractionations associated with oxyanion adsorption and assimilation into 92
biomass may be significant in oxic environments where reduction does not occur. This raises the 93
possibility of using Se isotopes as an independent tool for reconstructing environmental redox 94
changes over Earth’s history (Mitchell et al., 2012; Stüeken et al., 2015). Because of its relatively 95
low abundance, multiple redox states and high redox potential (Johnson, 2004), Se may be more 96
sensitive to redox and productivity changes than other proxies, such as S and perhaps Mo. We 97
note that an impediment to this line of research is the current lack of data about Se isotopic 98
fractionations associated with volcanic eruptions, which may have been important in the past, but 99
we will discuss this issue as appropriate. 100
This study is composed of two parts with the aim of reconstructing the evolution of the 101
Se cycle through Earth’s history. First, we compile recent marine Se isotope data from the 102
literature and create a working model for how Se isotopes behave on a global scale in the modern 103
ocean under known redox conditions. This will provide a platform for interpreting Se isotope 104
data in deep time. Second, we present new data from mudrocks through time with particular 105
focus on the Precambrian, incorporating transects across environmental gradients in the late 106
Archean and Mesoproterozoic. Combined with existing datasets (Johnson and Bullen, 2004; 107
Rouxel et al., 2004; Mitchell et al., 2012; Layton-Matthews et al., 2013; Wen et al., 2014; 108
Stüeken et al., 2015), this provides us with a record spanning the last 3.2 billion years, i.e. 109
through the proposed Paleoproterozoic and Neoproterozoic oxidation events (reviewed by Lyons 110
et al., 2014a). Both of these events could have affected the Se biogeochemical cycle, and hence 111
the sedimentary Se record may provide independent evidence or additional information on them. 112
More specifically, we test the following hypotheses: (1) Because the most mobile Se species SeIV 113
6
marine Se cycle changed profoundly with the oxygenation of the deep ocean in the 115
Neoproterozoic (Canfield et al., 2007; Canfield et al., 2008; Shields-Zhou and Och, 2011; Sahoo 116
et al., 2012). SeVI and SeIV should have become more stable ions in the water column, i.e. they 117
should no longer have been subject to quantitative reduction, leading to larger net isotopic 118
fractionations preserved in sediments. Hence, we expect to see a systematic difference in isotopic 119
values before and after the Neoproterozoic oxidation event. (2) The high redox potential of Se 120
oxyanions (SeIV/VI) compared to sulfate (SVI) (Johnson, 2004) may also have delayed the onset of 121
the Se weathering flux from land into the ocean during the early stages of Earth surface 122
oxygenation. Total S (TS) abundances in marine sediments increased in the late Archean, 123
suggesting incipient oxidative weathering of sulfide minerals, enhanced by microbial activity 124
(Stüeken et al., 2012). If conditions were not oxidizing enough for Se, then TS/TSe ratios in 125
sediments should have been elevated for some time interval afterwards, perhaps until the 126
Paleoproterozoic or Neoproterozoic oxidation events, when atmospheric oxygen levels rose 127
globally. If, however, microbial activity led to locally high redox states sufficient for Se 128
oxidation, then the SeIV and/or SeVI flux to the ocean may have increased concurrently with the 129
SVI flux and TS/TSe ratios should be constant through time. Hence marine TS/TSe ratios may 130
serve as an indirect proxy for non-marine redox processes. We would further expect to see 131
isotopic differences between non-marine, shallow marine and deeper marine sediments if SeIV/VI 132
stability and abundance decreased from oxic terrestrial habitats to anoxic seawater. 133
134
2. Methods 135
7
To better understand the modern Se cycle, we compiled data from the literature 137
representing the last 500 kyr during which the ocean redox state is relatively well constrained. 138
Included are data from the mid-Atlantic (Johnson and Bullen, 2004), the Bermuda Rise (Shore, 139
2010), the Cariaco Basin (Shore, 2010), the Arabian Sea (Mitchell et al., 2012) and the Black 140
Sea (Johnson and Bullen, 2004; Mitchell et al., 2012). The data set was divided into two 141
categories: open oxic ocean and restricted anoxic basins. Data from the mid-Atlantic, the 142
Bermuda Rise, the Arabian Sea, and from the glacial oxygenated stages of the Cariaco Basin 143
(Shore, 2010) were included in the oxic ocean category. Samples from the Arabian Sea include 144
sediments that formed below an oxygen minimum zone (Mitchell et al., 2012), but because the 145
Arabian Sea rapidly exchanges water masses with the open ocean by upwelling and therefore 146
likely has a high supply of Se oxyanions, it is more similar to an oxic ocean. The restricted 147
anoxic basin category includes data from the interglacial Cariaco Basin (Shore, 2010) and the 148
Black Sea. Although some samples from the Black Sea have been described as oxic (Mitchell et 149
al., 2012), euxinic conditions in the deeper water column probably result in low Se oxyanion 150
concentrations and a short residence time throughout the basin (Cutter, 1992). Therefore, we 151
assigned all Black Sea samples to the anoxic restricted basin category. 152
153
2.2. New analyses of ancient rocks 154
Our new analyses focused on whole-rock samples of kerogenous mudrocks (Table 1), 155
because they are relatively abundant and Se-rich. This approach has the disadvantage that 156
mudrocks can contain multiple isotopically distinct Se phases including elemental Se0, Se-II 157
bound to organic matter or substituting for S-II in sulfide minerals, and SeIV adsorbed to mineral 158
8
submitted). Combining these phases probably reduces the measured isotopic range and might 160
make it more difficult to discern patterns. In some ways, this is analogous to measuring trends in 161
C isotopes without separating organic C from carbonate. However, separation techniques for 162
differing Se phases in rocks are only beginning to be developed (Kulp and Pratt, 2004; Fan et al., 163
2011; Schilling et al., 2014b; Stüeken et al., submitted), and it is uncertain if they are useful for 164
ancient samples where isotopic ratios may have re-equilibrated. An alternative approach may be 165
to analyze banded iron formations (BIF) that primarily contain just one phase, i.e. adsorbed SeIV 166
(Schilling et al., 2014b; Schirmer et al., 2014). However, the Se concentrations in such rocks are 167
very low, presenting analytical difficulties, and BIF or equivalent deep-marine Fe oxides are not 168
available from all time periods or from all environments. Mudrocks have formed throughout 169
Earth’s history in a diversity of environments including lakes, tidal flats and outer marine shelves,
170
which allows us to compile data across both the Paleoproterozoic and the Neoproterozoic 171
oxidation events (Lyons et al., 2014a) and to reconstruct environmental redox gradients. 172
One of our principal goals in this study was to determine if mass-independent 173
fractionation of selenium isotopes (MIF-Se) occurred early in Earth’s history, analogous to the 174
Archean MIF anomaly seen in quadruple sulfur isotope studies. In order to assess this, we used a 175
sample-standard bracketing analytical protocol rather than the more usual double-spike 176
procedure. We measured all masses from 71 to 84 to allow post-analytical data correction for the 177
full range of possible isobaric interferences without the assumption of strict mass-dependent 178
fractionation (Stüeken et al., 2013). This procedure allows reproducible measurement of 5 179
selenium isotopes, the precise determination of 4 isotopic ratios to less than 0.2‰ for 76/78Se, 180
77/78Se and 82/78Se and 0.5‰ for 74/78Se, and thus accurate detection of mass-independent 181
9
independent fractionation in the sulfur and mercury isotopic systems is best expressed by the 183
least abundant and odd-numbered masses (Farquhar et al., 2007; Gosh et al., 2008), which in the 184
case of selenium are 74Se and 77Se, both isotopes that are often sacrificed in double-spike 185
methodologies. Our technique has been successfully used to detect small but significant Se 186
isotopic excursions at the Archean-Proterozoic boundary (Stüeken et al., 2013). 187
Our sample preparation methods, analytical protocols and interference corrections for Se 188
isotopes are described in more detail in Stüeken et al. (2013). In brief, rock powders were 189
digested with HF, HNO3 and HClO4; the Se was extracted by column filtration through thiol 190
cotton fibers and further purified with aqua regia. Analyses were carried out with a hydride- 191
generator (HGX-200) coupled to a multi-collector inductively-coupled plasma mass 192
spectrometer (Nu Instruments). Instrumental mass bias was corrected by standard-sample 193
bracketing. Isobaric interferences, most importantly by argon dimers, arsenic hydrides and 194
germanium, were corrected post-analytically (Stüeken et al., 2013). Results are reported in 195
standard delta notation relative to NIST SRM 3149. Unless noted otherwise, we used the 196
82Se/78Se ratio: 197
82/78Se = [(82Se/78Se)sample/(82Se/78Se)SRM3149 - 1]·1000 (Eq. 1), 198
because with our method this particular isotope pair yields the most accurate and precise 199
measurements. For conversion to 82/76Se, which has been used by other laboratories, values can 200
be multiplied by 1.54, because mass-independent fractionation is absent (see below). We 201
analyzed a total of 202 samples and 127 of those in replicates. The average precision (1 ) was 202
0.10‰ for 82/78Se and 1.6% (relative error) for Se concentrations. Our result for the 203
international reference material SGR-1, processed with the same method, was +0.05 ± 0.18‰ 204
10
Mitchell et al., 2012; Pogge von Strandmann et al., 2014). Data was statistically evaluated using 206
Student’s t-test and regression analysis. 207
Total organic C and total S were analyzed with established methods used routinely in the 208
UW Isolab (Schoepfer et al., 2013; Stüeken, 2013) with precisions of 1% and 10%, respectively. 209
For TOC, powders were decarbonated with 6N HCl. S was analyzed on untreated samples. 210
Analyses were carried out by flash combustion with an elemental analyzer (Costech ECS 4010) 211
coupled to a continuous-flow isotope-ratio mass spectrometer (Finnigan MAT 253). 212
Statistical comparisons between binned time intervals were carried out using Student’s t-213
test. These methods have sufficient power to detect small but significant shifts in mean isotopic 214
values through time and have been used to detect secular changes in other isotopic systems (e.g. 215
Stüeken et al., 2012). Bins for statistical tests were chosen following previously noted transitions 216
in sulfur (Stüeken et al., 2012) and selenium cycling (Large et al., 2014) in the late Archean and 217
Neoproterozoic, respectively. We further tested for changes around the Paleoproterozoic Great 218
Oxidation Event (Bekker et al., 2004; Anbar et al., 2007; Stüeken et al., 2015). 219
220
3. Results 221
3.1. Trends in the modern ocean 222
The compilation of published Se isotope data from marine sediments deposited over the 223
last 500 kyr (Fig. 1) shows that sediments deposited from the open oxic ocean tend to have a 224
slightly but statistically significantly lighter isotopic composition ( 82/78Seavg = -0.10 ± 0.21‰, 225
range -0.90‰ to +0.41‰) than sediments formed under anoxic water in restricted basins (+0.07 226
± 0.24‰, range -0.41‰ to +0.59‰; pone-tailed < 10-4). Sediments deposited in anoxic basins thus 227
11
(≥ +0.3 ‰, Rouxel et al., 2004; Mitchell et al., 2012). The isotopic composition of SeVI and SeIV 229
dissolved in seawater has not yet been measured directly, but as noted by Mitchell et al. (2012), 230
measurements of SeIV adsorbed onto Fe-Mn nodules (+0.32 ‰, n = 1, Rouxel et al., 2004) as 231
well as the composition of phytoplankton (+0.27 ‰, n = 1, εitchell et al., 2012) provide lower 232
limits. If adsorption of SeIVis associated with a fractionation of 0.1‰ on average (Mitchell et al., 233
2013), then dissolved SeIVmay have a composition of around +0.4‰. Although assimilation of 234
SeIV/VIinto biomass has a fractionation of 0.6‰ (Clark and Johnson, 2010), this fractionation 235
may not be expressed if assimilation is quantitative in the photic zone, where Se oxyanion 236
concentrations are depleted (Cutter and Bruland, 1984; Cutter and Cutter, 2001). Hence the 237
composition of phytoplankton (+0.27‰, εitchell et al., 2012) may approximate that of 238
dissolved SeIV/VI. But given the maximum observed fractionations during adsorption and 239
assimilation, dissolved Se oxyanions may be as heavy as +1‰. SeIV and SeVI are probably 240
isotopically homogenized, because SeIV is mostly generated through remineralization of organic 241
matter (Cutter and Bruland, 1984), which does not impart an isotopic fractionation (Johnson and 242
Bullen, 2004). 243
Today, under a fully oxic atmosphere, the input of Se to the ocean from crustal 244
weathering and volcanism probably has an average composition equivalent to that of the crust at 245
+0.01 ± 0.49‰ (Rouxel et al., 2002), because oxidation as during weathering does not cause 246
isotopic fractionations (Johnson et al., 1999) and normal Se-poor soils are unfractionated relative 247
to crust (Schilling et al., 2011b). As meteorites show approximately the same value (+0.11 ± 248
0.34 ‰, Rouxel et al., 2002), it is unlikely that on a global scale the Se isotope composition of 249
the upper crust has changed much throughout Earth’s history. If so, then our compilation 250
12
crustal source whereas dissolved SeIV/VI is enriched. Sediments from anoxic basins are slightly 252
heavier than the crust, but still somewhat lighter than the presumed composition of seawater. 253
254
3.2. New data from ancient sedimentary rocks 255
All our new Se isotope data (Table A1) plot within error along the theoretical mass-256
dependent fractionation line (Fig. 2), indicating that isobaric interferences occurring in the mass 257
spectrometer have been properly corrected. Using our analytical protocol (Stüeken et al., 2013), 258
82/76Se is analytically the second most stable ratio after 82/78Se (Fig. 2a). 82/77Se (Fig. 2b) can 259
be compromised by interferences with 77(ArCl) and possibly 77(AsH2) that are difficult to 260
monitor and to subtract (Stüeken et al., 2013; Stüeken et al., 2015), which probably explains the 261
enhanced scatter in our measurements of this isotopic ratio. 78/74Se (Fig. 2c) suffers from 262
interferences with 74Ge, magnified by the low abundance of 74Se. Occasional outliers in 78/74Se 263
are thus likely due to improperly corrected residual 74Ge. So overall we do not see any evidence 264
of mass-independent fractionation (MIF) in Se at any time in the rock record, in stark contrast to 265
the isotopic record of S (Farquhar et al., 2000). Photochemical reactions involving Se were either 266
not conducive to MIF, or volatile Se compounds were insignificant in relative abundance. It is 267
worth noting that eukaryotic algae, plants and fungi are significant contributors of the major Se 268
gases today, i.e. methylated Se-II (e.g. Chasteen and Bentley, 2003), and hence the flux of these 269
gases may have been trivial in the earlier Precambrian prior to the oxygenation of the atmosphere 270
and the radiation of eukaryotic life. 271
Combined with published Se isotope data from the late Archean Mt. McRae Shale 272
(Stüeken et al., 2015) and several Phanerozoic basins (Johnson and Bullen, 2004; Shore, 2010; 273
13
the range of mass-dependent Se isotope fractionation recorded in mudrocks (-3.1‰ to +2.9‰) is 275
significantly smaller than the 6-25‰ measured in oxyanion reduction experiments in the 276
laboratory (Johnson et al., 1999; Herbel et al., 2000; Ellis et al., 2003; Johnson and Bullen, 277
2003), but during most time intervals it exceeds the 0.7‰ maximum range expected for Fe-Mn-278
oxide adsorption and assimilation into biomass (Johnson et al., 1999; Clark and Johnson, 2010; 279
Mitchell et al., 2013). As discussed above, the relatively small range in bulk sediments is 280
probably in part due to mixing of multiple Se phases recording different isotopic fractionations, 281
but it may also reflect a smaller magnitude in isotopic fractionation under natural, Se-poor 282
conditions. 283
The mean of all new and published isotopic data is +0.09 ± 0.59‰ (n = 526) while the 284
geometric mean of total Se (TSe) concentrations is 1.3 +4.8/-1.0 ppm (= 100.12 ± 0.67 ppm). We 285
use the geometric mean here because of the wide TSe range over several orders of magnitude. In 286
the normal marine record (Table 2), isotopic ratios decrease slightly but significantly from the 287
mid-Archean (here 3.19-2.87 Gyr; +0.62 ± 0.27‰, n = 23, after removing one outlier of +1.43‰ 288
and 2.23 ppm TSe) to the late Archean (2.71-2.50 Gyr; +0.35 ± 0.39‰, n = 110) (pone-tailed = 10-4) 289
but show no major change from the late Archean to the Proterozoic (2.49-1.10 Gyr; +0.45 ± 290
0.55‰, n = 59; pone-tailed = 0.12). The most significant change in Se isotopes occurs between the 291
Proterozoic and the Phanerozoic (0.54 Gyr to modern; -0.19 ± 0.59‰, n = 240; pone-tailed = 10-25). 292
Although we do not have any data for samples with ages between 1.10 Gyr and 0.55 Gyr, it is 293
plausible that this isotopic transition coincides with the purported “second rise of oxygen” and 294
the oxygenation of large parts of the deep ocean in the late Neoproterozoic (Canfield et al., 2007; 295
14
evidence for a marked increase in pyrite-bound Se at around 600 Myr (Large et al., 2014), which 297
also suggests a major reorganization in the marine Se cycle around this time. 298
In these compilation of normal marine Se isotopes and abundances, we excluded 299
Phanerozoic basins known to be restricted: the modern Cariaco Basin and Black Sea, the 180 300
Myr Posidonia Shale, the 380 Myr New Albany Shale (total average 82/78Se = +0.23 ± 0.40‰, n 301
= 66) (Johnson and Bullen, 2004; Shore, 2010; Mitchell et al., 2012). These basins show 302
distinctively higher TS/TSe ratios (1.82 +3.19/-1.16 = 100.26 ± 0.44 [%/ppm], n = 37) than most 303
other Phanerozoic basins (0.27 +0.71/-0.20 = 10-0.57 ± 0.56 [%/ppm], n = 130; pone-tailed = 10-14; Fig. 304
3c) due to higher TS concentrations. This is probably the result of locally distinct geochemical 305
processes under restricted euxinic conditions, justifying our decision to exclude these basins 306
from the normal marine record. In the Precambrian, the distinction between restricted and open 307
marine basins is less certain. All Precambrian basins sampled for this study have been argued to 308
openly exchange with the ocean, perhaps with the exception of the Belt Basin. But, as discussed 309
in Section 4.5, Se likely had a short residence time in the Precambrian ocean, making the 310
distinction between open and restricted basins unnecessary. We therefore treat all our 311
Precambrian data as representative of normal marine conditions, but discuss environmental 312
differences in more detail below. 313
A highly significant transition in average Se concentrations occurs between the mid-314
Archean (0.17 +0.11/-0.07 ppm = 10-0.76 ± 0.21 ppm) and the late Archean (1.45 +2.75/-0.95 ppm = 315
100.16 ± 0.46 ppm; pone-tailed = 10-23). Concentrations then decrease slightly from the late Archean to 316
the Proterozoic (0.74 +3.73/-0.62 ppm = 10-0.13 ± 0.78 ppm; pone-tailed = 0.005) and increase 317
significantly again from the Proterozoic to the Phanerozoic (1.75 +7.42/-1.42 ppm = 100.24 ± 0.72 318
15
Marine TS/TSe ratios [%/ppm] only show relatively subtle changes through time. They 320
increase from 0.45 +0.58/-0.25 (= 10-0.35 ± 0.36) before 2.71 Gyr to 0.78 +1.98/-0.56 (= 10-0.11 ± 0.55) 321
between 2.71 Gyr and 1.1 Gyr (pone-tailed = 0.04) with no significant change between the late 322
Archean and the Proterozoic (pone-tailed = 0.42). They then decrease significantly to 0.17 +0.69/-323
0.13 (= 10-0.78±0.71) in the Phanerozoic (pone-tailed = 10-17). 324
A few sites further show environmental gradients in Se isotopes: 325
In the mid-Archean Witwatersrand Supergroup (Fig. 4a) from South Africa (2.96-2.87 Gyr), 326
all samples are isotopically positive, but fluvial samples are slightly lighter ( 82/78Se = +0.30 ± 327
0.19‰, n = 5) than proximal marine samples ( 82/78Se = +0.74 ± 0.28‰, n = 8) (p one-tailed < 0.01). 328
Distal marine samples are variable ( 82/78Se = +0.63 ± 0.51‰, n = 5). In general, marine shelf 329
samples from the Witwatersrand Supergroup agree well with upper continental slope samples 330
from the Soanesville Group in Western Australia (3.2 Gyr; 82/78Se = +0.64 ± 0.18‰, n = 9). 331
In the late Archean Fortescue Group (Fig. 4b) in Western Australia (2.75-2.65 Gyr), we find a 332
significant contrast between marine environments ( 82/78Se = +0.37 ± 0.27‰, n = 28) and non-333
marine environments ( 82/78Se = -0.28 ± 0.67‰, n = 19) (p one-tailed < 0.001). Shallow marine 334
shales from the Carawine Dolomite ( 82/78Se = +0.32 ± 0.12‰, n = 7) are on average the same as 335
deeper marine samples from the Jeerinah Formation ( 82/78Se = +0.38 ± 0.30‰, n = 21) but less 336
variable. Both agree well with marine samples from the Ghaap Group in South Africa (2.56-2.52 337
Gyr; 82/78Se = +0.41 ± 0.33‰, n = 15). 338
Volcanogenic massive sulfides (VMS) from the late Archean Kidd Creek Basin (2.7 Gyr; 339
82/78Se = +0.28 ± 0.24‰, n = 5) are statistically indistinguishable from associated marine black 340
shales ( 82/78Se = +0.07 ± 0.22‰, n = 5) (pone-tailed = 0.10), but show a markedly smaller range 341
16
Atlantic Ridge ( 82/78Se = -0.98 ± 0.81‰, n = 51, Rouxel et al., 2004) and late Devonian VMS 343
deposits from northwestern Canada ( 82/78Se = -1.88 ± 2.33‰, n = 23, δayton-Matthews et al., 344
2013). 345
In the Mesoproterozoic Belt Supergroup (1.47 Gyr, Fig. 4c), isotopically light values ( 82/78Se 346
= -0.07 ± 0.43‰, n = 7) mainly occur in offshore facies to the west, whereas onshore facies from 347
the eastern basin margin tend to be relatively heavy ( 82/78Se = +0.73 ± 0.33‰, n = 8). Here, the 348
offshore sites are located closer to the opening of the basin towards the ocean but also closer to 349
the proposed major riverine inflow from the unsampled western basin margin (Ross and 350
Villeneuce, 2003). Deep basinal facies from the roughly coeval Roper Basin (1.36 Gyr; 82/78Se 351
= +0.53 ± 0.20‰, n = 7) and samples of intermediate water depth from the Taoudeni Basin (1.1 352
Gyr; 82/78Se = +0.45 ± 0.52‰, n = 5) are generally positive. If these sediments were deposited 353
distal to the most significant riverine water inflow, then all three Mesoproterozoic basins may 354
show relative isotopic enrichment with increasing distance from the major Se source. 355
Our results for coastal Atlantic samples from the Cretaceous (120 Myr) Ocean Anoxic Event I 356
(OAE I) are all negative ( 82/78Se = -0.41 ± 0.23‰, n = 8, Fig. 4f), whereas Mitchell et al. (2012) 357
found primarily positive values ( 82/78Se = +0.19 ± 0.25 ‰, n = 27) in deep-marine Atlantic 358
samples from OAE II (93 Myr). Hence, taken together, the Atlantic Ocean may have displayed a 359
basinal gradient during anoxic stages. 360
When all normal marine data points are combined, 82/78Se is not correlated with 34S (r2 361
= 0.005), TS (r2 = 0.05), TOC (r2 = 10-5) or TSe (r2 = 0.02) and only weakly with 13Corg (r2 = 362
0.22). TSe shows moderate correlations with TS and TOC in logarithmic space (r2 = 0.31 and 363
0.50, respectively, Fig. 5), but much less so in linear space (r2 = 0.01 and 0.22). We hypothesize 364
17
grained black shales with low sedimentation rates tend to accumulate a larger quantity of reduced 366
Se (Se-II or Se0), sulfide S and organic C than siltstones or more rapidly accumulating sediments, 367
regardless of whether the three elements are biogeochemically related. Based on the relatively 368
weak correlations in linear space, we therefore conclude that Se does not strictly follow either S 369
or organic matter under all conditions. However, we do see moderately strong correlations 370
between 82/78Se and TOC in a few individual basins, in particular the Ghaap Group (r2 = 0.64, n 371
= 15, Fig. 4e) and the Belt Supergroup (r2 = 0.41, n = 15, Fig. 4d). In both cases, 82/78Se values 372
decrease with increasing TOC, but TSe is not correlated with TOC or TS. TOC data are not 373
available for the marine Fortescue Group. None of the other basins for which we have more than 374
10 data points show strong correlations. 375
376
4. Discussion 377
After first assessing the quality of samples analyzed in this study, we describe a 378
conceptual model of the modern Se cycle based on our compilation of literature data. We then 379
use this as a platform to reconstruct the evolution of the global Se cycle through time. 380
381
4.1. Sample quality 382
Diagenesis, metamorphism or weathering can potentially alter primary geochemical 383
features in rock samples. As discussed in Section 4.2, diagenetic Se oxyanion reduction may 384
occur in sediments deposited under oxic conditions where the Se supply is relatively high. 385
Evidence for diagenetic oxyanion reduction in ancient rocks may thus be a diagnostic feature of 386
18
reactions between reduced Se phases, such as exchange of Se-II between organic matter and 388
pyrite, should not lead to isotopic fractionations, especially within bulk rocks. 389
Regarding metamorphism, Large et al. (2014) showed that sulfide-bound Se-II is 390
essentially immobile during metamorphic alteration, therefore isotopic alteration of this phase 391
should be trivial. Organic Se-II, Se0 or adsorbed SeIV may be more sensitive to metamorphism, 392
but associated isotopic fractionations are unknown. Most of our samples are of sub-greenschist 393
metamorphic grade; only the Witwatersrand samples are greenschist grade. In the S isotope 394
literature, metamorphic effects are commonly ignored in these metamorphic facies, and given the 395
higher mass of Se relative to S, it is unlikely that Se is more mobile than S under metamorphic 396
conditions. We therefore believe that our results are not significantly affected by metamorphism. 397
Weathering has been shown to cause large Se isotopic fractionations of several permil in 398
a recent study of unusually Se-rich soils (5-26,000 ppm) from China (Zhu et al., 2014), where Se 399
was apparently oxidized and then partially re-reduced during aqueous transport. However, in Se-400
poor soils (0.1-0.5 ppm) from Germany the range of fractionation was much smaller (<0.5‰, 401
Schilling et al., 2011b), suggesting that the large fractionations observed by Zhu et al. (2014) 402
may not necessarily be representative of typical weathering environments. Measurable isotopic 403
effects may be restricted to Se-rich settings where the Se weathering flux is unusually high, such 404
that partial reduction can add significantly to surrounding rocks. Se oxidation by itself does not 405
impart a detectable isotopic fractionation (Johnson et al., 1999). Because most of our samples are 406
from drill cores while any outcrop samples were relatively fresh and had their outer surfaces 407
removed with a rock saw, weathering probably did not have significant effects on our results. 408
409
19
The relatively low 82/78Se values preserved in sediments deposited in or near open oxic 411
conditions ( 82/78Seavg = -0.10 ± 0.21‰, range -0.90‰ to +0.41‰) compared to the presumed 412
composition of dissolved Se oxyanions in seawater ( 82/78Se +0.3, Section 3.1) are likely the 413
result of non-quantitative SeVI or SeIV reduction to Se0 or inorganic Se-II under suboxic 414
conditions during diagenesis or in locally suboxic bottom water (Fig. 6) (Shore, 2010). The 415
mechanism may have been either biological dissimilatory reduction or abiotic reduction. We 416
emphasize that our ‘open oxic ocean’ category includes data from an oxygen minimum zone in 417
the Arabian Sea (Mitchell et al., 2012) and therefore does not exclusively represent oxic 418
conditions; however, all data points are from environments that are part of the open ocean and 419
connected to the oxic water column, i.e. they are characterized by a high Se oxyanion supply, 420
unlike restricted anoxic basins. Non-quantitative Se oxyanion reduction during diagenesis under 421
an oxic water column or in locally suboxic bottom water may thus explain why residual SeVI and 422
SeIV dissolved in modern oxic seawater are relatively enriched compared to average crust (~0‰, 423
Rouxel et al., 2002). Addition of small amounts of isotopically heavy adsorbed SeIV (~+0.3‰, 424
Rouxel et al., 2002) or organic Se-II(~+0.3‰, εitchell et al., 2012) to isotopically light Se0 and 425
inorganic Se-IImay explain why bulk 82/78Se values in open marine sediments are not as 426
negative as one might expect given the fairly large fractionations associated with reduction 427
reactions observed in laboratory simulations (Johnson et al., 1999). Sequential extraction 428
experiments indeed show that sediments and soils commonly contain multiple Se phases with 429
distinct isotopic compositions (Kulp and Pratt, 2004; Schilling et al., 2014b). Sequential 430
extractions have so far not been carried out on open marine sediments deposited under an oxic 431
water column, but we would predict a mixture of isotopically light inorganic Se-II and/or Se0 and 432
20
In the C and S cycle, the isotopically heavy reservoirs complementary to isotopically 434
light reduced phases (organic matter and sulfide, respectively) are carbonate and sulfate minerals. 435
In the case of Se, however, the most oxidized species SeVI does not form major mineral deposits 436
and incorporation into carbonate or sulfate minerals is probably minor (< 0.025 ppm total Se, 437
Hagiwara, 2000). Adsorbed SeIV on FeMn-oxides may be the most significant isotopically heavy 438
reservoir today, complementary to the relatively light siliciclastic sediments from the open 439
ocean; more data are needed to test this possibility. Based on our data compilation, we propose 440
that sediments from restricted anoxic basins, which tend to be isotopically slightly heavier than 441
sediments of open oxic basins, may represent another significant complementary positive 442
repository to the isotopically lighter sediments from the global oxic ocean (Fig. 6). Under anoxic 443
conditions, Se assimilated into biomass is not recycled by oxidation, leading to low 444
concentrations of Se oxyanions in the anoxic water column (Cutter, 1982; Shore, 2010; Mitchell 445
et al., 2012). Therefore, Se oxyanion reduction is likely more quantitative than under diagenetic 446
conditions beneath an oxic water column where the concentrations of Se oxyanions are high. 447
Following Rayleigh distillation, net isotopic fractionations during reduction relative to the crustal 448
source may thus be smaller. Furthermore, compared to open oxic settings, organic Se may be 449
more abundant. Biomass may also be isotopically heavier than in the open ocean, because with 450
more quantitative oxyanion reduction, residual SeIV/VI, i.e. the substrate for assimilation into 451
biomass, may be heavier than +0.3‰. So although restricted anoxic settings do not appear to 452
fully capture the isotopic composition of marine SeIV/VI (as is the case with Mo, Anbar, 2004), 453
they at least approach it and are distinct from open marine oxic settings where the supply of Se 454
21
time as the global ocean evolved from an anoxic to an oxic state and the residence time of Se 456
oxyanions presumably increased. 457
458
4.3. Mid-Archean 459
Throughout the Archean, the global ocean was generally anoxic (Poulton and Canfield, 460
2011; Lyons et al., 2014a), but oxygenic photosynthesis may have created local oxygen oases 461
since at least 3.0 Gyr (Crowe et al., 2013; Planavsky et al., 2014a). Moreover, relatively high 462
levels of TOC in the absence of Fe or S mineralization in the 3.2 Gyr Soanesville Group have 463
been interpreted as potential indirect evidence of even older cyanobacterial oxygenic 464
photosynthetic activity (Buick, 2008). However, the low concentrations of Se in mid-Archean 465
sediments from the Soanesville Group and the Witwatersrand Supergroup suggest that there was 466
no significant Se flux into the ocean. It is important to note that, unlike Mo for example, Se does 467
not require H2S in the water column or in pore waters to become enriched in anoxic sediments, 468
because it can be immobilized by reduction to solid Se0. Hence the absence of H2S alone cannot 469
explain low TSe concentrations in mid-Archean sediments. Instead it is more likely that 470
atmospheric pO2 was too low for a significant oxidative weathering flux of Se into the ocean 471
(Reinhard et al., 2013a); any O2 that was biologically produced at this time (Crowe et al., 2013; 472
Planavsky et al., 2014a) was probably rapidly consumed by reductants with lower redox 473
potentials. Mid-Archean marine sediments have TSe concentrations (0.20 ± 0.13 ppm, removing 474
one outlier of 2.2 ppm from the Parktown Formation) only slightly above that of the upper crust 475
(0.09 ppm, Rudnick and Gao, 2014), but they are isotopically heavier by 0.65 ± 0.58‰. Given 476
that fluvial sediments from the Witwatersrand Supergroup are slightly lighter (+0.30 ± 0.19‰, 477
22
into the anoxic ocean, and partial reduction or adsorption occurred during fluvial transport, 479
rendering residual dissolved SeIV/VI isotopically enriched. S isotope data from the Witwatersrand 480
Basin are also consistent with a small oxidative weathering source, because they point towards a 481
crustal non-atmospheric sulfate contribution (Guy et al., 2012; Guy et al., 2014). However, we 482
cannot rule out that the Se was instead of hydrothermal or volcanic origin and that isotopic 483
fractionation occurred in the deep ocean or in volcanic eruptions. 484
485
4.4. Late Archean 486
The marked increase in average TSe concentrations in samples of the late Archean 487
Fortescue Group and the Ghaap Group and in the Kidd Creek shales (Fig. 3b), concurrent with 488
an increase in TS concentrations (Stüeken et al., 2012) (note relatively small change in TSe/TS, 489
Fig. 3c), can be due to either unusually high volcanic or hydrothermal activity or the onset of 490
oxidative Se weathering on land. A hydrothermal Se source can probably be ruled out because 491
we also find relatively high Se concentrations in the lacustrine Tumbiana Fm (Table A1), which 492
shows no evidence of hydrothermal activity (Buick, 1992). Moreover, the modern hydrothermal 493
flux of Se into the ocean (~5·105 mol/yr, Rubin, 1997) is so low compared to other sources (see 494
below) that it would have had to increase unrealistically. 495
While enhanced hydrothermal input in the late Archean cannot explain the TSe increase, 496
we are unable to distinguish unambiguously between increasing volcanism and oxidative 497
weathering as Se sources at that time. Today, volcanic eruptions generate ~1·107 mol/yr of Se, 498
including gaseous and particulate Se0, SeO2 and H2Se (Suzuoki, 1965; Mosher and Duce, 1987; 499
Wen and Carignan, 2007). On the modern Earth, this volcanic flux is much smaller than the 500
23
3.7·1016 l/yr (Henderson and Henderson, 2009) with an average Se oxyanion load of 1.5 nM 502
(Conde and Alaejos, 1997). However, this number includes uncertain anthropogenic 503
contributions, whereas organic and particulate Se are not accounted for. It is thus probable that 504
enhanced volcanism in the Precambrian dominated over the weathering flux as long as oxidative 505
weathering was muted. Isotopic Se fractionations associated with volcanic processes are 506
unknown, and so we cannot rule out that unprecedented volcanic activity caused both the rise in 507
TSe ~2.7 Gyr and the significant isotopic contrast between non-marine and marine sediments in 508
the Fortescue Group (Fig. 4b). For example, one could envision a scenario where volcanogenic 509
SeO2 dissolved in rivers proximal to the volcanic source, forming SeO32- oxyanions, which were 510
then isotopically fractionated by partial reduction during transport to the ocean. This would have 511
produced isotopically depleted Se phases in fluvio-lacustrine sediments, as observed. The 512
residual isotopically enriched Se would have been carried to the ocean and deposited in marine 513
sediments following quantitative reduction or assimilation into marine biomass. 514
However, several lines of evidence support the alternative conclusion that Se oxyanions 515
in river water were sourced from the onset of oxidative weathering rather than volcanism in the 516
late Archean. First, the volcanic flux should also have been high in the mid-Archean and there is 517
no independent evidence for a large increase in volcanic activity throughout the late Archean. 518
Second, if volcanic eruptions were massive enough to increase marine Se concentrations by 519
almost an order of magnitude, then large amounts of SeO2 should have rained out directly into 520
the ocean, so one would expect to see more negative fractionations in marine sediments. Hence 521
the isotopic gradient from non-marine to marine facies is more readily explained if Se oxyanions 522
were sourced locally in oxygen oases on land (e.g. Buick, 1992; Flannery and Walter, 2012; 523
24
Gyr (Anbar et al., 2007; Stüeken et al., 2015), concurrently with Mo and Re, which cannot be 525
explained by volcanism. Molybdenum concentrations and isotopic fractionations (Siebert et al., 526
2006; Wille et al., 2007; Kendall et al., 2010) as well as other geochemical proxies including 527
sulfur (Stüeken et al., 2012), nitrogen (Garvin et al., 2009; Godfrey and Falkowski, 2009) and 528
organic carbon isotopes (Eigenbrode and Freeman, 2006) all support mildly or locally oxidative 529
conditions in surface environments since ~2.7 Gyr, making it plausible that also some Se was 530
oxidized on land at that time. 531
Recent evidence suggests that oxidation of CrIII to CrVI may have been subdued until the 532
Neoproterozoic (Frei et al., 2009; Planavsky et al., 2014b), which may have also precluded 533
abundant production of SeVI in the earlier Precambrian because SeVI and CrVI have similar redox 534
potentials (Brookins, 1988). However, SeIV has a much lower redox potential than CrVI and SeVI 535
(Brookins, 1988) and could thus have been a stable ion in lakes and rivers and the surface ocean 536
long before the Neoproterozoic. 537
New data from the early Cambrian (Wen et al., 2014) show large Se isotopic 538
fractionations under ferruginous conditions, indicative of partial oxyanion reduction in the open 539
ocean, which suggests that although FeII is capable of reducing SeIV (Zingaro et al., 1997), the 540
reaction is evidently too slow to cause complete reduction. Thus SeIV could have been produced 541
in late Archean oxygen oases proximal to O2-producing microbial mats (e.g. Buick, 1992; 542
Flannery and Walter, 2012; Lalonde and Konhauser, 2015), and carried to the ocean in anoxic 543
FeII-dominated (Rasmussen and Buick, 1999) river systems. 544
Regardless of the whether SeIV was sourced from volcanic SeO2 or oxidative weathering, 545
and assuming that Se isotopic fractionations associated with volcanic gas phase reactions are 546
25
reduction occurred at this time, because fractionations associated with adsorption or assimilation 548
of Se (< 0.7 ‰, Johnson et al., 1999; Clark and Johnson, 2010; Mitchell et al., 2013) are too 549
small to explain the data. Both processes may, however, contribute to the observed scatter. 550
551
4.5. Paleo- and Mesoproterozoic 552
Se isotopes and concentrations in marine mudrocks do not change markedly from the late 553
Archean to the Paleo- and Mesoproterozoic. We found temporary 82/78Se enrichments up to 554
+2.01‰ in the 2.32 Gyr Pretoria Group immediately after one of the Paleoproterozoic glaciation 555
events, which may be a result of the proposed Lomagundi atmospheric O2 overshoot between 556
2.35 and 2.05 Gyr (Bekker et al., 2004; Bekker and Holland, 2012; Planavsky et al., 2012; 557
Hardisty et al., 2014; Scott et al., 2014). Intuitively, more oxidizing conditions should lead to 558
more negative values, as in the modern ocean (Section 4.2). However, it is conceivable that 559
throughout the Precambrian a large fraction of Se dissolved in rivers was organically complexed, 560
more so than today (Doblin et al., 2006), due to interaction with microbial life on land. In that 561
case, moderately high atmospheric pO2 during the O2 overshoot could have increased the 562
proportion of Se oxyanions in rivers relative to organically complexed Se. Consequently, a larger 563
fraction of fluvial Se could have been subject to reduction, such that the residue would have been 564
pushed to higher positive 82/78Se values. Alternatively, positive values could be explained by the 565
opposite effect, i.e. a smaller amount of Se oxyanions in rivers subject to a relatively larger 566
degree of partial reduction and hence more positive values in the residual dissolved fraction that 567
reached the ocean. However, in that case, large positive values up to 2‰ should be relatively 568
common in the Precambrian and concentrations in marine sediments should drop, contrasting 569
26
ocean was probably higher in the Paleoproterozoic than in the late Archean. The high 82/78Se 571
values at 2.32 Gyr may thus be an enhanced version of those recorded during the ‘whiff of 572
oxygen’ around 2.5 Gyr (Anbar et al., 2007; Stüeken et al., 2015). 573
Cr isotope data suggest that in the Paleo- and Mesoproterozoic the atmosphere was still 574
not oxidizing enough for the production of abundant CrVI (Frei et al., 2009; Planavsky et al., 575
2014b). If so, then Se oxyanions in rivers were probably still dominated by SeIV. However, initial 576
reports of Se isotopes in SeIV adsorbed to BIF of Paleoproterozoic age show very negative values 577
(Schilling et al., 2014a), consistent with non-quantitative reduction of SeVI to SeIV in seawater on 578
the outer shelf and suggesting that the surface ocean was perhaps locally more oxic than non-579
marine environments, such that SeVI was stable. But this situation still contrasts with the modern 580
ocean where marine SeIV is derived from organic-Se-II oxidation rather than SeVI reduction 581
(Cutter and Bruland, 1984). Hence the BIF data may be further evidence for a strong chemocline 582
within the Paleoproterozoic water column. Isotopically light SeIV probably adsorbed to Fe-oxide 583
particles in the photic zone and subsequently settled on the seafloor. Kerogenous shales, as 584
analyzed in this study, could have preserved the composition of the residual heavy SeVI by 585
quantitative reduction below the chemocline. 586
Late Paleoproterozoic and Mesoproterozoic Se data from the Animikie Basin, the Pine 587
Creek Inlier, the Roper Basin, the Belt Basin and the Taoudeni Basin do not show any 588
enrichments above +1.1‰ (Fig. 3a) and are generally similar to the late Archean. However, data 589
along a basinal profile in the Belt Basin, where we found more negative 82/78Se closer to the 590
major river inflow and positive values along the restricted basin margin (Fig. 4c), suggest that 591
most SeIV/VI reduction may have occurred in the ocean rather than in rivers. As surface 592
27
2014a), partial SeIV/VI reduction may thus have moved further towards the ocean. While 594
oxidative weathering in the late Archean (if it occurred) was perhaps restricted to oxygen oases 595
(Lalonde and Konhauser, 2015), it may have been more widespread in the Proterozoic, even if 596
the redox potential at those weathering sites did not increase markedly (Planavsky et al., 2014b). 597
However, Se oxyanions were probably not as well-mixed throughout the water column as they 598
are today and were perhaps more rapidly consumed on a regional scale. As in the Archean, the 599
total range of 82/78Se values in the Proterozoic is too large to be explained by adsorption or 600
assimilation alone, but these processes may contribute to the observed scatter in the data. 601
602
4.6. Phanerozoic 603
For large parts of the Phanerozoic, the marine Se cycle was probably similar to that of 604
today (Section 4.2), as indicated by the more frequent occurrence of negative 82/78Se values in 605
marine sediments from various localities and an average difference of -0.64‰ compared to 606
Proterozoic. We note that also Phanerozoic hydrothermal deposits (Rouxel et al., 2004; Layton-607
Matthews et al., 2013) are isotopically lighter than Archean counterparts from the Kidd Creek by 608
more than 1‰, suggesting that the supply of Se oxyanions from oxic seawater to hydrothermal 609
systems increased. Hence Se oxyanions were probably more abundant throughout the water 610
column, except in restricted anoxic basins. The drop in TS/TSe ratios by a factor of 4.6 (Fig. 3c) 611
in open marine sediments suggests an increase in the total Se flux into the ocean, possibly as a 612
result of increasing redox potential at weathering sites (Planavsky et al., 2014b) leading to the 613
production of SeVI rather than SeIV as in the earlier Precambrian (Sections 4.4, 4.5). Oxygenation 614
of the deep ocean in the Neoproterozoic (Canfield et al., 2007; Johnston et al., 2012; Sahoo et al., 615
28
During anoxic events, such as in the Cretaceous, the Se cycle probably reverted to its 617
Precambrian state, as shown by the gradient between negative 82/78Se values from coastal 618
samples during OAE-I and positive 82/78Se values from deep marine samples during OAE-II 619
(Mitchell et al., 2012), assuming Se sources were comparable during these events. 620
Large et al. (2014) recently reported a significant increase of Se concentration in 621
sedimentary pyrite crystals across the Precambrian-Cambrian boundary, which is not as strongly 622
reflected in our data from bulk sediments. It is conceivable that the difference between the two 623
datasets is evidence for a change in Se speciation rather than total supply. In the Precambrian, 624
most sedimentary Se was probably organic-bound, whereas in the Phanerozoic the greater 625
abundance of Se oxyanions in an oxic water column may have allowed for more dissimilatory 626
reduction and incorporation of inorganic Se-II into sulfide minerals. If so, then the contrast 627
between our whole-rock abundance data and that of the pyrite isolates presented by Large et al. 628
(2014) is perhaps further evidence for widespread ocean oxygenation in the Neoproterozoic. 629
630
Conclusions 631
Our data support several conclusions about the evolution of the Earth’s redox state and
632
the global biogeochemical Se cycle: 633
1. Concurrently rising Archean TS and TSe between 2.8 Gyr and 2.7 Gyr and the significant 634
isotopic contrast between marine and non-marine samples in the late Archean are 635
consistent with an early onset of oxidative Se weathering in locally oxygenated terrestrial 636
habitats long before the global rise of atmospheric pO2 levels during the Paleoproterozoic 637
GOE. However, we cannot disprove the possibility that both features were caused by 638
29
with volcanic eruptions are poorly known. In either case, SeIV was probably more 640
abundant than SeVI, given the inferred low abundance of CrVI (Frei et al., 2009; 641
Planavsky et al., 2014b), which has a similar redox potential as SeVI (Brookins, 1988). Se 642
oxyanions produced during weathering were partially reduced during fluvial transport to 643
the ocean. 644
2. The GOE itself (~2.4-2.3 Gyr) (Bekker et al., 2004) did not leave a marked imprint on the 645
Se isotopic or abundance record, except for perhaps a small enrichment in 82/78Se during 646
the proposed O2 overshoot between 2.35 Gyr and 2.05 Gyr (Bekker and Holland, 2012; 647
Planavsky et al., 2012; Hardisty et al., 2014; Scott et al., 2014). This may be because 648
organic complexation of Se during fluvial transport and in the ocean likely reduced the 649
maximum observed fractionation in sediments. 650
3. A relatively greater abundance of Se oxyanions may have reached the ocean in the 651
Proterozoic compared to the Archean, but reduction probably occurred along the 652
chemocline, perhaps in the vicinity of river deltas. However, our lack of data from truly 653
open marine settings, i.e. outside of epicontinental basins, makes it impossible to assess 654
how Se behaved in the oligotrophic ocean. If significant portions of the deep ocean were 655
oxic (Reinhard et al., 2013b; Ader et al., 2014), then partial SeIV/VI reduction and isotopic 656
fractionation could also have occurred offshore, similar to today. 657
4. The most notable transition in the Se isotopic record occurred at some time between the 658
Mesoproterozoic and the mid-Paleozoic, when 82/78Se values shifted from dominantly 659
positive to frequently negative. The transition between the Proterozoic and modern Se 660
cycle probably occurred during the oxygenation of the deep ocean in the Neoproterozoic 661
30
the dominant Se oxyanion in the earlier Precambrian, increasing atmospheric oxygen 663
levels in the Neoproterozoic (Planavsky et al., 2014b) may have stabilized SeVI. 664
5. In the modern ocean, sediments from localities that are well-connected to the open oxic 665
ocean are on average isotopically depleted relative to the crustal source and dissolved 666
marine SeIV/VI. Sediments from restricted anoxic basins are also lighter than dissolved 667
SeIV/VI, but slightly heavier than the crust and also heavier than open marine sediments. 668
Restricted anoxic basins may thus represent a complimentary Se isotopic reservoir to the 669
open ocean, similar to the Mo cycle (Anbar, 2004) (Fig. 6). 670
6. At no time during Earth’s history do any of the isotopes of Se show mass-independent 671
fractionation, unlike the geochemically similar element S. Either photochemical reactions 672
involving Se were not conducive to MIF, or volatile Se compounds were insignificant 673
and/or too short-lived prior to the evolution of complex eukaryotic life. 674
675
In summary, bulk Se isotope ratios in mudrocks are consistent with the generally 676
accepted view of Earth’s redox evolution (Lyons et al., 2014b), but they have somewhat limited 677
utility as a paleoredox proxy for two main reasons. First, whole rock analyses are likely to 678
represent mixtures of heterogeneous Se phases, and in many siliciclastic samples, organic Se-II is 679
probably always one of the major phases. If organic Se-II captures the composition of seawater 680
(Section 4.2), then it will mask any negative fractionations carried by inorganic Se-II or Se0. 681
Measured isotopic fractionations in whole-rocks are therefore relatively muted, in some cases 682
making it more difficult to unambiguously distinguish between oxyanion reduction and 683
adsorption or assimilation as the major fractionating mechanism. Second, Se isotopes appear to 684
31
history, except perhaps in the Phanerozoic when the total average of marine 82/78Se values is 686
close to average crust, indicating quantitative transfer between reservoirs. Without spatial 687
resolution it will thus be impossible to know the composition of Se entering a specific ocean 688
basin. Hence, results from a single site cannot readily be extrapolated to the global ocean. 689
However, detailed stratigraphic studies or large datasets, such as the one presented in this paper, 690
have the potential to reveal trends. Indeed, the most notable trend in our Se isotopic data lends 691
further support to the idea of deep ocean oxygenation in the Neoproterozoic. 692
693
Acknowledgments 694
All authors except DC contributed samples and background information, DC had the idea 695
of looking for MIF-Se, EES prepared the samples, performed the analyses, interpreted the data 696
and wrote the manuscript with advice and contributions from RB. The project was financially 697
supported by a University of Washington Royalty Research grant to RB, the National Science 698
Foundation grant EAR0921580 to RB, NASA Exobiology Program Grant NNX10AQ90G to DC, 699
and the NAI Virtual Planetary Laboratory at the University of Washington. We thank the UW 700
Isotope Geochemistry Lab and the UW Isolab for technical support. A. Knoll, B. Wing and N. 701
32
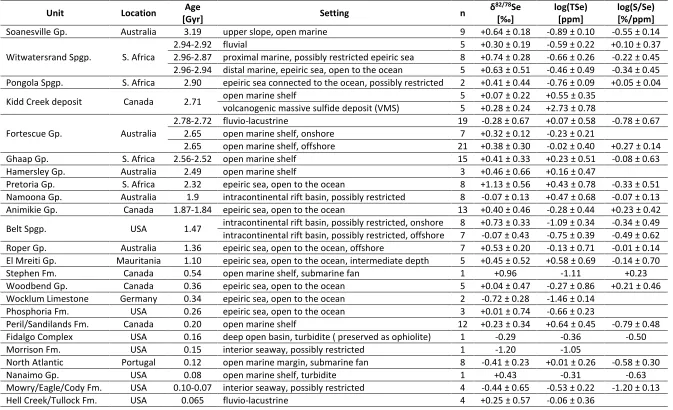
Table 1: Major stratigraphic units analyzed in this study. Uncertainties are reported as 1 . 703
Unit Location Age
[Gyr] Setting n
82/78Se log(TSe)
[ppm]
log(S/Se) [%/ppm]
Soanesville Gp. Australia 3.19 upper slope, open marine 9 +0.64 ± 0.18 -0.89 ± 0.10 -0.55 ± 0.14
Witwatersrand Spgp. S. Africa
2.94-2.92 fluvial 5 +0.30 ± 0.19 -0.59 ± 0.22 +0.10 ± 0.37
2.96-2.87 proximal marine, possibly restricted epeiric sea 8 +0.74 ± 0.28 -0.66 ± 0.26 -0.22 ± 0.45 2.96-2.94 distal marine, epeiric sea, open to the ocean 5 +0.63 ± 0.51 -0.46 ± 0.49 -0.34 ± 0.45 Pongola Spgp. S. Africa 2.90 epeiric sea connected to the ocean, possibly restricted 2 +0.41 ± 0.44 -0.76 ± 0.09 +0.05 ± 0.04
Kidd Creek deposit Canada 2.71 open marine shelf 5 +0.07 ± 0.22 +0.55 ± 0.35
volcanogenic massive sulfide deposit (VMS) 5 +0.28 ± 0.24 +2.73 ± 0.78
Fortescue Gp. Australia
2.78-2.72 fluvio-lacustrine 19 -0.28 ± 0.67 +0.07 ± 0.58 -0.78 ± 0.67
2.65 open marine shelf, onshore 7 +0.32 ± 0.12 -0.23 ± 0.21
2.65 open marine shelf, offshore 21 +0.38 ± 0.30 -0.02 ± 0.40 +0.27 ± 0.14
Ghaap Gp. S. Africa 2.56-2.52 open marine shelf 15 +0.41 ± 0.33 +0.23 ± 0.51 -0.08 ± 0.63
Hamersley Gp. Australia 2.49 open marine shelf 3 +0.46 ± 0.66 +0.16 ± 0.47
Pretoria Gp. S. Africa 2.32 epeiric sea, open to the ocean 8 +1.13 ± 0.56 +0.43 ± 0.78 -0.33 ± 0.51
Namoona Gp. Australia 1.9 intracontinental rift basin, possibly restricted 8 -0.07 ± 0.13 +0.47 ± 0.68 -0.07 ± 0.13
Animikie Gp. Canada 1.87-1.84 epeiric sea, open to the ocean 13 +0.40 ± 0.46 -0.28 ± 0.44 +0.23 ± 0.42
Belt Spgp. USA 1.47 intracontinental rift basin, possibly restricted, onshore 8 +0.73 ± 0.33 -1.09 ± 0.34 -0.34 ± 0.49
intracontinental rift basin, possibly restricted, offshore 7 -0.07 ± 0.43 -0.75 ± 0.39 -0.49 ± 0.62
Roper Gp. Australia 1.36 epeiric sea, open to the ocean, offshore 7 +0.53 ± 0.20 -0.13 ± 0.71 -0.01 ± 0.14
El Mreiti Gp. Mauritania 1.10 epeiric sea, open to the ocean, intermediate depth 5 +0.45 ± 0.52 +0.58 ± 0.69 -0.14 ± 0.70
Stephen Fm. Canada 0.54 open marine shelf, submarine fan 1 +0.96 -1.11 +0.23
Woodbend Gp. Canada 0.36 epeiric sea, open to the ocean 5 +0.04 ± 0.47 -0.27 ± 0.86 +0.21 ± 0.46
Wocklum Limestone Germany 0.34 epeiric sea, open to the ocean 2 -0.72 ± 0.28 -1.46 ± 0.14
Phosphoria Fm. USA 0.26 epeiric sea, open to the ocean 3 +0.01 ± 0.74 -0.66 ± 0.23
Peril/Sandilands Fm. Canada 0.20 open marine shelf 12 +0.23 ± 0.34 +0.64 ± 0.45 -0.79 ± 0.48
Fidalgo Complex USA 0.16 deep open basin, turbidite ( preserved as ophiolite) 1 -0.29 -0.36 -0.50
Morrison Fm. USA 0.15 interior seaway, possibly restricted 1 -1.20 -1.05
North Atlantic Portugal 0.12 open marine margin, submarine fan 8 -0.41 ± 0.23 +0.01 ± 0.26 -0.58 ± 0.30
Nanaimo Gp. USA 0.08 open marine shelf, turbidite 1 +0.43 -0.31 -0.63
Mowry/Eagle/Cody Fm. USA 0.10-0.07 interior seaway, possibly restricted 4 -0.44 ± 0.65 -0.53 ± 0.22 -1.20 ± 0.13
33
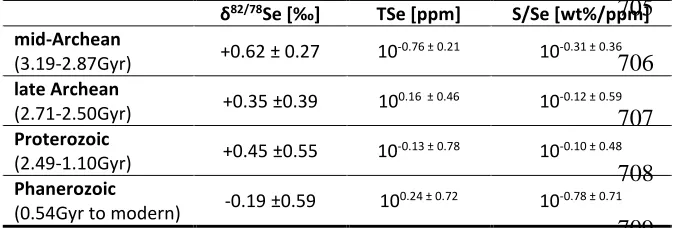
Table 2: Long-term averages of individual data points from open marine basins. 704
705 706 707
708 709
710 711
82/78S TSe [ppm] S/Se [wt%/ppm]
mid-Archean
(3.19-2.87Gyr) +0.62 ± 0.27 10
-0.76 ± 0.21 10-0.31 ± 0.36
late Archean
(2.71-2.50Gyr) +0.35 ±0.39 10
0.16 ± 0.46 10-0.12 ± 0.59
Proterozoic
(2.49-1.10Gyr) +0.45 ±0.55 10
-0.13 ± 0.78 10-0.10 ± 0.48
Phanerozoic
(0.54Gyr to modern) -0.19 ±0.59 10
34 Figure captions
712 713
Figure 1: Se isotopes in open and restricted marine basins over the last 500 kyr. The 714
compositions of the crust and the lower limit for the composition of seawater SeIV/VI are shown 715
for reference (dashed black lines). Open marine sediments (n = 96) are systematically depleted 716
where as restricted basins (n = 37) tend to preserve the composition of SeIV/VI, probably due to 717
more quantitative reduction. See text for references. 718
719
Figure 2: Mass-dependent fractionation in Se isotopes. a: 82/76Se versus 82/78Se; b: 82/77Se 720
versus 82/78Se; c: 78/74Se versus 82/78Se. One outlier with 78/74Se = -13.7‰ is not shown. 721
Residual interferences are the most likely explanation for outliers in panels b and c. We therefore 722
conclude that all four isotope pairs display mass-dependent fractionation. Error bars are 1 . 723
724
Figure 3: Whole-rock Se isotopes (a), abundances (b), and TS/TSe ratios (c) in mudrocks 725
through time. Horizontal lines mark the total marine average (solid) ± 1 (dashed) of new and 726
published data. 727
728
Figure 4: Se in selected basins. a: Witwatersrand Supergroup; b: Fortescue Group; c and d: Belt 729
Supergroup; e: Ghaap Group; f: Cretaceous Atlantic Ocean, where data from OAE-II are from 730
Mitchell et al.(2012). Error bars are 1 . 731
732