Working Paper No. 290
April 2009
Intra-and Extra-Union Flexibility in Meeting the European Union’s
Emission Reduction Targets
Richard S.J. Tol
a,b,cAbstract: The EU has proposed four flexibility mechanisms for the regulation of
greenhouse gas emissions in the period 2013-2020: (1) the Emissions Trade Scheme (ETS), a permit market between selected companies; (2) trade in non-ETS allotments between Member States; (3) the Clean Development Mechanism (CDM) to purchase offsets in developing countries; and (4) trade in CDM warrants between Member States. This paper shows that aggregate abatement costs fall as flexibility increases. However, limited flexibility creates rents so that increasing flexibility raises costs in some Member States. Costs are reduced more by the CDM than by non-ETS trade. The CDM warrants market reduces costs by a small amount only; market power is a real issue. However, the warrants market is obsolete in case there is non-ETS trade. The CDM leads to price convergence between the ETS and non-ETS market. There would be one price for carbon in the European Union if the proposed limits on CDM access are relaxed slightly.
Key words: European Union, greenhouse gas emission reduction, clean development
mechanism, permit trade
a
Economic and Social Research Institute, Dublin, Ireland
b
Institute for Environmental Studies, Vrije Universiteit, Amsterdam, The Netherlands
c
Department of Spatial Economics, Vrije Universiteit, Amsterdam, The Netherlands
Intra-and Extra-Union Flexibility in Meeting the European
Union’s Emission Reduction Targets
1. Introduction
The European Union has announced ambitious greenhouse gas emission reduction targets for 2020, even if there is no wider international agreement on climate policy. In order to achieve this goal, the EU is creating a complex regulatory regime with differentiated targets, a range of policy instruments and restrictions on their application, and a variety of fungibilities between selected parts of the regulation. As a further complication, there are separate targets and instruments for renewable energy and energy efficiency; and emission reduction policy of course interacts with other arenas, including fiscal policy, industrial policy, and agricultural policy. To an outsider, the array of measures and initiatives is bewildering and clearly violates the simple prescriptions of textbook economics. As the European Commission has yet to publish a regulatory impact assessment, it is not clear to what extent the regulatory regime creates new distortions. Nor is it clear how far current policy is removed from the cost-effective policy.1 Therefore, this paper seeks to analyze the regulatory regime – but because of the complexities, I focus on one specific part only: the market in warrants for certified emission reductions, and its interactions with the two primary markets for emission permits in the European Union.2
Certified emission reductions (CERs) are the reward for companies and governments that invest in the Clean Development Mechanism (CDM), the initiative through which rich
1
Note that the EU targets are not efficient (Tol 2007;Tol 2008).
2
Other papers focus on the artificial separation of emission reduction targets (Boehringer et al.
2006;Klepper & Peterson 2006), the interactions between abatement and other targets (Boehringer et al. 2008), the interactions between climate policy and other policies (Babiker et al. 2003;Dellink & van Ierland 2006;Fischer 2008;Palmer et al. 2007;Settle et al. 2007), the effect on climate policy on industrial
countries can finance emission abatement project in poor countries. The CDM is part of the Kyoto Protocol and thus due to expire in 2013, but something very similar is likely to be part of the international treaty that would succeed the Kyoto Protocol. If not, the EU would probably reach bilateral agreements with key countries that host CDM projects. In any case, the EU foresees a role for the CDM in its package of policies and measures to meet its targets for 2020. In fact, the EU expects that there will be an abundant supply of cheap CERs in 2020 – and in order to preserve “environmental integrity”, has placed limits on the uptake of the CDM by EU Member States. Specifically, Member States may import only 3% of their 2005 emissions as CERs, although selected Member States may buy up to 4%.3
In the proposed regulation (CEC 2008b;EP 2008), the CDM quotas of EU Member States are tradable between countries. That is, the United Kingdom, say, may purchase the right to buy CERs from Poland, say – and the UK would if its marginal costs of emission reduction are higher than in Poland. The EU has thus created a market for CER warrants.4 As with any emission permit market, this reduces the overall cost of meeting the target – but one should not forget that this market exists by virtue of artificial restrictions placed on the primary and secondary market. As with any market with a limited number of buyers and sellers (27 in this case), there may be issues of market power, rents, and reallocation of the burden of emission reduction. These issues are explored below.
Furthermore, the market for CER warrants interacts with the other markets for emission permits: the European Trading System that has been in place since 2005 and the newly created Member State exchange for non-ETS allocations (the so-called Swedish proposal). As CERs are not tied to either market, one would expect that the CDM would bring a degree of convergence between the ETS and non-ETS markets – and that the CER warrant market would bring further convergence. These issues are also addressed by the current paper.
3
The implications of this restriction are straightforward. If emission reduction in a country is more expensive at the margin than the CER price, it should buy up to its limit. It is has yet to be investigated, however, how a national government should allocate its CDM quota to the companies in its jurisdiction.
4
In Section 2, I present an analytically tractable model of emission reduction and permit trade in the European Union. The model is calibrated to the impact assessment of the 2020 targets of the European Commission. The model is simple, but captures all the relevant features. In Section 3, I investigate the properties of the market for CDM warrants and its interaction with the regulations for ETS and non-ETS emissions. Section 4 concludes.
2. The model and its calibration
2.1. The primary markets
Let us consider a market for tradable emission reduction permits with I countries. Emission reduction costs C are quadratic. Without CDM, each country solves the problem:
(1a) 2
,
min s.t.
i i i i i i i i i i i i R P C =α R Y +πP R E + ≥P E −A
where Y is gross domestic product, indexed by i; R is relative emission reduction; P denotes the amount of emission permits bought or sold; π is the emission permit price (assuming a perfect market, all companies face the same price, so there is no index); E are the emissions without emission reduction, so that E(1-R)+P are the emissions with emission reduction; A are the allocated emission permits; that is, if a country emits more than has been allocated, E>A, it will have to reduce emissions or buy permits on the market; and α is a parameter. If a country’s allocation exceeds its emissions, E<A, the optimization problem is:
(1b) 2
,
min s.t.
j j j j j j j j j j j j R P C =α R Y −πR E +πP P ≥E −A
We assume that the country sells its hot air P=E-A, and in addition reduces emissions by RE which it sells at the market for πRE. Countries with hot air are indexed by j. Countries without emission reduction targets are excluded from the market, that is CDM and similar instruments are not considered.
The first order conditions of (1) are: (2a) 2 0, 1, 2,...,
2 0, 1, 2,...,
i i i i i
j j j j
R Y E i I
R Y E j J
α λ
α π
− = =
(2b) 0, 1, 2,..., 0, 1, 2,...,
i j i I j J π λ π λ − = = − = =
(2c) 0, 1, 2,...,
0, 1, 2,...,
i i i i i
j j j
R E P E A i I
P E A j J
+ − + = =
− + = =
where λ denotes the Lagrange multiplier. This is a system with 3(I+J) equations and 3(I+J)+1 unknowns, but we also have that aggregate supply must equal aggregate demand, that is
(2d)
1 1 1
0
I J J
i j j j
i j j
P P R E
= = =
+ − =
∑ ∑
∑
which allows us to solve for the permit price π as well. (2) solves as:
(3a) 1 2 1 2
1 1
( ) ( )
2 2
I J
i i j j
i j
i I J
j i
i i j j
i j
E A E A
E E Y Y π λ α α = = = = − + − = = +
∑
∑
∑
∑
(3b) ;
2 2
j i
i j
i i j j
E E R R Y Y π π α α = =
(3c) ;
2
i
i i i i j j j
i i E
P E A E P E A Y
π α
= − − = −
So, the permit price goes up if the emission reduction obligation increases or if the costs of emission reduction increase. All countries face the same marginal costs of emission reduction, and the trade-off between reducing emissions in-house and buying or selling permits is driven by the ratio of marginal emission reduction costs and the permit price. The modelled market behaves as expected.
2.2. Certified emission reductions and the market in CDM warrants
The model in Section 2.1 was used to investigate the properties of the ETS and non-ETS markets (Tol 2009). That paper, however, omitted the Clean Development Mechanisms. This is added here.
Let us first consider the case without a CDM warrant market, and without trade in non-ETS emission allocations. There are three corner solutions. (1) The CER price is higher than the ETS price and higher than the marginal costs of non-ETS emission reduction. In this case, a Member State would not avail of its right to purchase CERs. (2) The non-ETS marginal cost is higher than the ETS price. In this case, a Member State would purchase CERs up to its 3% or 4% limit and use the CERs to lower its non-ETS emission reduction obligation. (3) The non-ETS marginal cost is lower than the ETS price. In this case, a Member State would purchase CERs up to its 3% or 4% limit and use the CERs to lower its ETS emission reduction obligation, thus reducing the ETS price for all other Member States as well. Besides the corner solutions, there may be an interior solution that mixes two or three of the above cases. Although the 3% limit on the use of CERs seems strict, the results below reveal that interior solutions are in fact quite common.
Let us now consider a market in CDM warrants. Again, there are three different corner solutions. (1) The CER price is higher than the ETS and the non-ETS price. No CERs would be bought. (2) The ETS price is higher than the non-ETS price; and the CER price is lower than the ETS price. Member States would purchase CERs up to their limit, and sell them on in the ETS market. There is no point in selling on the CDM warrant to another Member State as this would entail transaction costs but no gains. This can also be seen from Equation (3a) The ETS price is affected by the total emission allocation only – but not by the allocations to individual Member States. The ETS price determines the marginal abatement cost of all Member States, indeed equalizes them. This means that there no gains from reallocating CERs from one Member State to another. (3) The non-ETS price is higher. Member States would purchase CERs, and sell them on the non-non-ETS market. The warrant market is again defunct.
market through which ETS and non-ETS targets are re-allocated. The ETS and non-ETS markets are well able to do that.
That is, if there are markets for both ETS and non-ETS emission rights, there is no need for a market in CDM warrants. Rational actors would not trade at that market.
Note that the EU did create an ETS market, a non-ETS market, and a CDM warrant market. The warrant market is redundant. If all parties in all markets are aware of this, the warrant market is just a piece of unnecessary but otherwise innocent regulation. If not, confusion may be the result.
If there is no market for non-ETS permit, but there is a CDM warrant market, the following would happen. Let us assume that the ETS and CER prices are lower than the marginal abatement costs in the non-ETS sector in all Member States. Then, for a given supply of CERs, countries solve the problem:
(4) 2
(
)
,
min s.t. ,
i i
C W
i i i i i i i i i i i i i i i
R W C =α R Y +π D W+ +π W R E +D W+ ≥E −A W ≥ −D
where D is the maximum amount of CERs that can be used; W is the net amount of CDM warrants bought; πC is the price of CERs; and πW is the price of CDM warrants. To understand the notation, first consider W = 0. In this case, is πW ineffective and the emission abatement obligation is reduced by D. If W > 0, country i buys more CERs and has to buy CDM warrants as well; but in return reduces less at home. If W < 0, country i buys fewer CERs, sells warrants, and reduces more at home. And, of course, the amount of CDM warrants sold cannot exceed the country’s limit on CDM access D.
This has first order conditions: (5a) 2αiR Yi i− =λi 0
(5b) R Ei i =Ei− −A D Wi i− i (5c) Wi = −Di
(5d) πC +πW − −λ μi i =0 This solves as (5c) and
(6a) Ri =
(
Ei− −A Di i−Di)
Ei (6b) λi =2αi iY E(
i− −A D Wi i− i)
EiEquation (6c) relates the shadow price of the availability of CERs to its constraint. The shadow price is the willingness to pay to release the constraint at the margin, so Equation (6c) is in fact an inverse demand function. Equation (6c) is linear, so it is obvious that it doubles as an inverse supply function for those countries that would sell their CDM warrants to other countries. The market clears where πW is such that all μis are zero and
the sum total of CERs is equal to total allowed use of the CDM.
If non-ETS marginal costs are higher than the ETS price in some countries, but lower in others,5 there is an additional opportunity for arbitrage. Countries would supply a share of their CDM warrants to the non-ETS and use the remainder to buy CERs and sell them in the ETS – up to the point where the price of a CDM warrant equals the price difference between ETS and CDM. There need not be an interior solution to this, in which case all CERs go to either ETS or non-ETS.
2.3. Model calibration
The model is calibrated in four steps. The 2020 emission reduction targets are relative to 2005 emissions. We use two sets of data for total greenhouse gas emissions in 2005: the official country statistics as reported to the UNFCCC, and the emissions reported in impact assessment of the European Commission (Capros et al. 2008). See Table A1. There are substantial, unexplained differences between the data. The UNFCCC data allow for a reasonable approximation of the ETS share in the 2005 emissions.6 See Table A2. The sector detail is much less for the European Commission data, and therefore I use an upper and lower bound of the ETS share, by putting all industry emissions and all non-energy CO2 emissions inside or outside the ETS. I refer to these calibrations as EUmax and EUmin. The European Commission study reports total emissions in 2005 and 2020 as well as growth rates for ETS and non-ETS emissions. Together, this implies ETS and
5
Recall that there are countries with hot air. These countries would supply all their CDM warrants to other countries as long as the warrant price or the ETS is greater than the CER price.
6
non-ETS emissions in 2005 and 2020.7 This results in negative emissions for Denmark and Luxembourg, so I replaced the ETS share for these countries with average of the upper and lower bound. I refer to this calibration as EUmid.8 Note that EUmid does not necessarily lie in between EUmax and EUmin (see Table A2), which suggests that there are further problems with the data of Capros et al. (2008).
For 2020, I use four alternative emissions projections, viz. (1) the UNFCCC data for 2005 with the ETS and non-ETS growth rates of (Capros, Mantzos, Papandreou, & Tasios 2008); (2) the EU data for 2005 and 2020 with lower bound ETS; (3) the EU data with upper bound ETS; and (4) the EU data as calibrated above. See Table A1 for the total emissions, and Table A2 for the ETS share.
I use a single projection (Capros, Mantzos, Papandreou, & Tasios 2008) for population and Gross Domestic Product. In Western Europe, the population grows by 0.25% per year between 2005 and 2020 and the economy by 2.09%, so that GDP per capita increases by 1.84%. Southern Europe grows slightly faster, with a population growth of 0.26% and an economic growth of 2.29% per year. GDP per capita in Southern Europe thus grows at 2.03%. Southern Europe catches up with Western Europe, but only slowly. The average GDP/capita in Western Europe in 2020 is projected to be €39,170 compared on €29,702 in Southern Europe. In Eastern Europe, population is assumed to fall by 0.32% per year while the economy grows by 4.51% per year. GDP/capita grows by 4.85% per year to €12,656 in 2020.
For each of the four emissions baselines, I calibrate the unit cost parameters αi for
emission reduction in the ETS by assuming that these are proportional to the square root of the relative carbon efficiency of the economy (Rehdanz et al. 2006), as follows:
(5) i 1.57 0.17 i mini i
i i
E E
Y Y
α ∝ − −
Furthermore, I assume that π=€40/tCO2 in 2020 (Capros, Mantzos, Papandreou, & Tasios 2008). See Table A3.
7
We know that E2005 + N2005 = M2005, where E2005 are ETS emissions in 2005, N are non-ETS emissions and
M are total emissions. We also know that E2020 + N2020 = E2005(1+gE)15 + N2005(1+gM)15 = M2020 where gE is
the annual growth rate of ETS emissions, and gMof non-ETS emissions. Capros et al. (2008) report M2005,
M2020, gE and gM, so that we have two equations and two unknowns (E2005, N2005). 8
The unit cost parameters αi for non-ETS emissions are set such that the cost-effective
non-ETS emission reduction targets of (Capros, Mantzos, Papandreou, & Tasios 2008) are cost-effective in this model as well. See Table A4. For EUmid, there is a variant: I calibrate the unit cost parameters such that the marginal cost is as reported in the impact assessment of the European Commission (CEC 2008a;CEC 2008b).9 I refer to this scenario as EUprice.
3. Scenarios and results
3.1. Policy scenarios
I distinguish seven different policy cases. See Table 1. In all cases, there is trade in emission permits in the EU Emission Trading Scheme. In the first case, the ETS is the only flexibility instrument. In the second case, I add the non-tradable 1% access to CDM for selected countries, and let Member States chose whether to loosen ETS or non-ETS targets. In the third case, I add the 3% access to CDM, and let Member States freely allocate this to either the ETS or the non-ETS sector. In the fourth case, there is trade in CDM warrants between those countries that have allocated their CERs to their non-ETS emissions. In the fifth case, there is no CDM, but there is a market for non-ETS emission permits. In the sixth case, I reintroduce the 1% CDM for selected countries; and in the seventh case, I add the 3% CDM.
3.2. EU-wide results
Table 2 shows the first set of results, focusing on the total economic cost to the EU in 2020. In the central model calibration (EUmid), the economic cost amounts to 1.3% of GDP if the ETS is the only flexible instrument. The costs drop to 0.9% of GDP if the CDM is used to its maximum amount of 3% or 4% of 2005 emissions. A market for CDM warrants further reduces costs, but only marginally. 66% percent of CERs are used to offset ETS emissions, the remaining 34% is used in the non-ETS sector.
9
The impact of the CDM, however limited in size, is impressive compared to the impact of the Swedish proposal which introduces trade in non-ETS emission allotments. The Swedish proposal reduces costs to 1.2% of GDP only. Of course, costs are lowest (0.7% of GDP) if the CDM and Swedish proposal are combined. In this case, all CERs are used in the ETS market.
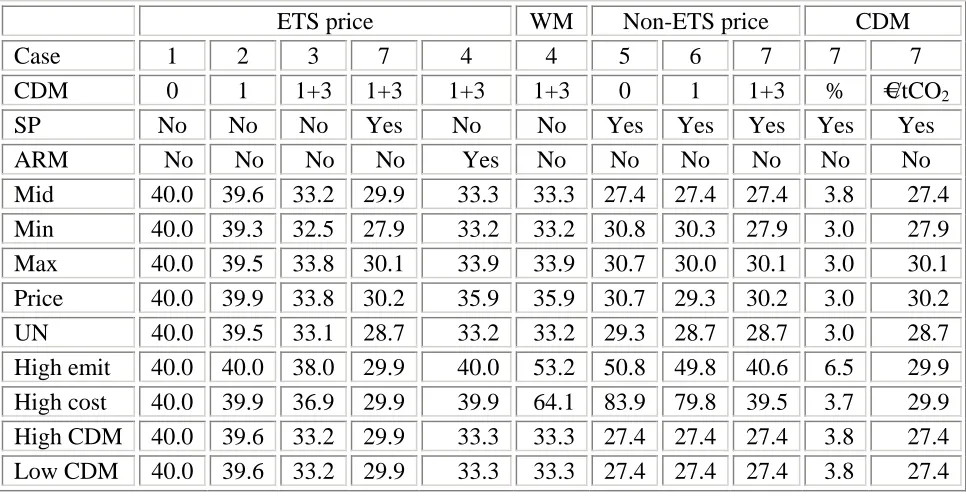
Table 3 shows the permit price. With the ETS only, the permit price is calibrated to be €40/tCO2. This falls to €35/tCO2 with CDM access, and to €30/tCO2 with both CDM and non-ETS trade – the latter result holds because trade in non-ETS allotments takes the pressure of that sector and releases CERs to the ETS. CDM warrants would trade at €23/tCO2 – that is, Member States are prepared to pay €23/tCO2 for the right to buy a CER at the assumed price of €10/tCO2/tCO2. The ETS price is €33/tCO2 in this case. In the non-ETS sector, the permit price is €27. This is always below the ETS price, so no CDM is deployed to offset non-ETS emissions (cf. Table 2). Table 3 also shows that if the CDM limit is raised from 3.0% to 3.8%, the ETS and non-ETS price are equal, that is, the emissions target is met at the lowest possible cost. The permit price is then €27/tCO2. The above results hold for one particular interpretation of the base year (2005), the no policy scenario, and the marginal abatement cost curve. Tables 2 and 3 also show results for the four alternative calibrations outlined in the previous section. The qualitative pattern in Table 2 is identical: More flexibility means lower costs, and the CDM is more effective at lowering costs than the Swedish proposal. Table 3 confirms this, but finds that the ETS price converges to the non-ETS price! In fact, if all CERs were allocated to the ETS, the ETS price would fall below the non-ETS price. That would be irrational, so CERs are shared between the two markets. Table 2 shows that less than one-third of the CERs is allocated to the non-ETS sector in the EUmin calibration, and less than one-twentieth in the other three calibrations. That is, the interaction between the three markets is such they in fact function as a single market.
reduction costs are higher. The qualitative pattern in Table 2 does not change, however. More flexibility means lower costs, and CDM access is more important than non-ETS trade. Table 3 reveals that the price of CDM warrants is well above the price of ETS permits. Consequently, all CERs are used in the non-ETS sector. For the same reason, the trade in rights to purchase CERs has a bigger effect. For instance, in the high cost case, total abatement costs are reduced from 1.4% of GDP to 1.3% of GDP. Under the Swedish proposal, CDM access reduces the marginal cost of non-ETS abatement, but the permit price stays above the ETS permit price. CDM access would have to rise from 3.0% of 2005 emissions to 3.7% (high cost case) or even 6.5% (high emissions case) for the market prices to equilibrate.
Finally, Tables 2 and 3 show what happens if the price of CERs is not €10/tCO2 but rather €5/tCO2 or €15/tCO2. The impact is minimal. Overall costs fall or rise with a higher CER price, but the effect is not very large. ETS and non-ETS permit prices are hardly affected as they are still much higher than the CER price. The only substantial impact is on the price of CDM warrants: The higher (lower) the CER price, the lower (higher) the warrant price, almost one-to-one with the CER price. The effect on abatement is muted, however, kept in check by market forces and alternative options to abate emissions. In the base case (€10/tCO2), 66.09% of CERs are used to offset ETS emissions. With a low CER price (€5/tCO2), this rises to 66.11%; with a high CER price (€15/tCO2) this falls to 65.96%.
3.3. Results per Member State
Table 4 shows the total cost of emission abatement for each of the 27 Member States in the 7 policy cases, for the EUmid calibration and for costs, projections, and CER price as in the central case.
that it cannot compete at the margin. Cyprus and Poland turn from net losers to net winners as flexibility increases, and the Czech Republic similar sees more export opportunities with increasing flexibility. On the other hand, Bulgaria, Estonia (non-ETS only), and Malta are outcompeted and see their gains of permit trade fall as flexibility increases. This implies that increased flexibility is not Pareto superior. The current regulation (ETS only) creates scarcity rents that some Member States would prefer to keep.
Table 5 shows the total allocation of CERs, and the CERs used to offset non-ETS emissions in case the ETS is the only flexibility mechanism. Without a market for CDM warrants, the pattern of ETS/non-ETS allocation essentially follows the marginal abatement costs. Countries with high (low) non-ETS abatement costs allocate all (none) of their CERs to the non-ETS sectors. For some countries, the marginal abatement costs in the non-ETS are sufficiently close to the ETS price. These countries allocate part of their CERs to the non-ETS sector, and the remainder to the ETS.
With a market for CDM warrants, the allocation changes for two reasons. First, prices and marginal costs change. This leads to a reallocation between ETS and non-ETS independent of trade per se. Belgium is an example. Second, some countries reallocate part of their CERs to the non-ETS sector for the sole purpose of selling them on to other Member States. Poland is an example.
Table 5 also shows the market shares at the market for CDM warrants. The market is concentrated both at the demand and the supply side. At the supply side, the HHI is 1665, usually a reason for concern. Poland is the biggest seller, with almost one-third of the market. The Czech Republic, Greece and Romania each have more than 10% of the market. At the demand side, concentration is even higher with a HHI of 3924. Denmark buys 58% of all warrants, Luxemburg 21% and Sweden 11%.
4. Discussion and conclusion
Clean Development Mechanism (CDM) to reduce emissions outside the EU; and (4) trade between Member States in CDM warrants. This paper considers the interactions between these four markets.
The key findings are as follows. Greater flexibility reduces overall costs. However, limited flexibility creates rents for certain Member States, which consequently may oppose increased flexibility. Access to the CDM is more effective at reducing costs than is non-ETS trade. The market in CDM warrants is small, concentrated, and relatively ineffective in case there is no trade in non-ETS allotments. If there is non-ETS trade, the CDM warrant market is superfluous. These results are robust to the calibration of the model and to the projections of future emissions. The prices of carbon in the ETS and the non-ETS sector converge due to access to the CDM. In some calibrations, convergence is compete for the proposed access limit to the CDM while in other calibrations a relatively modest extension of the limit would imply that there is a single price for greenhouse gas emissions across Member States and sectors.
The above results come with a number of caveats. The results are based on a simple model. More elaborate models would be harder to solve without adding much insight – unless, of course, interactions and complications are introduced that are omitted from the current analysis. Chief among these are EU energy policy; intra-union trade in goods and services; and interactions with fiscal, energy and agricultural policy. The current paper tacitly assumes that permit markets are perfect. I do find signs of market power for the trade of CDM warrants – but that market is obsolete. The non-ETS market may be imperfect too. The current paper also omits any discussion of how markets could and should be designed. I simply assumed that there will be functioning markets. The proposed regulations are complicated, and this increases the administrative burden of companies and regulators alike. The proposed regulations also have a number of ambiguities, the most important of which is the creation of an obsolete market. These issues will be ironed out, but they do increase regulatory uncertainty in the interim. All of these issues are deferred to future research.
and regulatory uncertainty, a set of regulations for greenhouse gas emission abatement that is close to cost-effective or perhaps even cost-effective.
Acknowledgements
I had useful discussions on the topic of this paper with Paul Gorecki and Kelley Ann Kizzier. The Ireland Environmental Protection Agency provided financial support through the STRIVE programme. All errors and opinions are mine.
References
Anger, N. (2008), 'Emissions trading beyond Europe: Linking schemes in a post-Kyoto world', Energy Economics, 30, (4), pp. 2028-2049.
Babiker, M.H., G.E.Metcalf, and J.M.Reilly (2003), 'Tax distortions and global climate policy', Journal of Environmental Economics and Management, 46, 269-287.
Benz, E. and S.Trück (2009), 'Modeling the price dynamics of CO2 emission allowances', Energy Economics, 31, (1), pp. 4-15.
Boehringer, C., T.Hoffmann, and C.Manrique-de-Lara-Penate (2006), 'The Efficiency Costs of Separating Carbon Markets under the EU Emissions Trading Scheme: A Quantitative Assessment for Germany', Energy Economics, 28, (1), 44-61.
Boehringer, C., H.Koschel, and U.Moslener (2008), 'Efficiency Losses from Overlapping Regulation of EU Carbon Emissions', Journal of Regulatory Economics, 33, (3), 299-317.
Capros, P., L.Mantzos, V.Papandreou, and N.Tasios (2008), Model-based Analysis of the 2008 EU Policy Package on Climate Change and Renewables ,E3M Lab, National Technical University, Athens.
CEC (2008a), Package of Implementation Measures for the EU's Objectives on Climate Change and Renewable Energy for 2020 -- Annex to the Impact Assessment, Commission Staff Working Document SEC(2008) 85 vol II ,Commission of the European
Communities, Brussels.
Community's Greenhouse Gas Emission Reduction Commitments up to 2020
COM(2008) 17 final ,Commission of the European Communities, Brussels.
Convery, F.J. and L.Redmond (2007), 'Market and Price Developments in the European Union Emissions Trading Scheme', Review of Environmental Economics and Policy, 1, (1), pp. 88-111.
Dellink, R.B. and E.C.van Ierland (2006), 'Pollution Abatement in the Netherlands: A Dynamic Applied General Equilibrium Assessment', Journal of Policy Modeling, 28, 207-221.
Ellerman, A.D. and B.K.Buchner (2007), 'The European Union Emissions Trading Scheme: Origins, Allocation, and Early Results', Review of Environmental Economics and Policy, 1, (1), pp. 66-87.
EP (2008), European Parliament legislative resolution of 17 December 2008 on the proposal for a decision of the European Parliament and of the Council on the effort of Member States to reduce their greenhouse gas emissions to meet the Community's greenhouse gas emission reduction commitments up to 2020C6-0041/2008 ,European Parliament, Brussels.
Fischer, C. (2008), 'Emissions Pricing, Spillovers, and Public Investment in Environmentally Friendly Technologies', Energy Economics, 30, 487-502.
Klepper, G. and S.Peterson (2006), 'Emissions trading, CDM, JI, and more: The climate strategy of the EU', Energy Journal, 27, (2), pp. 1-26.
Kuik, O.J. and R.Gerlagh (2003), 'Trade Liberalization and Carbon Leakage', Energy Journal, 24, (3), 97-120.
Mundaca, L. (2008), 'Markets for energy efficiency: Exploring the implications of an EU-wide [`]Tradable White Certificate' scheme', Energy Economics, 30, (6), pp. 3016-3043. Oikonomou, V., C.Jepma, F.Becchis, and D.Russolillo (2008), 'White Certificates for energy efficiency improvement with energy taxes: A theoretical economic model', Energy Economics, 30, (6), pp. 3044-3062.
Palmer, K., D.Burtraw, and J.-S.Shih (2007), 'The Benefits and Costs of Reducing Emissions from the Electricity Sector', Journal of Environmental Management, 83, 115-130.
Rehdanz, K. and R.S.J.Tol (2005), 'Unilateral regulation of bilateral trade in greenhouse gas emission permits', Ecological Economics, 54, 397-416.
Reilly, J.M., M.Sarofim, S.Paltsev, and R.Prinn (2006), 'The Role of Non-CO2 GHGs in Climate Policy: Analysis Using the MIT IGSM', Energy Journal (Multi-Greenhouse Gas Mitigation and Climate Policy Special Issue), 503-520.
Settle, C., J.F.Shogren, and S.Kane (2007), 'Assessing Mitigation-Adaptation Scenarios for Reducing Catastrophic Climate Risk', Climatic Change, 83, 443-456.
Tol, R.S.J. (2007), 'Europe's Long-Term Climate Target: A Critical Evaluation', Energy Policy, 35, 424-432.
Tol, R.S.J. (2008), 'The Social Cost of Carbon: Trends, Outliers and Catastrophes', Economics -- the Open-Access, Open-Assessment E-Journal, 2, (25), 1-24.
Tol, R.S.J. (2009), 'Intra-union flexibility of non-ETS emission reduction obligations in the European Union', Energy Policy, 37, (5), pp. 1745-1752.
Table 1. Policy scenarios
Casea ETS non-ETS CDM WM
1 ETS Yes No 0% n/a
2 ETS+1 Yes No 1% n/a
3 ETS+1+3 Yes No 1%+3% No
4 ETS+1+3+WM Yes No 1%+3% Yes
5 ETS+SP Yes Yes 0% n/a
6 ETS+SP+1 Yes Yes 1% n/a
7 ETS+SP+1+3 Yes Yes 1%+3% n/a a
Table 2. The total cost (in %GDP of the EU27 in 2020) of meeting the emission targets for seven different policy cases (columns) and nine different model calibration (rows). The right-most column has share of CERs allocated to the ETS in the case of the Swedish proposal with 1+3% CDM.
Case 1 2 3 4 4 5 6 7 7
CDM 0 1 1+3 1+3 0 1 1+3
WM No No No Yes No No No
SP No No No No
Share CER in ETS
Yes Yes Yes Share
Table 3. The price of emission permits (in €/tCO2) in the ETS, the warrant market for CDM, and the non-ETS, for nine alternative model calibrations and seven policy cases (cf. Table 1). The second-right-most column shows the limit to the CDM for which ETS and non-ETS equilibrate, and the right-most column the price at which the two markets equilibrate.
ETS price WM Non-ETS price CDM
Case 1 2 3 7 4 4 5 6 7 7 7
CDM 0 1 1+3 1+3 1+3 1+3 0 1 1+3 % €/tCO2
SP No No No Yes No No Yes Yes Yes Yes Yes
ARM No No No No Yes No No No No No No
Table 4. The total cost (in %GDP in 2020) per Member State of meeting the emission targets for seven different policy cases (cf. Table 1).
Case 1 2 3 4 5 6 7
CDM 0 1 1+3 1+3 0 1 1+3
WM No No No Yes No No No
SP No No No No Yes Yes Yes
Table 5. The total (1%+3%) allocation of CERs (in million metric tonne of carbon dioxide per year) per Member State, the allocation to the ETS sector (without non-ETS trade) with and without a CDM warrant market, the net purchase of CDM warrants, and the total allocation of CERs to the non-ETS sector after trade. The rightmost column gives the market share on the CDM warrants market, where negatives denote net sellers and positive net buyers.
Total Non-ETS
No WM WM
Net purchase
Total WM
Market share
Case 3, 4, 7 3 4 4 4 4
Austria 3.9 2.1 2.1 0.0 2.1 0.1%
Belgium 5.7 0.9 2.3 0.0 2.3 0.1%
Bulgaria 2.0 0.0 0.1 -0.1 0.0 -5.6%
Cyprus 0.3 0.0 0.1 0.0 0.1 -0.4%
Czechia 4.4 0.0 0.3 -0.3 0.0 -12.5%
Denmark 2.6 2.6 2.6 1.3 4.0 57.6%
Estonia 0.6 0.0 0.0 0.0 0.0 -1.6%
Finland 2.8 0.4 1.1 0.0 1.1 0.0%
France 16.8 7.9 7.7 0.0 7.7 0.7%
Germany 30.1 4.5 4.5 0.0 4.5 0.2%
Greece 4.0 0.0 0.3 -0.3 0.0 -11.4%
Hungary 2.4 0.0 0.2 -0.2 0.0 -6.8%
Ireland 3.0 3.0 3.0 0.2 3.2 7.9%
Italy 23.0 15.1 14.9 0.0 15.0 0.5%
Latvia 0.3 0.0 0.0 0.0 0.0 -0.9%
Lithuania 0.6 0.0 0.0 0.0 0.0 -1.7%
Luxembourg 0.6 0.6 0.6 0.5 1.0 20.5%
Malta 0.1 0.0 0.0 0.0 0.0 -0.3%
Netherlands 6.6 5.5 5.4 0.0 5.4 0.1%
Poland 11.2 0.0 0.8 -0.8 0.0 -32.2%
Portugal 3.5 0.0 1.0 -0.2 0.9 -7.5%
Romania 4.5 0.0 0.3 -0.3 0.0 -12.9%
Slovakia 1.5 0.0 0.1 -0.1 0.0 -4.4%
Slovenia 0.6 0.0 0.0 0.0 0.0 -1.7%
Spain 18.0 3.4 7.7 0.0 7.7 1.1%
Sweden 2.8 2.8 2.8 0.3 3.1 11.1%
UK 21.1 8.2 8.2 0.0 8.2 0.1%
Table A1. Greenhouse gas emissions (million metric tonne of carbon dioxide equivalent) in 2005 and 2020, and the average annual growth rate.
EU UNFCCC
2005 2020 growth 2005 2020 Growth Austria 97.9 104.2 0.42 93.5 98.6 0.35 Belgium 141.4 152.5 0.51 142.3 151.3 0.41 Bulgaria 65.2 68.4 0.32 70.5 73.3 0.26
Cyprus 8.6 8.5 -0.08 8.6 8.4 -0.16
Czechia 145.4 143.0 -0.11 145.9 143.8 -0.09 Denmark 66.0 64.5 -0.16 63.6 62.1 -0.16 Estonia 18.9 21.7 0.93 19.3 22.2 0.94 Finland 69.1 70.6 0.14 69.1 70.1 0.10 France 561.0 555.7 -0.06 562.9 550.5 -0.15 Germany 1003.3 999.4 -0.03 1005.4 984.3 -0.14 Greece 131.8 136.6 0.24 133.8 136.8 0.14 Hungary 78.9 90.8 0.94 80.2 91.9 0.91 Ireland 75.8 80.7 0.42 70.4 75.2 0.44 Italy 575.7 644.6 0.76 462.9 513.0 0.69 Latvia 10.8 17.8 3.39 11.0 17.8 3.28 Lithuania 19.3 23.5 1.32 13.3 16.3 1.37 Luxembourg 13.9 15.1 0.55 22.7 24.6 0.55
Malta 3.5 2.8 -1.48 3.5 3.0 -1.01
Table A2. The share of ETS in total emissions (cf. Table A1) in four alternative calibrations.
Table A3. Unit cost parameters in ETS according to five alternative calibrations; the EU27 is the weighted average, using baseline emissions as weights; the last two columns show the mean and standard deviation.
Table A4. Unit cost parameters in non-ETS according to five alternative calibrations; the EU27 is the weighted average, using baseline emissions as weights; the last two columns show the mean and standard deviation.
EUmin EUmid EUmax EUprice UNFCCC mean st.dev. Austria 26.6 17.6 17.4 25.6 22.0 21.8 4.3 Belgium 30.4 16.0 20.1 18.6 23.6 21.7 5.6 Bulgaria 81.0 65.6 70.8 65.6* 87.4 74.1 9.7 Cyprus 23.4 28.2 21.7 37.0 25.5 27.2 6.0 Czechia 58.0 51.0 33.4 51.0* 52.9 49.3 9.3 Denmark 26.7 29.9 21.0 31.1 25.7 26.9 4.0 Estonia 24.9 30.2 23.2 29.0 14.9 24.4 6.1 Finland 36.2 24.5 18.6 12.8 26.7 23.7 8.8 France 25.4 26.4 20.5 26.1 22.9 24.2 2.5 Germany 38.9 17.7 24.5 10.9 38.1 26.0 12.4 Greece 29.2 27.3 22.4 37.8 19.1 27.2 7.2 Hungary 34.3 18.3 28.8 20.2 28.2 25.9 6.6 Ireland 23.5 23.5 24.0 24.5 21.3 23.4 1.2 Italy 26.9 19.1 19.4 39.0 19.5 24.8 8.6 Latvia 17.3 12.4 14.9 43.4 15.0 20.6 12.9 Lithuania 22.5 22.2 20.9 15.0 12.8 18.7 4.5 Luxembourg 23.7 22.0 19.1 40.6 35.4 28.2 9.3 Malta 21.4 26.8 21.4 47.5 32.1 29.8 10.8 Netherlands 28.7 26.0 22.9 26.0 26.5 26.0 2.1 Poland 37.5 48.7 32.5 48.7* 31.7 39.8 8.4 Portugal 34.6 29.8 29.5 29.8* 33.0 31.3 2.3 Romania 38.7 28.3 26.5 30.2 30.9 30.9 4.7 Slovakia 38.3 27.4 25.8 24.1 32.0 29.5 5.7 Slovenia 24.9 21.0 18.7 62.8 20.3 29.5 18.7 Spain 21.7 26.7 15.7 55.3 18.3 27.6 16.1 Sweden 12.8 11.7 11.9 22.1 12.2 14.2 4.5 UK 38.7 41.3 36.8 9.8 76.6 40.7 23.8 EU27 32.4 28.2 24.8 32.0 34.7 30.4 3.9
Year Number Title/Author(s) ESRI Authors/Co-authors Italicised
2009
289 The Determinants and Effects of Training at Work:
Bringing the Workplace Back In
Philip J. O’Connell and Delma Byrne
288 Climate Feedbacks on the Terrestrial Biosphere and the
Economics of Climate Policy: An Application of FUND
Richard S.J. Tol
287 The Behaviour of the Irish Economy: Insights from the
HERMES macro-economic model
Adele Bergin, Thomas Conefrey, John FitzGerald and
Ide Kearney
286 Mapping Patterns of Multiple Deprivation Using
Self-Organising Maps: An Application to EU-SILC Data for Ireland
Maurizio Pisati, Christopher T. Whelan, Mario Lucchini and
Bertrand Maître
285 The Feasibility of Low Concentration Targets:
An Application of FUND Richard S.J. Tol
284 Policy Options to Reduce Ireland’s GHG Emissions
Instrument choice: the pros and cons of alternative policy instruments
Thomas Legge and Sue Scott
283 Accounting for Taste: An Examination of Socioeconomic
Gradients in Attendance at Arts Events
Pete Lunn and Elish Kelly
282 The Economic Impact of Ocean Acidification on Coral
Reefs
Luke M. Brander, Katrin Rehdanz, Richard S.J. Tol, and
Pieter J.H. van Beukering
281 Assessing the impact of biodiversity on tourism flows:
280 Advertising to boost energy efficiency: the Power of One campaign and natural gas consumption
Seán Diffney, Seán Lyons and Laura Malaguzzi Valeri
279 International Transmission of Business Cycles Between
Ireland and its Trading Partners
Jean Goggin and Iulia Siedschlag
278 Optimal Global Dynamic Carbon Taxation
David Anthoff
277 Energy Use and Appliance Ownership in Ireland
Eimear Leahy and Seán Lyons
276 Discounting for Climate Change
David Anthoff, Richard S.J. Tol and Gary W. Yohe
275 Projecting the Future Numbers of Migrant Workers in the
Health and Social Care Sectors in Ireland
Alan Barrett and Anna Rust
274 Economic Costs of Extratropical Storms under Climate
Change: An application of FUND
Daiju Narita, Richard S.J. Tol, David Anthoff
273 The Macro-Economic Impact of Changing the Rate of
Corporation Tax
Thomas Conefrey and John D. Fitz Gerald
272 The Games We Used to Play
An Application of Survival Analysis to the Sporting Life-course
Pete Lunn
2008
271 Exploring the Economic Geography of Ireland
Edgar Morgenroth
270 Benchmarking, Social Partnership and Higher
Remuneration: Wage Settling Institutions and the Public-Private Sector Wage Gap in Ireland
Elish Kelly, Seamus McGuinness, Philip O’Connell
269 A Dynamic Analysis of Household Car Ownership in Ireland
Anne Nolan
Greater Dublin Area
Nicola Commins and Anne Nolan
267 Resonances from Economic Development for Current
Economic Policymaking Frances Ruane
266 The Impact of Wage Bargaining Regime on Firm-Level
Competitiveness and Wage Inequality: The Case of Ireland
Seamus McGuinness, Elish Kelly and Philip O’Connell
265 Poverty in Ireland in Comparative European Perspective
Christopher T. Whelan and Bertrand Maître
264 A Hedonic Analysis of the Value of Rail Transport in the
Greater Dublin Area
Karen Mayor, Seán Lyons, David Duffy and Richard S.J. Tol
263 Comparing Poverty Indicators in an Enlarged EU
Christopher T. Whelan and Bertrand Maître
262 Fuel Poverty in Ireland: Extent,
Affected Groups and Policy Issues
Sue Scott, Seán Lyons, Claire Keane, Donal McCarthy and
Richard S.J. Tol
261 The Misperception of Inflation by Irish Consumers
David Duffy and Pete Lunn
260 The Direct Impact of Climate Change on Regional Labour
Productivity
Tord Kjellstrom, R Sari Kovats, Simon J. Lloyd, Tom Holt, Richard S.J. Tol
259 Damage Costs of Climate Change through Intensification
of Tropical Cyclone Activities: An Application of FUND
Daiju Narita, Richard S. J. Tol and David Anthoff
258 Are Over-educated People Insiders or Outsiders?
A Case of Job Search Methods and Over-education in UK
Aleksander Kucel, Delma Byrne
257 Metrics for Aggregating the Climate Effect of Different
Emissions: A Unifying Framework
Richard S.J. Tol, Terje K. Berntsen, Brian C. O’Neill, Jan S.
256 Intra-Union Flexibility of Non-ETS Emission Reduction Obligations in the European Union
Richard S.J. Tol
255 The Economic Impact of Climate Change
Richard S.J. Tol
254 Measuring International Inequity Aversion
Richard S.J. Tol
253 Using a Census to Assess the Reliability of a National
Household Survey for Migration Research: The Case of Ireland
Alan Barrett and Elish Kelly
252 Risk Aversion, Time Preference, and the Social Cost of
Carbon
David Anthoff, Richard S.J. Tol and Gary W. Yohe
251 The Impact of a Carbon Tax on Economic Growth and
Carbon Dioxide Emissions in Ireland
Thomas Conefrey, John D. Fitz Gerald, Laura Malaguzzi
Valeri and Richard S.J. Tol
250 The Distributional Implications of a Carbon Tax in Ireland
Tim Callan, Sean Lyons, Susan Scott, Richard S.J. Tol and
Stefano Verde
249 Measuring Material Deprivation in the Enlarged EU
Christopher T. Whelan, Brian Nolan and Bertrand Maître
248 Marginal Abatement Costs on Carbon-Dioxide Emissions: A
Meta-Analysis
Onno Kuik, Luke Brander and Richard S.J. Tol
247 Incorporating GHG Emission Costs in the Economic
Appraisal of Projects Supported by State Development Agencies
Richard S.J. Tol and Seán Lyons
246 A Carton Tax for Ireland
Richard S.J. Tol, Tim Callan, Thomas Conefrey, John D.
Fitz Gerald, Seán Lyons, Laura Malaguzzi Valeri and Susan
Scott
245 Non-cash Benefits and the Distribution of Economic
Welfare
244 Scenarios of Carbon Dioxide Emissions from Aviation
Karen Mayor and Richard S.J. Tol
243 The Effect of the Euro on Export Patterns: Empirical
Evidence from Industry Data
Gavin Murphy and Iulia Siedschlag
242 The Economic Returns to Field of Study and Competencies
Among Higher Education Graduates in Ireland
Elish Kelly, Philip O’Connell and Emer Smyth
241 European Climate Policy and Aviation Emissions
Karen Mayor and Richard S.J. Tol
240 Aviation and the Environment in the Context of the EU-US
Open Skies Agreement
Karen Mayor and Richard S.J. Tol
239 Yuppie Kvetch? Work-life Conflict and Social Class in
Western Europe
Frances McGinnity and Emma Calvert
238 Immigrants and Welfare Programmes: Exploring the
Interactions between Immigrant Characteristics, Immigrant Welfare Dependence and Welfare Policy
Alan Barrett and Yvonne McCarthy
237 How Local is Hospital Treatment? An Exploratory Analysis
of Public/Private Variation in Location of Treatment in Irish Acute Public Hospitals
Jacqueline O’Reilly and Miriam M. Wiley
236 The Immigrant Earnings Disadvantage Across the Earnings
and Skills Distributions: The Case of Immigrants from the EU’s New Member States in Ireland
Alan Barrett, Seamus McGuinness and Martin O’Brien
235 Europeanisation of Inequality and European Reference
Groups
Christopher T. Whelan and Bertrand Maître
234 Managing Capital Flows: Experiences from Central and
Eastern Europe
Jürgen von Hagen and Iulia Siedschlag
233 ICT Diffusion, Innovation Systems, Globalisation and
Evidence
Charlie Karlsson, Gunther Maier, Michaela Trippl, Iulia
Siedschlag, Robert Owen and Gavin Murphy
232 Welfare and Competition Effects of Electricity
Interconnection between Great Britain and Ireland Laura Malaguzzi Valeri
231 Is FDI into China Crowding Out the FDI into the European
Union?
Laura Resmini and Iulia Siedschlag
230 Estimating the Economic Cost of Disability in Ireland
John Cullinan, Brenda Gannon and Seán Lyons
229 Controlling the Cost of Controlling the Climate: The Irish
Government’s Climate Change Strategy
Colm McCarthy, Sue Scott
228 The Impact of Climate Change on the
Balanced-Growth-Equivalent: An Application of FUND
David Anthoff, Richard S.J. Tol
227 Changing Returns to Education During a Boom? The Case
of Ireland
Seamus McGuinness, Frances McGinnity, Philip O’Connell
226 ‘New’ and ‘Old’ Social Risks: Life Cycle and Social Class
Perspectives on Social Exclusion in Ireland
Christopher T. Whelan and Bertrand Maître
225 The Climate Preferences of Irish Tourists by Purpose of
Travel
Seán Lyons, Karen Mayor and Richard S.J. Tol
224 A Hirsch Measure for the Quality of Research Supervision,
and an Illustration with Trade Economists
Frances P. Ruane and Richard S.J. Tol
223 Environmental Accounts for the Republic of Ireland:
1990-2005
Seán Lyons, Karen Mayor and Richard S.J. Tol
2007 222 Assessing Vulnerability of Selected Sectors under
Environmental Tax Reform: The issue of pricing power
J. Fitz Gerald, M. Keeney and S. Scott
Richard S.J. Tol
220 Exports and Productivity – Comparable Evidence for 14
Countries
The International Study Group on Exports and Productivity
219 Energy-Using Appliances and Energy-Saving Features:
Determinants of Ownership in Ireland
Joe O’Doherty, Seán Lyons and Richard S.J. Tol
218 The Public/Private Mix in Irish Acute Public Hospitals:
Trends and Implications
Jacqueline O’Reilly and Miriam M. Wiley
217 Regret About the Timing of First Sexual Intercourse: The
Role of Age and Context
Richard Layte, Hannah McGee
216 Determinants of Water Connection Type and Ownership of
Water-Using Appliances in Ireland
Joe O’Doherty, Seán Lyons and Richard S.J. Tol
215 Unemployment – Stage or Stigma?
Being Unemployed During an Economic Boom Emer Smyth
214 The Value of Lost Load
Richard S.J. Tol
213 Adolescents’ Educational Attainment and School
Experiences in Contemporary Ireland
Merike Darmody, Selina McCoy, Emer Smyth
212 Acting Up or Opting Out? Truancy in Irish Secondary
Schools
Merike Darmody, Emer Smyth and Selina McCoy
211 Where do MNEs Expand Production: Location Choices of
the Pharmaceutical Industry in Europe after 1992
Frances P. Ruane, Xiaoheng Zhang
210 Holiday Destinations: Understanding the Travel Choices of
Irish Tourists
Seán Lyons, Karen Mayor and Richard S.J. Tol
209 The Effectiveness of Competition Policy and the Price-Cost
Margin: Evidence from Panel Data
208 Tax Structure and Female Labour Market Participation: Evidence from Ireland
Tim Callan, A. Van Soest, J.R. Walsh
207 Distributional Effects of Public Education Transfers in
Seven European Countries