Fa r m s t r u c t u r e i n Ge r m a n y – 2 0 0 5
73% of the agricultural land and 61% of livestock are in
farms of 50 ha or more
This Statistics in Focus is part of a series of country-specific publications on
the results of the Farm Structure Survey (FSS) 2005. It provides a brief but
nevertheless comprehensive insight into the farm structure in Germany. A
similar publication was issued in March 2005 presenting the results of the
FSS 2003 in Germany.
Statistics
* * *
in focus
In May 2005 in Germany, about 371.1 thousand* agricultural holdings had
an economic size of at least 1 European Size Unit (ESU).
- These holdings employed 634.7 thousand AWUs (annual work units), the
equivalent of 634.7 thousand persons working full time;
- they made use of about 17 million ha of agricultural area, which is on
average 45.7 ha per holding (compared to 43.3 ha in 2003).
Among these 371.1 thousand agricultural holdings
AGRICULTURE AND
FISHERIES
- 34% made use of less than one AWU, while 26% made use of 2 or more
AWUs;
- 19% used less than 5 ha agricultural area, while 8% used 100 ha or more;
5/2007
- 21% were holdings specialised in dairy farming, 16% were specialist
cereals, oil seed and protein crops, 9% various grazing livestock (including
sheep), 9% were engaged in combined field cropping and grazing
livestock and 8% in general field cropping;
Agriculture
- 50% of their agricultural area was situated in less favoured or mountain
areas;
- 4% were organic farms;
Authors
- 9% benefited from direct investment aid.
György BENOIST
Among the 366.2 thousand
sole holders
Pol MARQUER
- 9% were women;
- 27% were aged 55 or more, and 9% were younger than 35 years;
- 43% had another gainful activity as their major occupation.
C o n t e n t s
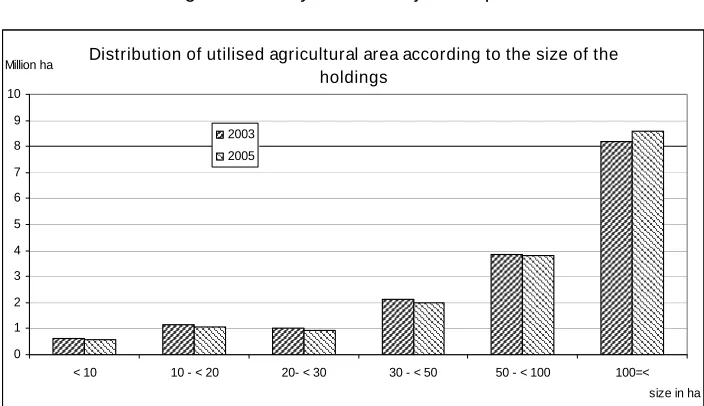
Distribution of utilised agricultural area according to the size of the holdings
0 1 2 3 4 5 6 7 8 9 10
< 10 10 - < 20 20- < 30 30 - < 50 50 - < 100 100=< size in ha Million ha
[image:1.595.4.198.3.498.2]2003 2005
Table 1 – Labour force by size
of the farms………3
Table 2 – Agricultural holdings
by size……….4
Table 3 – Land use by size of
the farms………5
[image:1.595.217.569.491.694.2]Table 4 – Livestock by size of
the farms………6
Table 5 – Subsistence farming.7
Due to differences in the threshold across Member States, the total number of farms is
not comparable between countries. This is why the present analysis, including Tables
1-4 and the graphs focus on holdings of at least one ESU. See methodological notes
for more information on the concept of the ESU.
(
#
Manuscript completed on: 19.12.2006 Data extracted on: 20.10.2006 ISSN 1977-0316
Germany 2005 – Holdings of at least 1 ESU
Non Family labour force 193290 AWUs
Agricultural labour force
Family labour force 771630 persons of which 38% women
441410 AWUs
Working full time 167750 persons
Working part time 198480 persons
Not working on farm 0 persons
Working full time 22290 persons
Working part time 189140 persons
Working full time 111880 persons
Working part time 56390 persons Working full time
25560 persons
Working part time 168410 persons
Other family members 211430 persons of which 38% women 89020 AWUs
… regular
168270 persons of which 35% women 140950 AWUs
Holders
366230 persons of which 9% women 254710 AWUs9
Spouses of the sole holders 193970 persons of which 92% women 97680 AWUs
… non regular 52340 AWUs
20 1000 persons
>= 65 55 - 64 45 - 54 35 - 44 < 35
1000 persons
men women
Family labour force
Age (years)
40 20
60 80
100 40 60 80
holders spouses other family members
Tractor use by utilised agricultural area categories
0% 20% 40% 60% 80% 100%
< 20 20 - < 50 50 - < 100 >= 100 ha
no tracto r
no t-o wned
_______________________________________________ 5/2007
—
Agriculture and fisheries—
St a t i s t i c s i n f o c u s3
#"
Germany – 2005
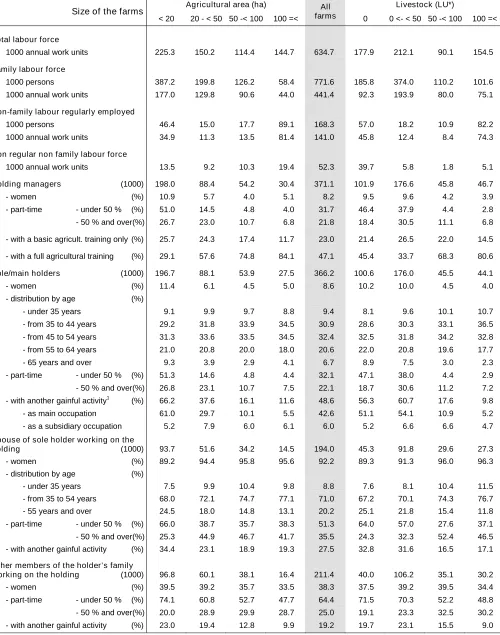
Table 1 – Labour force by size of the farms
Agricultural area (ha) Livestock (LU*)
Size of the farms
< 20 20 - < 50 50 -< 100 100 =< All
farms 0 0 <- < 50 50 -< 100 100 =<
Total labour force
1000 annual work units 225.3 150.2 114.4 144.7 634.7 177.9 212.1 90.1 154.5
Family labour force
1000 persons 387.2 199.8 126.2 58.4 771.6 185.8 374.0 110.2 101.6
1000 annual work units 177.0 129.8 90.6 44.0 441.4 92.3 193.9 80.0 75.1
Non-family labour regularly employed
1000 persons 46.4 15.0 17.7 89.1 168.3 57.0 18.2 10.9 82.2
1000 annual work units 34.9 11.3 13.5 81.4 141.0 45.8 12.4 8.4 74.3
Non regular non family labour force
1000 annual work units 13.5 9.2 10.3 19.4 52.3 39.7 5.8 1.8 5.1
Holding managers (1000) 198.0 88.4 54.2 30.4 371.1 101.9 176.6 45.8 46.7
- women (%) 10.9 5.7 4.0 5.1 8.2 9.5 9.6 4.2 3.9
- part-time - under 50 % (%) 51.0 14.5 4.8 4.0 31.7 46.4 37.9 4.4 2.8
- 50 % and over(%) 26.7 23.0 10.7 6.8 21.8 18.4 30.5 11.1 6.8
- with a basic agricult. training only (%) 25.7 24.3 17.4 11.7 23.0 21.4 26.5 22.0 14.5
- with a full agricultural training (%) 29.1 57.6 74.8 84.1 47.1 45.4 33.7 68.3 80.6
Sole/main holders (1000) 196.7 88.1 53.9 27.5 366.2 100.6 176.0 45.5 44.1
- women (%) 11.4 6.1 4.5 5.0 8.6 10.2 10.0 4.5 4.0
- distribution by age (%)
- under 35 years 9.1 9.9 9.7 8.8 9.4 8.1 9.6 10.1 10.7
- from 35 to 44 years 29.2 31.8 33.9 34.5 30.9 28.6 30.3 33.1 36.5
- from 45 to 54 years 31.3 33.6 33.5 34.5 32.4 32.5 31.8 34.2 32.8
- from 55 to 64 years 21.0 20.8 20.0 18.0 20.6 22.0 20.8 19.6 17.7
- 65 years and over 9.3 3.9 2.9 4.1 6.7 8.9 7.5 3.0 2.3
- part-time - under 50 % (%) 51.3 14.6 4.8 4.4 32.1 47.1 38.0 4.4 2.9
- 50 % and over(%) 26.8 23.1 10.7 7.5 22.1 18.7 30.6 11.2 7.2
- with another gainful activity1 (%) 66.2 37.6 16.1 11.6 48.6 56.3 60.7 17.6 9.8
- as main occupation 61.0 29.7 10.1 5.5 42.6 51.1 54.1 10.9 5.2
- as a subsidiary occupation 5.2 7.9 6.0 6.1 6.0 5.2 6.6 6.6 4.7
Spouse of sole holder working on the
holding (1000) 93.7 51.6 34.2 14.5 194.0 45.3 91.8 29.6 27.3
- women (%) 89.2 94.4 95.8 95.6 92.2 89.3 91.3 96.0 96.3
- distribution by age (%)
- under 35 years 7.5 9.9 10.4 9.8 8.8 7.6 8.1 10.4 11.5
- from 35 to 54 years 68.0 72.1 74.7 77.1 71.0 67.2 70.1 74.3 76.7
- 55 years and over 24.5 18.0 14.8 13.1 20.2 25.1 21.8 15.4 11.8
- part-time - under 50 % (%) 66.0 38.7 35.7 38.3 51.3 64.0 57.0 27.6 37.1
- 50 % and over(%) 25.3 44.9 46.7 41.7 35.5 24.3 32.3 52.4 46.5
- with another gainful activity (%) 34.4 23.1 18.9 19.3 27.5 32.8 31.6 16.5 17.1
Other members of the holder’s family
working on the holding (1000) 96.8 60.1 38.1 16.4 211.4 40.0 106.2 35.1 30.2
- women (%) 39.5 39.2 35.7 33.5 38.3 37.5 39.2 39.5 34.4
- part-time - under 50 % (%) 74.1 60.8 52.7 47.7 64.4 71.5 70.3 52.2 48.8
- 50 % and over(%) 20.0 28.9 29.9 28.7 25.0 19.1 23.3 32.5 30.2
- with another gainful activity (%) 23.0 19.4 12.8 9.9 19.2 19.7 23.1 15.5 9.0
Symbols : not available 0 less than half of the unit or nil * LU = Livestock Unit
1
[image:3.595.51.551.103.738.2]4
St a t i s t i c s i n f o c u s—
Agriculture and fisheries—
5/2007 _______________________________________________#
Germany – 2005
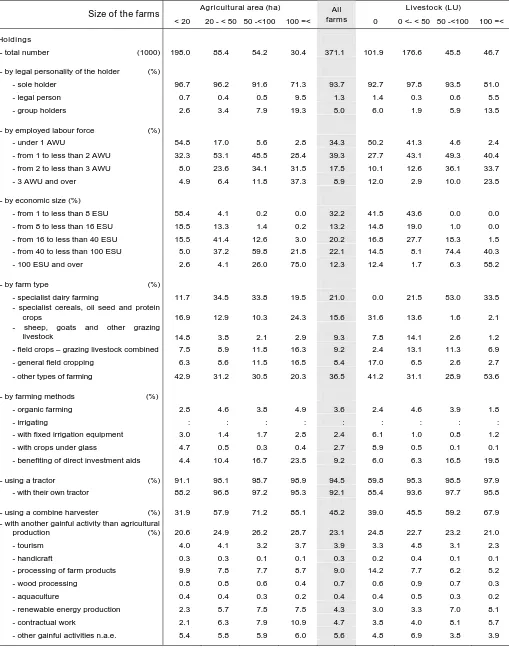
Table 2 – Agricultural holdings by size
Agricultural area (ha) Livestock (LU)
Size of the farms
< 20 20 - < 50 50 -<100 100 =< All
farms 0 0 <- < 50 50 -<100 100 =<
Holdings
- total number (1000) 198.0 88.4 54.2 30.4 371.1 101.9 176.6 45.8 46.7
- by legal personality of the holder (%)
- sole holder 96.7 96.2 91.6 71.3 93.7 92.7 97.8 93.5 81.0
- legal person 0.7 0.4 0.5 9.5 1.3 1.4 0.3 0.6 5.5
- group holders 2.6 3.4 7.9 19.3 5.0 6.0 1.9 5.9 13.5
- by employed labour force (%)
- under 1 AWU 54.8 17.0 5.6 2.8 34.3 50.2 41.3 4.6 2.4
- from 1 to less than 2 AWU 32.3 53.1 48.5 28.4 39.3 27.7 43.1 49.3 40.4
- from 2 to less than 3 AWU 8.0 23.6 34.1 31.5 17.5 10.1 12.6 36.1 33.7
- 3 AWU and over 4.9 6.4 11.8 37.3 8.9 12.0 2.9 10.0 23.5
- by economic size (%)
- from 1 to less than 8 ESU 58.4 4.1 0.2 0.0 32.2 41.5 43.6 0.0 0.0
- from 8 to less than 16 ESU 18.5 13.3 1.4 0.2 13.2 14.8 19.0 1.0 0.0
- from 16 to less than 40 ESU 15.5 41.4 12.6 3.0 20.2 16.8 27.7 18.3 1.5
- from 40 to less than 100 ESU 5.0 37.2 59.8 21.8 22.1 14.5 8.1 74.4 40.3
- 100 ESU and over 2.6 4.1 26.0 75.0 12.3 12.4 1.7 6.3 58.2
- by farm type (%)
- specialist dairy farming 11.7 34.5 33.8 19.5 21.0 0.0 21.5 53.0 33.5
- specialist cereals, oil seed and protein
crops 16.9 12.9 10.3 24.3 15.6 31.6 13.6 1.6 2.1
- sheep, goats and other grazing
livestock 14.8 3.8 2.1 2.9 9.3 7.8 14.1 2.6 1.2
- field crops – grazing livestock combined 7.5 8.9 11.8 16.3 9.2 2.4 13.1 11.3 6.9
- general field cropping 6.3 8.6 11.5 16.5 8.4 17.0 6.5 2.6 2.7
- other types of farming 42.9 31.2 30.5 20.3 36.5 41.2 31.1 28.9 53.6
- by farming methods (%)
- organic farming 2.8 4.6 3.8 4.9 3.6 2.4 4.6 3.9 1.8
- irrigating : : : : : : : : :
- with fixed irrigation equipment 3.0 1.4 1.7 2.8 2.4 6.1 1.0 0.8 1.2
- with crops under glass 4.7 0.5 0.3 0.4 2.7 8.9 0.5 0.1 0.1
- benefiting of direct investment aids 4.4 10.4 16.7 23.5 9.2 6.0 6.3 16.5 19.8
- using a tractor (%) 91.1 98.1 98.7 98.9 94.5 89.8 95.3 98.5 97.9
- with their own tractor 88.2 96.8 97.2 95.3 92.1 85.4 93.6 97.7 95.8
- using a combine harvester (%) 31.9 57.9 71.2 85.1 48.2 39.0 45.5 59.2 67.9
- with another gainful activity than agricultural
production (%) 20.6 24.9 26.2 28.7 23.1 24.8 22.7 23.2 21.0
- tourism 4.0 4.1 3.2 3.7 3.9 3.3 4.8 3.1 2.3
- handicraft 0.3 0.3 0.1 0.1 0.3 0.2 0.4 0.1 0.1
- processing of farm products 9.9 7.8 7.7 8.7 9.0 14.2 7.7 6.2 5.2
- wood processing 0.8 0.8 0.6 0.4 0.7 0.6 0.9 0.7 0.3
- aquaculture 0.4 0.4 0.3 0.2 0.4 0.4 0.5 0.3 0.2
- renewable energy production 2.3 5.7 7.5 7.5 4.3 3.0 3.3 7.0 8.1
- contractual work 2.1 6.3 7.9 10.9 4.7 3.8 4.0 8.1 5.7
- other gainful activities n.a.e. 5.4 5.8 5.9 6.0 5.6 4.8 6.9 3.8 3.9
[image:4.595.45.554.100.750.2]_______________________________________________ 5/2007
—
Agriculture and fisheries—
St a t i s t i c s i n f o c u s5
#"
Germany – 2005
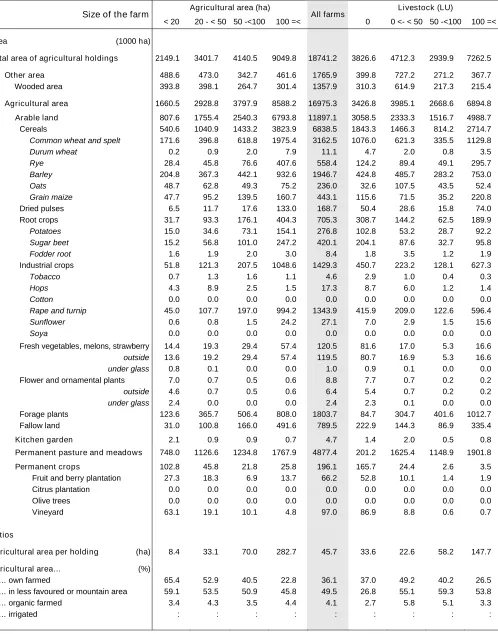
Table 3 – Land use by size of the farms
Agricultural area (ha) Livestock (LU)
Size of the farm
< 20 20 - < 50 50 -<100 100 =< All farms 0 0 <- < 50 50 -<100 100 =<
Area (1000 ha)
Total area of agricultural holdings 2149.1 3401.7 4140.5 9049.8 18741.2 3826.6 4712.3 2939.9 7262.5
Other area 488.6 473.0 342.7 461.6 1765.9 399.8 727.2 271.2 367.7
Wooded area 393.8 398.1 264.7 301.4 1357.9 310.3 614.9 217.3 215.4
Agricultural area 1660.5 2928.8 3797.9 8588.2 16975.3 3426.8 3985.1 2668.6 6894.8
Arable land 807.6 1755.4 2540.3 6793.8 11897.1 3058.5 2333.3 1516.7 4988.7
Cereals 540.6 1040.9 1433.2 3823.9 6838.5 1843.3 1466.3 814.2 2714.7
Common wheat and spelt 171.6 396.8 618.8 1975.4 3162.5 1076.0 621.3 335.5 1129.8
Durum wheat 0.2 0.9 2.0 7.9 11.1 4.7 2.0 0.8 3.5
Rye 28.4 45.8 76.6 407.6 558.4 124.2 89.4 49.1 295.7
Barley 204.8 367.3 442.1 932.6 1946.7 424.8 485.7 283.2 753.0
Oats 48.7 62.8 49.3 75.2 236.0 32.6 107.5 43.5 52.4
Grain maize 47.7 95.2 139.5 160.7 443.1 115.6 71.5 35.2 220.8
Dried pulses 6.5 11.7 17.6 133.0 168.7 50.4 28.6 15.8 74.0
Root crops 31.7 93.3 176.1 404.3 705.3 308.7 144.2 62.5 189.9
Potatoes 15.0 34.6 73.1 154.1 276.8 102.8 53.2 28.7 92.2
Sugar beet 15.2 56.8 101.0 247.2 420.1 204.1 87.6 32.7 95.8
Fodder root 1.6 1.9 2.0 3.0 8.4 1.8 3.5 1.2 1.9
Industrial crops 51.8 121.3 207.5 1048.6 1429.3 450.7 223.2 128.1 627.3
Tobacco 0.7 1.3 1.6 1.1 4.6 2.9 1.0 0.4 0.3
Hops 4.3 8.9 2.5 1.5 17.3 8.7 6.0 1.2 1.4
Cotton 0.0 0.0 0.0 0.0 0.0 0.0 0.0 0.0 0.0
Rape and turnip 45.0 107.7 197.0 994.2 1343.9 415.9 209.0 122.6 596.4
Sunflower 0.6 0.8 1.5 24.2 27.1 7.0 2.9 1.5 15.6
Soya 0.0 0.0 0.0 0.0 0.0 0.0 0.0 0.0 0.0
Fresh vegetables, melons, strawberry 14.4 19.3 29.4 57.4 120.5 81.6 17.0 5.3 16.6
outside 13.6 19.2 29.4 57.4 119.5 80.7 16.9 5.3 16.6
under glass 0.8 0.1 0.0 0.0 1.0 0.9 0.1 0.0 0.0
Flower and ornamental plants 7.0 0.7 0.5 0.6 8.8 7.7 0.7 0.2 0.2
outside 4.6 0.7 0.5 0.6 6.4 5.4 0.7 0.2 0.2
under glass 2.4 0.0 0.0 0.0 2.4 2.3 0.1 0.0 0.0
Forage plants 123.6 365.7 506.4 808.0 1803.7 84.7 304.7 401.6 1012.7
Fallow land 31.0 100.8 166.0 491.6 789.5 222.9 144.3 86.9 335.4
Kitchen garden 2.1 0.9 0.9 0.7 4.7 1.4 2.0 0.5 0.8
Permanent pasture and meadows 748.0 1126.6 1234.8 1767.9 4877.4 201.2 1625.4 1148.9 1901.8
Permanent crops 102.8 45.8 21.8 25.8 196.1 165.7 24.4 2.6 3.5
Fruit and berry plantation 27.3 18.3 6.9 13.7 66.2 52.8 10.1 1.4 1.9
Citrus plantation 0.0 0.0 0.0 0.0 0.0 0.0 0.0 0.0 0.0
Olive trees 0.0 0.0 0.0 0.0 0.0 0.0 0.0 0.0 0.0
Vineyard 63.1 19.1 10.1 4.8 97.0 86.9 8.8 0.6 0.7
Ratios
Agricultural area per holding (ha) 8.4 33.1 70.0 282.7 45.7 33.6 22.6 58.2 147.7
Agricultural area… (%)
… own farmed 65.4 52.9 40.5 22.8 36.1 37.0 49.2 40.2 26.5
… in less favoured or mountain area 59.1 53.5 50.9 45.8 49.5 26.8 55.1 59.3 53.8
… organic farmed 3.4 4.3 3.5 4.4 4.1 2.7 5.8 5.1 3.3
… irrigated : : : : : : : : :
[image:5.595.53.551.100.734.2]6
St a t i s t i c s i n f o c u s—
Agriculture and fisheries—
5/2007 _______________________________________________#
Germany – 2005
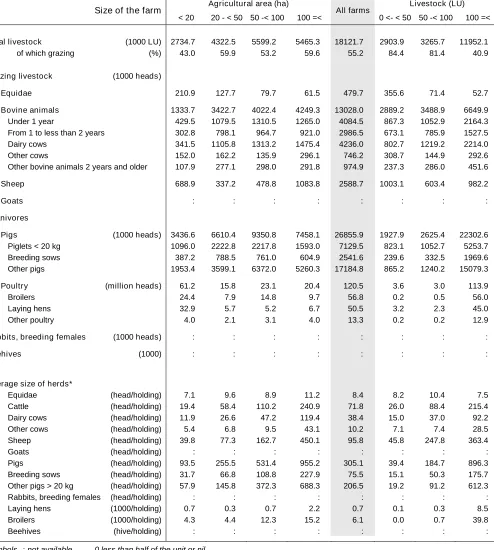
Table 4 – Livestock by size of the farms
Agricultural area (ha) Livestock (LU)
Size of the farm
< 20 20 - < 50 50 -< 100 100 =< All farms 0 <- < 50 50 -< 100 100 =<
Total livestock (1000 LU) 2734.7 4322.5 5599.2 5465.3 18121.7 2903.9 3265.7 11952.1
of which grazing (%) 43.0 59.9 53.2 59.6 55.2 84.4 81.4 40.9
Grazing livestock (1000 heads)
Equidae 210.9 127.7 79.7 61.5 479.7 355.6 71.4 52.7
Bovine animals 1333.7 3422.7 4022.4 4249.3 13028.0 2889.2 3488.9 6649.9
Under 1 year 429.5 1079.5 1310.5 1265.0 4084.5 867.3 1052.9 2164.3
From 1 to less than 2 years 302.8 798.1 964.7 921.0 2986.5 673.1 785.9 1527.5
Dairy cows 341.5 1105.8 1313.2 1475.4 4236.0 802.7 1219.2 2214.0
Other cows 152.0 162.2 135.9 296.1 746.2 308.7 144.9 292.6
Other bovine animals 2 years and older 107.9 277.1 298.0 291.8 974.9 237.3 286.0 451.6
Sheep 688.9 337.2 478.8 1083.8 2588.7 1003.1 603.4 982.2
Goats : : : : : : : :
Granivores
Pigs (1000 heads) 3436.6 6610.4 9350.8 7458.1 26855.9 1927.9 2625.4 22302.6
Piglets < 20 kg 1096.0 2222.8 2217.8 1593.0 7129.5 823.1 1052.7 5253.7
Breeding sows 387.2 788.5 761.0 604.9 2541.6 239.6 332.5 1969.6
Other pigs 1953.4 3599.1 6372.0 5260.3 17184.8 865.2 1240.2 15079.3
Poultry (million heads) 61.2 15.8 23.1 20.4 120.5 3.6 3.0 113.9
Broilers 24.4 7.9 14.8 9.7 56.8 0.2 0.5 56.0
Laying hens 32.9 5.7 5.2 6.7 50.5 3.2 2.3 45.0
Other poultry 4.0 2.1 3.1 4.0 13.3 0.2 0.2 12.9
Rabbits, breeding females (1000 heads) : : : : : : : :
Beehives (1000) : : : : : : : :
Average size of herds*
Equidae (head/holding) 7.1 9.6 8.9 11.2 8.4 8.2 10.4 7.5
Cattle (head/holding) 19.4 58.4 110.2 240.9 71.8 26.0 88.4 215.4
Dairy cows (head/holding) 11.9 26.6 47.2 119.4 38.4 15.0 37.0 92.2
Other cows (head/holding) 5.4 6.8 9.5 43.1 10.2 7.1 7.4 28.5
Sheep (head/holding) 39.8 77.3 162.7 450.1 95.8 45.8 247.8 363.4
Goats (head/holding) : : : : : : : :
Pigs (head/holding) 93.5 255.5 531.4 955.2 305.1 39.4 184.7 896.3
Breeding sows (head/holding) 31.7 66.8 108.8 227.9 75.5 15.1 50.3 175.7
Other pigs > 20 kg (head/holding) 57.9 145.8 372.3 688.3 206.5 19.2 91.2 612.3
Rabbits, breeding females (head/holding) : : : : : : : :
Laying hens (1000/holding) 0.7 0.3 0.7 2.2 0.7 0.1 0.3 8.5
Broilers (1000/holding) 4.3 4.4 12.3 15.2 6.1 0.0 0.7 39.8
Beehives (hive/holding) : : : : : : : :
Symbols : not available 0 less than half of the unit or nil
[image:6.595.56.550.104.654.2]Germany – 2005
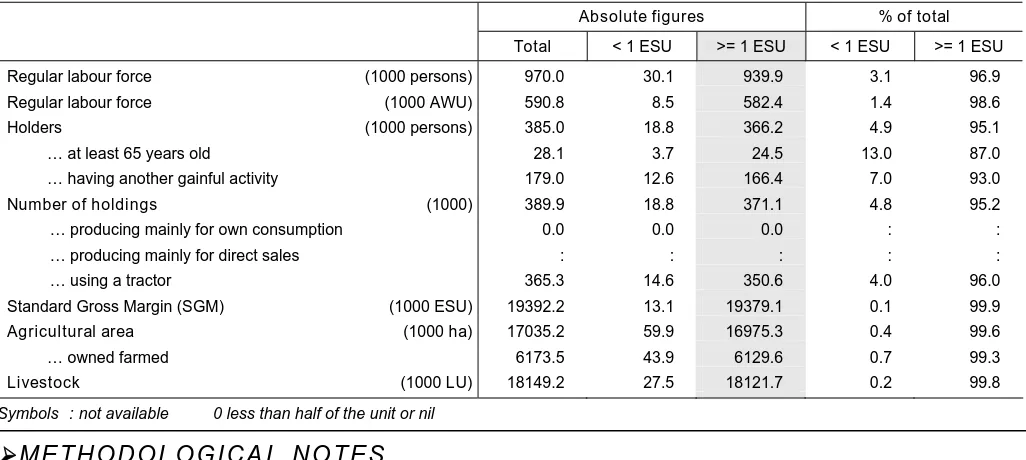
Table 5 – Subsistence farming
Absolute figures % of total
>= 1 ESU < 1 ESU >= 1 ESU Total < 1 ESU
Regular labour force (1000 persons) 970.0 30.1 939.9 3.1 96.9
Regular labour force (1000 AWU) 590.8 8.5 582.4 1.4 98.6
Holders (1000 persons) 385.0 18.8 366.2 4.9 95.1
… at least 65 years old 28.1 3.7 24.5 13.0 87.0
… having another gainful activity 179.0 12.6 166.4 7.0 93.0
_______________________________________________ 5/2007
—
Agriculture and fisheries—
St a t i s t i c s i n f o c u s7
#"
Number of holdings (1000) 389.9 18.8 371.1 4.8 95.2
… producing mainly for own consumption 0.0 0.0 0.0 : :
… producing mainly for direct sales : : : : :
… using a tractor 365.3 14.6 350.6 4.0 96.0
Standard Gross Margin (SGM) (1000 ESU) 19392.2 13.1 19379.1 0.1 99.9
Agricultural area (1000 ha) 17035.2 59.9 16975.3 0.4 99.6
… owned farmed 6173.5 43.9 6129.6 0.7 99.3
Livestock (1000 LU) 18149.2 27.5 18121.7 0.2 99.8
Symbols : not available 0 less than half of the unit or nil
ME T H O D O L O G I C A L N O T E S
"