B
UDGET
P
ERSPECTIVES
2006
Tim Callan
Aedín Doris (eds.)
Alan Barrett, Adele Bergin,
Kieran Coleman, John McHale,
Edgar Morgenroth, John Walsh
Copies of this paper may be obtained from The Economic and Social Research Institute (Limited Company No. 18269). Registered Office: 4 Burlington Road, Dublin 4.
www.esri.ie
Price €20.00
Tim Callan is a Research Professor at The Economic and Social Research Institute. Aedín Doris is at the Department of Economics, NUI Maynooth and Research Director at the Foundation for Fiscal Studies. Alan Barrett and Edgar Morgenroth are Senior Research Officers, Adele Bergin and John Walsh are Research Analysts and Kieran Coleman is a Research Assistant with The Economic and Social Research Institute. John McHale is an Associate Professor, Queen’s University, Canada.
B
UDGET
P
ERSPECTIVES
2006
Tim Callan
Aedín Doris (eds.)
Alan Barrett, Adele Bergin,
Kieran Coleman, John McHale,
Edgar Morgenroth, John Walsh
© THE ECONOMIC AND SOCIAL RESEARCH INSTITUTE
DUBLIN, 2005
The papers included here have benefited substantially from comments and suggestions offered by ESRI staff, FFS members and by the Director, Brendan Whelan. We are very grateful to our colleagues for their valuable input in this regard.
Page
Acknowledgements iv
OPENING ADDRESS
Brendan Whelan 1
Chapter
1.. ASSESSING AGE-RELATED PRESSURES ON THE PUBLIC FINANCES 2005 TO 2050
Alan Barrett and Adele Bergin 3
2. PERSPECTIVES ON RETIREMENT SAVING POLICIES IN IRELAND
John McHale 21
3. TAX EXPENDITURES
Tim Callan, John Walsh, Kieran Coleman 47
4. WASTE COLLECTION, DOUBLE TAXATION AND LOCAL FINANCE
OPENING ADDRESS
Brendan Whelan
W
ELCOMEOn behalf of the co-hosts, the Economic and Social Research Institute and the Foundation for Fiscal Studies, I would like to wish you all a warm welcome to this year’s Budget Perspectives Conference. These conferences have proved to be a very useful venue in which the context surrounding the budget can be analysed and debated, and the excellent attendance today is testimony to their on-going relevance. As usual, I should begin by reminding everyone that the views expressed are strictly those of the individual authors; neither the ESRI nor the FFS takes corporate or institutional positions in relation to any of the issues raised.
W
hile it might not seem so to the Minister, or to those helping him to frame the budget, the overall economic and fiscal situation provides more flexibility than has been the case for many previous budgets. As our first presentation, from Alan Barrett the editor of the ESRI’s Quarterly Economic Commentary, will show the immediate prospects for the Irish economy appear to be quite positive. Growth in both 2005 and 2006 is projected to be close to the long-run potential rate of about 5 per cent, recent data indicate that expansion in employment has been strong and tax revenues are buoyant. There are, of course, some threats and uncertainties, including the global imbalances in the world economy, the possibility that the unusually strong performance of the Irish construction sector might suffer a set-back and the volatility of oil prices. However, on the whole the immediate future seems quite favourable. It is appropriate, therefore, that our conference this year should focus on a range of relatively long-term issues, factors which, if given policy attention now, will yield returns for many years to come.The Overall
Economic
Situation
LONG
-
RUN PRESSURES ON THE PUBLIC FINANCES1
should be taken into account in designing current policy. Alan and Adele provide a detailed timeline illustrating the pattern of future vulnerabilities and discuss how policy instruments such as the National Pension Reserve Fund can best be utilised.
O
ur distinguished international speaker this year is John McHale, an Irishman now based in Queen’s University Canada. John takes a keen interest in developments in Ireland and is a frequent and insightful commentator on the Irish economy. His paper uses some insights from the burgeoning field of behavioural economics to make policy suggestions, applicable to Ireland’s situation, about how private saving for retirement could be significantly increased so reducing the burden on the public finances.Retirement
Saving
I
n the third presentation, Tim Callan, John Walsh and Kieran Coleman focus on a key aspect of the overall taxation system: the extent to which it is desirable utilise “tax expenditures” in the sense of tax foregone through the use of reliefs and allowances to fund desired economic and social objectives. They draw on international experience and put Ireland in comparative context. They conclude that it is very important for both policymakers and taxpayers to be aware that tax concessions have real costs, so that the tests required for direct expenditures are equally required for tax expenditures.Tax Expenditures
I
n the final presentation, Edgar Morgenroth will review the debate about user charges for refuse collection in the light of the economic literature on incentives in local service provision. He argues in favour of basing the charge on the level of service, such as on the basis of weight or volume of refuse, and presents evidence that the efficiency of waste collection in Ireland has improved as a result of greater private sector involvement.User Charges for
Waste Collection
W
e have tried to plan the morning so that there will be time for a short period of discussion after each paper as well as a general panel session at the end. I hope that the now well established tradition of lively participation in these exchanges will continue.A
SSESSING
A
GE
-R
ELATED
P
RESSURES ON
THE
P
UBLIC
F
INANCES
,
2005
TO
2050
Alan Barrett and Adele Bergin
*T
he purpose of this paper is to quantify the pressures that will be put on the public finances over the next half century as a result of population ageing. While this is an issue that has been addressed in a number of studies, this study makes a useful addition to the literature for the following reasons.1.
Introduction
• First, many of the studies have looked at individual components of the public finances, such as social welfare or long-term care, but have not considered aggregate impacts on variables such as the Exchequer deficit and the national debt. Examples of such studies include Department of Social and Family Affairs (2002a) and (2002b).
• Second, the one study that has taken an aggregate view (Department of Finance, 1998) was based on population projections that are somewhat outdated. Here, we consider both individual components of the public finances and the aggregate picture, using population projections based on the Census 2002. As improvements in life expectancy between 1996 and 2002 exceeded previous projected levels (CSO, 2004), it is important that these be captured in new projections.
• Third, the Department of Finance (1998) study was written before the introduction of the National Pension Reserve Fund. It is now important that its potential role be assessed in easing age-related fiscal pressures.
The paper is structured as follows. In Section 2, we review the literature in this area, especially as it relates to Ireland. In Section 3,
3
*
we present the baseline population projections that underpin our public finance projections. We also outline the assumptions that are used in projecting GNP out to 2050. In Section 4, we turn to the public finance projections. We begin by setting out the projected values for the various components that are most likely to be affected by population ageing – these are social welfare, health and education. We then bring the various components together to assess the overall impact of population ageing on the public finances. In Section 5, we alter some of the assumptions underlying the population projections and consider the impacts on the public finance projections. In Section 6 we conclude with some policy-related observations.
D
epartment of Finance (1998) presents possible long-term trends in the public finances out to 2056. The report includes a number of scenarios, all of which point to long-term pressures on the public finances as a result of population ageing. In the baseline scenario, the government is assumed to operate budget surpluses out to 2032 whereby the national debt becomes a national surplus (reaching 14 per cent of GNP in 2030). This leaves the Exchequer well placed to deal with the acceleration in the ageing of the population in the 2030s and 2040s although the Exchequer deficit does reach 2.3 per cent of GNP by 2050.2.
Literature
A number of alternative scenarios are presented. In one such scenario debt is held constant at 36 per cent of GNP from 2005 to 2020. In this case annual deficits rise to 12.9 per cent of GNP by 2050 and debt increases to 168 per cent of GNP in the same year. In another scenario, economic growth is assumed to be 1 per cent lower each year than in the baseline. This leads to a projected deficit of 36.1 per cent of GNP in 2050 and a debt level of 455 per cent.
This report was followed by another (Department of Finance, 1999) which recommended the setting up of the National Pension Reserve Fund (NPRF) as a way of partly pre-funding public pensions (public service and social insurance/assistance). According to calculations presented in this report, if the Fund was relied upon to bridge the gap between receipts and age-related spending, it would be exhausted by 2056 thereby creating a large funding gap in that year. Hence the Fund is only part of the solution and in our analysis below we consider what role it can play.
Other studies of long-term fiscal pressures in Ireland have looked at components of the public finances rather than the aggregate situation. Projections for Ireland included in Economic Policy Committee (2001) show spending on public service and social welfare pensions combined rising from 4.6 per cent of GNP in 2000 to 9 per cent in 2050. The projected increase of 4.4 percentage points is higher than that for the EU-15 average (3.2 per cent1). This can be partly explained by the fact that for many EU countries population ageing was already affecting spending on pensions in
2000. Average spending for the EU stood at 10.4 per cent of GNP in 2000, partly because of more generous benefits but also because of population structure. That same report also contained projections on spending for health and long-term care combined. The result for Ireland was similar to the EU average – an increase of 2.5 percentage points of GNP between 2000 and 2050 in Ireland and a EU average of 2.7 percentage points.
One other point that is worth noting from EPC (2001) is that public pension spending across the EU is expected to peak, on average, in 2040. In Ireland’s case, the projected value was at the end of the projection period and so we do not know when the peak will occur. The different pattern relates to the earlier onset of population ageing elsewhere. In the case of France, public pension spending was 12.1 per cent of GDP in 2000 and was projected to rise to 16 per cent in 2030. By 2040, this was projected to fall to 15.8 per cent. Italy shows a similar projected pattern, with public pension spending rising from 13.8 per cent of GDP in 2000 to 15.7 per cent in 2030. This largest projected increase is in the case of Greece, with spending projected to rise from 12.1 per cent of GDP in 2000 to 24.8 per cent in 2050.
Analyses of the age-related fiscal issues arise in the context of the periodic actuarial review of the Social Insurance Fund. The most recent review (Department of Social and Family Affairs, 2002a) captured the age-related fiscal pressures by estimating the required increases in contribution rates that would be needed to keep the Fund in balance. Assuming payments are indexed to earnings, it is estimated that contribution rates would have to be 240 per cent of current rates in 2056 to achieve a balance between expenditure and receipts. The report goes on to consider a situation in which payments are raised at the outset of the projection period so that the lowest benefit is equal to 27 per cent of average industrial earnings. This results in a contribution rate in 2056 that is 276 per cent of current rates if balance is to be achieved. This points to the importance of considering long-term cost implications of short-term policy changes. The report also includes an analysis of the situation in which payments are indexed to prices as opposed to earnings. This results in contribution rates in 2056 that are lower than today’s rates but this, of course, is achieved at substantially devalued benefits rates.2
A final study of relevance is of the long-term cost of long-term care for the elderly (Department of Social and Family Affairs, 2002b). This report estimates that the cost of current state provision of long-term care could rise from €513 million in 2001 to €4.2 billion in 2051 (in real terms).
2 The indexing of pension payments to prices as opposed to earnings has been
T
he population projections are generated in the following way. Beginning with the baseline year of 2002 (the year of the most recent Census), we impose assumptions on fertility, mortality and migration to produce projected numbers of males and females in each yearly age cohort out to 2050. In making assumptions, we have decided to follow closely the CSO partly to ensure some degree of comparability with other published results (CSO, 2004).3.
Population and
GNP
Projections
With regard to fertility, we assume that the total fertility rate decreases to 1.85 by 2011 and remains constant thereafter. For mortality, we assume that the rate of improvement observed between 1986 and 2002 is maintained out to 2036; from then on the rate of improvement is halved.3 This implies a life expectancy of 83.7 years for men in 2050 and 88 years for women. On migration, we assume that net inflows will be 30,000 in 2005 and 2006, 20,000 on average annually between 2006 and 2010, 10,000 on average annually between 2011 and 2015 and 5,000 annually thereafter.
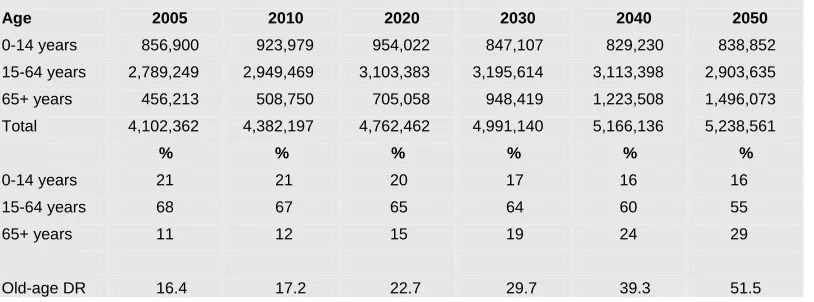
[image:12.499.48.455.425.576.2]The headline results from the projections are shown in Table 1. Looking firstly at the total population, it is projected to increase from 4.1 million in 2005 to 5.2 million in 2050, an increase of 28 per cent. For the purposes of this paper, what is of greater interest is the change in the structure of the population. In 2005, 11 per cent of the population is aged 65 and over. This proportion increases gradually to 12 per cent by 2010 but then grows more rapidly, rising to 29 per cent of the population by 2050. Hence, the ageing of the population is readily observable. An alternative view of this can be taken by looking at the relative sizes of the old-age and working-age4 populations, i.e. the old-age dependency ratio. This increases from 16.4 per cent to 51.5 per cent.
Table 1: Population Structure 2005-2050
Age 2005 2010 2020 2030 2040 2050
0-14 years 856,900 923,979 954,022 847,107 829,230 838,852
15-64 years 2,789,249 2,949,469 3,103,383 3,195,614 3,113,398 2,903,635
65+ years 456,213 508,750 705,058 948,419 1,223,508 1,496,073
Total 4,102,362 4,382,197 4,762,462 4,991,140 5,166,136 5,238,561
% % % % % %
0-14 years 21 21 20 17 16 16
15-64 years 68 67 65 64 60 55
65+ years 11 12 15 19 24 29
Old-age DR 16.4 17.2 22.7 29.7 39.3 51.5
3 There is one exception to this assumption – for 20-29 year olds, the improvement
in mortality between 1996 and 2002 is used.
4 We define “working age” to be 15-64 years although our GNP projections below
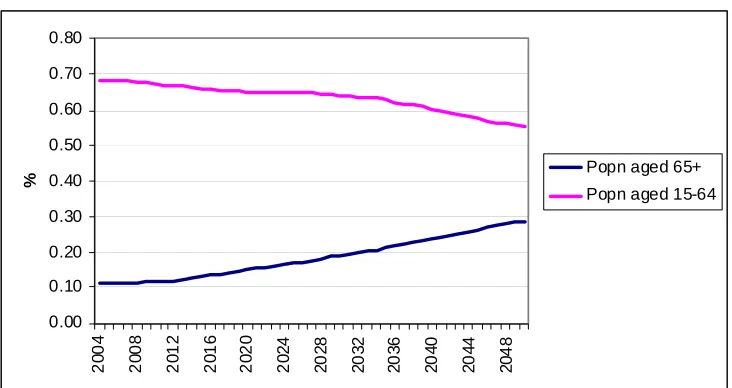
In Figure 1, we provide a graphical representation of how the percentages of the population age 65 years and over and between 15 and 64 years will evolve out to 2050. The pattern is clear and the reason for age-related fiscal pressures is readily apparent, with the proportion of the older group rising and the proportion of working age people falling.
Figure 1: Per Cent of Population Aged 15-64 years and 65+years, 2004 to 2050
n life expectancy have exceeded earlier expectations, thereby making the po
, we show all figures as proportions of GNP. At this point, we 0.00 0.10 0.20 0.30 0.40 0.50 0.60 0.70 0.80 20 04 20 08 20 12 20 16 20 20 20 2 4 20 28 20 32 20 36 20 40 20 44 20 4 8
% Popn aged 65+
Popn aged 15-64
We noted in the Introduction that improvements i
pulation projections underpinning earlier studies (such as Department of Finance, 1998 and EPC, 2001) out-dated. We can illustrate the difference by noting that the population projections in Department of Finance (1998) saw the percentage of the population aged 65 years and over rising to 27 per cent by 2056; based on the assumptions used here, the corresponding figure in 2056 would be 29 per cent. Making a similar comparison but in terms of old-age dependency ratios, the Department of Finance (1998) value for 2056 was 53 per cent whereas our assumptions lead to a value of 58 per cent.5
When presenting projections for the public finances in the next section
will set out the approach and assumptions used in generating a GNP series out to 2050. We should stress that the approach used here differs from the approach used in short-term forecasting exercises such as the ESRI’s Quarterly Economic Commentary. As our interest is in the long term, we only attempt to project the long-run trend in national output. Actual output in the short and medium term will fluctuate around potential but we make no effort to capture this.
5 These old-age dependency ratios are based on the population aged 19-64 years
The main building blocks in our GNP series are employment growth and productivity growth. By combining these with the bas
each yearly age
we need to impose an unemployment rate. In doing this we dra
2032, wit
3). They forecast that productivity growth will ave
ity growth in the next year, GNP in real terms in the next yea
eline value for GNP in 2004, it is straightforward to generate a series. However, in order to produce figures for employment growth and productivity growth, more assumptions are needed.
We generate employment growth in the following way. Our population projections provide the number of people in
cohort by gender out to 2050. By applying age specific participation rates, we can generate a labour force series. In the case of men, we assume that participations rates will not change over the projection period. However, in the case of women, it seems reasonable to assume that some increase will occur. We have chosen to assume that for the age groups 35-44 years and 45-55 years, the Irish female labour force participation rates will converge towards those of the EU-15 by 2015. For the age group 35-44 years, the current participation rate is 0.66 with the EU-15 figure being 0.77. The corresponding figures for the 45-54 year age group are 0.6 and 0.71.
In order to move from a labour force series to an employment series,
w on Bergin et al. (2003); they forecast that the unemployment rate will fall from its current level of 4.3 per cent to 4 per cent in 2015. We assume that it will then stay at that level out to 2050.
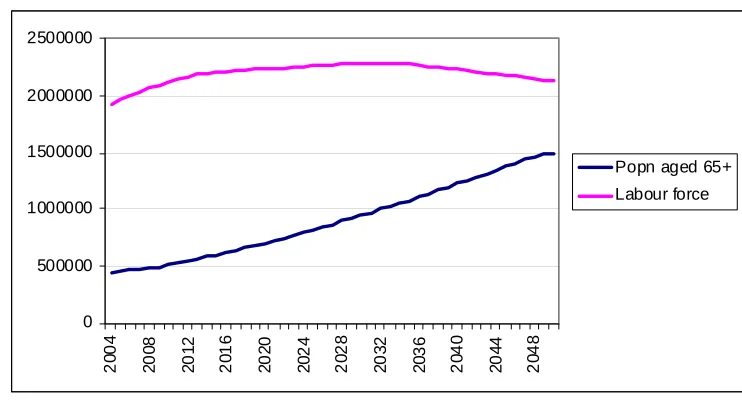
These assumptions lead to a projected labour force out to 2050 as shown in Figure 2. The labour force peaks at 2.29 million in
h the increase between 2005 and 2032 being partly driven by the increases in female participation (up to 2015) and partly by increases in those of working age (up to 2032). While the working age population is increasing up to 2032 it should be remembered that the population aged 65 years and over is increasing at a faster rate and so the working age population is declining as a share of the total (as shown in Table 1 and Figure 1 above). After 2032, the labour force declines while the population aged 65 years and over continues to increase. It should also be noted that the aggregate participation rate declines over time as more people move into the 55-64 year age bracket and hence are assumed to have a lower age-specific participation rate.
For assumptions on productivity growth, we draw again on Bergin et al. (200
rage 3 per cent out to 2010 and 2.3 per cent between 2011 and 2020. Thereafter, we assume annual productivity growth rates of 2 per cent.
By multiplying GNP from one year by employment growth and productiv
Figure 2: Projec
ly to be aff population ageing, namely, social welfare, health and
tion. The fourth heading is the total budget where we bring
Revised Estimates for Public Expenditure 2005
(Department of Finance, 2005 hereafter referred to as REV 2005), rent year under both social
tributory) old-age
• t pension;
change pulation aged 65 years and over. We also index to bo h nges in real earnings, thereby building in
the nts under these programmes increase in
line wit ings in the economy. In Table 2, we show the our baseline projections under four headings. The ly to be aff population ageing, namely, social welfare, health and
tion. The fourth heading is the total budget where we bring
Revised Estimates for Public Expenditure 2005
(Department of Finance, 2005 hereafter referred to as REV 2005), rent year under both social
tributory) old-age
• t pension;
change pulation aged 65 years and over. We also index to bo h nges in real earnings, thereby building in
the nts under these programmes increase in
line wit ings in the economy. In Table 2, we show the ted Labour Force and Population aged 65+ years, 2005-2050
W
e will set out our baseline projections under four headings. The first three relate to the areas of spending which are most like4.
first three relate to the areas of spending which are most like4.
Baseli
0 500000 1000000 1500000 2000000 2500000 20 0 4 20 08 20 12 20 1 6 20 20 202 4 20 2 8 20 32 203 6 20 4 0 20 44 20 4 8Popn aged 65+ Labour force
ne Results
ected by ected byeduca
together all elements of the public finances, including the National Pensions Reserve Fund.
4.1
SOCIAL WELFAREIn projecting social welfare expenditure out to 2050, we took the following approach. The
educa
together all elements of the public finances, including the National Pensions Reserve Fund.
4.1
SOCIAL WELFAREIn projecting social welfare expenditure out to 2050, we took the following approach. The
provides spending figures for the cur provides spending figures for the cur
insurance and social assistance headings. Within each of these, the specific programmes are listed. This allows us to take the figures for spending on those aged 65 years and over and to project these figures forward indexing to the change in the population aged over 65 years. The programmes that we include are as follows:
• non-contributory old-age pension;
• widows’, widowers’ and orphans’ (non-contributory) old-age pension;
• contributory old-age pension;
• widows’, widowers’ and orphans’ (con
• widows’, widowers’ and orphans’ (con pension;
retiremen pension; retiremen
• free schemes.
• free schemes.
As mentioned, we index spending under each to the percentage in the po
As mentioned, we index spending under each to the percentage in the po
th t e deflator and to cha ayme th t e deflator and to cha
ayme assumption that p
h average earn assumption that p
projected trend in spending across these six programmes out to 2050. The rise in spending as a percentage of GNP can be seen and also the acceleration. Although the figures reported in the EPC (2001) on public pensions are based on slightly different definitions and assumptions, it is interesting to note the trebling in spending projected here as opposed to the doubling projected in EPC report (see Section 2 above). This can be explained in part by improving mortality, as noted in the Introduction.
Table 2: Projected Old-age Social Welfare Spending (Assistance and Insurance) 2005-2050, Per Cent of GNP
2005 2010 2020 2030 2040 2050
Old-age SW as % of
GNP 3.1 3.2 4.2 5.5 7.3 9.3
e the old-age spending within the social
Whil welfare budget has
ceived attention in rcises such as Departm
hi te nd th m o d
eceived less attention. But clearl hanging age structure of the population suggests the possibility of sav
re exe
01), c ent of Fie for f chilnance (1998) and EPC (20
benefit payments) have rld-rela d spe ing (in y, the c
ings in the child-related area which may offset to some degree increased spending pressures in the area of old-age spending. In order to explore this issue, we take the spending figure for child benefit from the REV 2005 and index it to changes in the population aged 0-17 years out to 2050. We also index to our assumed values of the deflator and productivity, on the assumption again that payments rise in line with nominal earnings. The projections are presented in Table 3. While the payments are projected to fall as a percentage of GNP, the fall is modest. In order to understand why this is so, it is useful to look back at Table 1 and to note that while the proportion of children in the population is falling, so also is the proportion in the standard working age population.
Table 3: Projected Spending on Child Benefit, 2005-2050
2005 2010 2020 2030 2040 2050
Child benefit as % of GNP 1.5 1.4 1.4 1.3 1.2 1.3
In Table 4, we add together the old-age and c
spending projections and also projections of the remainder ohild-related f the
social assistance and so s ts he o
p ents, we sim ind o t han the otal population and to nominal earnings. Overall, it can be seen tha
cial in urance budge . In t case f the non-child/non-old-age aym ply ex t he c ge in
t
[image:16.499.157.450.617.647.2]t spending is projected to rise from 9.2 per cent of GNP in 2005 to 16 per cent in 2050, a rise of 6.8 percentage points.
Table 4: Projected Total Social Welfare Spending 2005-2050
2005 2010 2020 2030 2040 2050
Social welfare spending
4.2
HEALTHvely obvio at ati eing will have an impact on health spending, the literature in this area suggest at this may not in fact be the case. Empirical studies relating changes in health spending across countries to different rates of g have generally failed to find a relationship (for
he figure is indexed to the deflator. In both cases, spending per under 65 years While it might seem intuiti us th popul on ag
th
population agein
example, see Barros (1998)). The explanation most frequently offered to explain this is that health spending is more strongly related to proximity to death (in particular in the last year of life) rather than age per se. As population ageing is related to reduced mortality, an increasing older population does not necessarily imply an increased population who are in their last year of life. The literature would also suggest that any impact of population ageing on health spending will be less than the potential impact of technological advances.
The approach we take does factor in an ageing component into the projections on the assumption that the intuitive expectation is at least partly correct. But we acknowledge the possibility that this may over-state future pressures on health spending and compensate by not attempting to capture the spending pressures related to technological progress.
The starting point for our projection is to take the REV 2005 figure for the Health Services Executive, less the amount for long-term care of the elderly and an amount for pensions as these are projected separately (see below). The figures in the REV show that two-thirds of this figure is related to pay so we divide the total into a pay and non-pay component in a two-thirds/one-third ratio.
In order to allow us to factor in ageing we need some sense of the relative spending by age group. This is not readily available so instead we need to infer this using information from HIPE and NPRS Units, ESRI (2002). Data presented in this publication show those aged 65 years and over using hospital beds six times more intensively than those aged less than 65 years. Clearly, hospital bed usage is only one dimension of health service usage but in the absence of other data, this 6:1 ratio drives our forecasts.6
The projections are generated in the following way. We divide total spending in 2005 on the Health Services Executive (pay and non-pay separately) by the population aged under 65 years plus six
times the population aged 65 years and over. This gives us a value for
spending per under 65 years equivalent. In the case of pay, this figure is indexed to nominal earnings; in the case of non-pay, t
6 OECD (1987) suggests that a rule of thumb in apportioning health spending
equ
a rate fast
ivalent is multiplied by the number of people aged under 65 years plus six times the number of people aged over 65 years.
The results are presented in Table 5. Starting at 7.7 per cent of GNP in 2005, spending falls out to 2010 and then begins to rise. After 2030, the rise accelerates with spending reaching 11.2 per cent of GNP by 2050. As discussed above, although our projections may over-state the impact of ageing, they almost certainly under-state the impact of technological change. One way of factoring this impact into the analysis is to allow the non-pay component to rise at
er than the GNP deflator. If non-pay “health inflation” is assumed to be 1 percentage point higher each year out to 2050, health spending as a percentage of GNP in 2050 would be 12.1 per cent.
Table 5: Projected Health Spending 2005-2050
2005 2010 2020 2030 2040 2050
Health spending as %
of GNP 7.7 7.4 7.9 8.6 9.8 11.0
4.3
EDUCATIONAs noted in the Introduction, much of the
population ageing has focused on the analysiswork in the area of on spending that is likely to increase. How as r of la eing is a
oun on, it is necessary
spending on young people to if t s
pressures for increased spending. We have nding on child benefit and in this sub-section
Table 6. Spending is projected to
ever, the co ollary popu tion ag
relatively smaller y g populati to look at
see here are likely to be saving which can offset the
already looked at spe we will consider education.
In projecting spending on education, we begin by taking the REV 2005 figures for first, second and third level spending. Each of the three is then indexed to nominal wage growth and to changes in the population in the respective age category. The balance (less pensions) is indexed to nominal GNP growth (which, of course, is equivalent to keeping it constant as a share of nominal GNP). The results of the projection are shown in
fall from 5.1 per cent of GNP in 2005 to 4.3 per cent in 2050. This saving of 0.7 percentage points is clearly small relative to the projected spending increases in social welfare and health. Even when combined with the projected saving on child benefit (0.2 percentage points of GNP, as shown in Table 3, the youth-related spending reduction is less than 1 per cent of GNP. What is more, the implicit assumptions in this projection include no increase in participation and no improvements in service quality. Both are likely to be violated and so spending on education in 2050 may well exceed the projected 4.3 per cent of GNP, thereby removing most and if not all of the potential saving.
Table 6: Projected Education Spending 2005-2050
2005 2010 2020 2030 2040 2050
Education Spending
4.4
TOTAL BUDGETHaving looked at each component of public spending, we now turn roduce a measure f the overall pressure on the public finances as a result of ageing.
e appro ou to th sh ns
ee what would happen to t
deficit a tional deb er time. The blem with pr h d deficit figures that are unrealistic and so this reason, we take another approach. We
ve approach. On the basis of our assumptions, spe
ntly 5 per cent of GNP, a level that is substantially higher tha
this will occur is difficult. We assume that this will hap
to the total budget. Our goal in this section is to p o
One possibl ach w ld be hold e tax are co tant at the 2005 level and
nd na to st ov pro he Exchequer this ap oac is that it leads to debt an
difficult to interpret. For
ask what tax share, if held constant out to 2050, would ensure that the Exchequer deficit does not exceed 5 per cent in 2050 and use this as a measure of age-related fiscal pressure. In order to determine the “sustainable” tax share, we need projections on all elements of the public finances. At this point, we set out here how we produced the projections for the items not yet discussed and present the figures in Table 7.
Spending on long-term care for the elderly is indexed to changes in the population aged 65 years and over and to nominal earnings. This may well be a conservative approach to projecting spending on this area because Ireland’s system of long-term care is currently based more on informal care-giving relative to elsewhere. An increase in formal care, such as through nursing homes, would see spending rise even in the absence of population ageing. Here, we take the conservati
nding on long-term care for the elderly would rise from 0.8 per cent of GNP to 2.4 per cent in 2050.
Public sector pensions have been modelled by drawing on the work on the Commission on Public Service Pensions (2000). The category “rest of gross voted” is a residual and is indexed to nominal GNP. Debt interest is calculated as being 6 per cent of the National Debt in the preceding period. Given our assumed deflator of 2 per cent, this means we are assuming a long-term interest rate of 4 per cent. The remainder of Central Fund spending is indexed to nominal GNP.
Summing across the expenditure categories gives gross current expenditure. From this, we need to subtract appropriations-in-aid so as to arrive at net current expenditure. In the case of contributions to the Social Insurance Fund, we assume a growth rate equal to nominal GNP.
With regard to capital expenditure, there is one important assumption that needs to be set out. Gross voted capital expenditure is curre
n in other developed economies. This high level reflects the Government’s commitment to reducing Ireland’s infrastructural deficit. Once the deficit has been filled, it will be possible to reduce spending on infrastructure to more usual levels. However, anticipating when
nominal GNP. In this case of the NPRF, this is in accordance with the relevant legislation that requires that a contribution of 1 per cent of GNP be made up until 2055, even through withdrawals can begin in 2025.
There is a range of other elements of the public finance that are not shown in Table 7 but which are used when calculating the tax rate needed for sustainable public finances. Hence, we need to outline how we handle these in the projections. For capital revenues, we keep them constant as a percentage of GNP except in the case of receipts from the National Pensions Reserve Fund. No withdrawals are allowed until after 2025. Thereafter, we initially assume a withdrawal rate of 3 per cent per annum. Our choice of this per
ed the
ment Balance.
tal gross spending is pro
centage is somewhat arbitrary and is based on the Fund having a value of 50 per cent of GNP at the end of our projection period.
The remaining elements are as follows. A “contingency” item is included in order to be consistent with the Department of Finance practice in providing budget projections. As noted in the tables accompanying Budget 2005 “… a prudent contingency provision is made against factors outside the control of government that may impact upon the Budget but which cannot be foreseen” (Department of Finance, 2004, p. D.6). We have taken the Department of Finance figures for 2006 and 2007 and have index
2007 figure to nominal GNP – this implies a contingency of 1 per cent of GNP out to 2050.
The national debt figure is generated by adding the Exchequer balance each year. The debt interest is included in the expenditure figure as discussed above. The NPRF figure is generated by adding contributions, subtracting outflows and adding in interest earned. As was the case with interest on the national debt, we assume a long-term real interest rate of 4 per cent. This interest earned is also factored into the analysis in the movement between the Exchequer balance and the General Govern
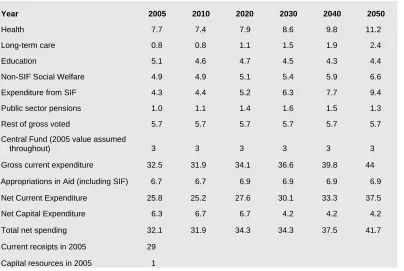
Table 7 contains our projections for all elements of public spending out to 2050 and receipt figures for 2005. It should be noted that the Central Fund figure is not a projection. As interest payments on the national debt form a significant part of this figure, this item would increase to an unrealistic level if the tax share was kept at 30 per cent. When calculating the sustainable tax share, the Central Fund is allowed to vary in line with interest payments. Taking that qualification, it can be seen that to
jected to rise from 32.5 per cent of GNP in 2005 to 44 per cent of GNP in 2050, with net spending rising from 25.8 per cent to 37.5 per cent (the main difference being payments to the Exchequer from the Social Insurance Fund (SIF)).
Table 7: Public Spending Projections 2005-2050 (as Per Cent of GNP)
Year 2005 2010 2020 2030 2040 2050
Health 7.7 7.4 7.9 8.6 9.8 11.2
Long-term care 0.8 0.8 1.1 1.5 1.9 2.4
Education 5.1 4.6 4.7 4.5 4.3 4.4
Non-SIF Social Welfare 4.9 4.9 5.1 5.4 5.9 6.6
Expenditure from SIF 4.3 4.4 5.2 6.3 7.7 9.4
Public sector pensions 1.0 1.1 1.4 1.6 1.5 1.3
Rest of gross voted 5.7 5.7 5.7 5.7 5.7 5.7
Central Fund (2005 value assumed
throughout) 3 3 3 3 3 3
Gross current expenditure 32.5 31.9 34.1 36.6 39.8 44
Appropriations in Aid (including SIF) 6.7 6.7 6.9 6.9 6.9 6.9
Net Current Expenditure 25.8 25.2 27.6 30.1 33.3 37.5
Net Capital Expenditure 6.3 6.7 6.7 4.2 4.2 4.2
Total net spending 32.1 31.9 34.3 34.3 37.5 41.7
Current receipts in 2005 29
Capital resources in 2005 1
Followi this ap ach, w ched fo a curr eceipt are uld p the hequer deficit below 5 per t of GNP in
2050. Th share wou hieve turn t to .3
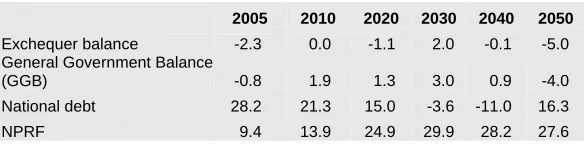
per cent (as opposed to the 2005 share of 29 per cent). The path of both the Ex equer deficit and bt this t hare in ace
are show able he ne e sig fore on bt
figures show that from the mid-2010s, the national debt actually becomes an accumulated surplus that will be run down in future ecades. In sense, the high tax hare in the earlier p riod allows the
x
ng pro e sear r ent r sh
that wo kee Exc cen
e tax that ld ac this ed ou be 33
ch the de with ax s pl
n in T 8. T gativ ns be the nati al de
d
[image:21.499.156.449.514.584.2]E chequer to save for the future and so what is being modelled is a s e equivalent to higher contributions to the NPRF.
Table 8: Deficit, GGB, Debt and NPRF Figures Under a 33.3 Per Cent Tax Share
2005 2010 2020 2030 2040 2050
Exchequer balance -2.3 1.8 0.8 3.2 0.9 -4.7
General Government
Balance (GGB) -0.8 3.6 3.2 5.2 3.1 -2.2
National debt 28.2 13.9 -4.3 -28.9 -38.1 -7.1
NPRF 9.4 14.0 26.1 36.4 43.4 50.7
It is useful to translate the required increase in the tax share into the impact, for example, on the top tax rate. Based on figures
o us by th
provided t e Department of Finance, a 1 per cent increase
the top rate of incom yi bo 00 n re
x sha ou to € bill (€1 illi y
requi in the top rate of
in e tax elds a ut €2 millio . The quired
over 27 percentage po n ur ra 4 e any tax increase w d b ead r a e o he s but this figure does still point to the impact.
emembered that the sus
at which withdrawals are made from the NPRF. Ra er than imposing each new assumption individually on the
line, we will add them sequentially. We then ask what tax share
2016 onwards). We present the results on assumption in Table 9.
rrent Expenditure figure with that in
5.
ints o the c rent te of 2 per c nt. In
reality, oul e spr ove rang f tax ading
While the tax increase would be unwelcome for those impacted upon, we should note that a tax share of under 34 per cent would still leave Ireland a relatively low-taxed economy. The average tax share in the OECD in 2004 was 37.5 per cent, with countries such as Germany and France having substantially higher tax shares (44 per cent and 50.7 per cent respectively). Also, a tax share in the region of 34 per cent would only return Ireland to where it was in the mid-1990s. Hence, the situation does not appear to be unsustainable. However, it should be r
tainable tax share of 33.3 per cent is based on increasing taxes today; by postponing tax increases into the future, the increases will have to be higher.
A
s long-term forecasts of the type presented here are subject to enormous uncertainty, it is important to vary the assumptions used in Section 4 to see if the resulting scenario is altered significantly. In this section, we investigate two alternative assumptions. First, we assume a higher rate of net inward migration to establish the extent to which migration can ease the age-related fiscal pressures. Second, we increase the rateAltering the
Assumptions
th base
would be needed in 2006 to achieve a sustainable public finance path, just as we did above.
5.1
HIGHER MIGRATIONUnder our alternative migration assumption, the inflows are incorporated into the demographic model as follows: we assume that net inflows will be 30,000 in 2005 and 2006; 30,000 annually between 2006 and 2010 (earlier this was 20,000); 30,000 also annually between 2011 and 2015 (as opposed to 10,000 earlier); 20,000 annually to 2025 and 15,000 thereafter (our earlier assumption was 5,000 from
under the new (higher) net migrati If we compare the Gross Cu
Table 7, we get a sense of the contribution which higher immigration can make in alleviating the fiscal pressures associated with population ageing. Whereas in the lower immigration scenario, gross current spending would reach 44 per cent of GNP in 2050, under the higher immigration scenario, the corresponding figure is 41.5 per cent. While this shows that immigration can contribute to solving the problem, it also shows that immigration is likely to play only a partial role.
Table 9: Public Spending Projections 2005-2050 Under a Higher Migration Assumption (as Per Cent of GNP)
Year 2005 2010 2020 2030 2040 2050
Health 7.7 7.4 7.6 8.2 9.2 10.3
Long-term care 0.8 0.8 1.0 1.3 1.7 2.2
Education 5.1 4.6 4.7 4.5 4.3 4.3
Non-SIF Social Welfare 4.9 4.8 5.0 5.3 5.7 6.3
Expenditure from SIF 4.3 4.3 5.0 5.9 7.1 8.6
Public sector pensions 1.0 1.0 1.3 1.4 1.3 1.1
Rest of gross voted 5.7 5.7 5.7 5.7 5.7 5.7
Central Fund (2005
value assumed
throughout) 3 3 3 3 3 3
Gross current exp 32.5 31.6 33.3 35.3 38 41.5
5.2
HIGHER NAT AL EN N SER F DTIO
we ed 3 p ent e N F
ch ye ter . In sce o, we double this nd ask once again what current tax share, if held 005 onwards, would lead to sustainable public igure thi ime is .7 pe ent a the r lting ths
bt and F es ow Ta 10.
1
ION P SIO RE VE UN
CONTRIBU NS
In the baseline projection, assum the er c of th PR was withdrawn ea ar af 2025 this nari
withdrawal rate a constant from 2
finances. The f s t 31 r c nd esu pa
of the deficit, de NPR figur are sh n in ble Table 0: Deficit, GGB, Debt and NPRF Figures Under Higher
Immigration, a Higher NPRF Withdrawal Rate and a 31.7 Per Cent Tax Share
2005 2010 2020 2030 2040 2050
Exchequer balance -2.3 0.0 -1.1 2.0 -0.1 -5.0
General Government Balance
(GGB) -0.8 1.9 1.3 3.0 0.9 -4.0
National debt 28.2 21.3 15.0 -3.6 -11.0 16.3
NPRF 9.4 13.9 24.9 29.9 28.2 27.6
Before ending this section, we should report that we looked at ications of altering one more assumption, namely, fertility. the impl
In our baseline forecasts, the total fertility rate is assumed to fall to
85 by 2011 and to rema st e r u r
we keep otal ility rate constant at 2. The
For mp th ase , h
spending 11.2 cent of GNP in 2050; in the
ty scenario, the e i p nt.
B
6.
1. in con ant th reafte . In o r alte native
fertility scenario, the t fert
impact turns out to be limited. exa le, in e b line ealth is projected to rise
higher fertili figurto s 10.9 er ce per
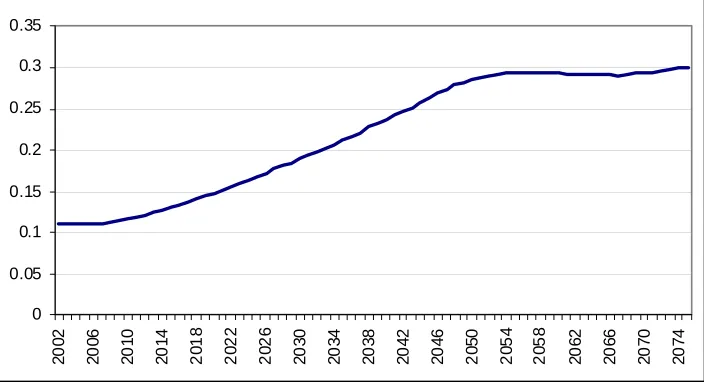
efore recapping on the results, it is useful to consider one additional item, namely, what happens post-2050. In order to take a brief look at this issue, we ran our population projections out to 2075 to see if the process of population ageing continues. In Figure 3, we show the projected percentage of the population aged 65 years and over, where the assumptions are those in our baseline. It can be
[image:23.499.157.450.389.461.2]seen in the figure that while the process of population ageing ceases around 2050, the percentage of people aged 65 years and over settles at a level of 30 per cent. Hence, while the process of population
g may not continue after 2050, neither will it go into reverse.
e
stainable path out to 2050. It should be noted that all of these figu
this paper suggest tha
agei
[image:24.499.99.451.149.340.2]r Cent of Population Aged 65 years and Over, 2002 to 2075 n
Figure 3: P
0 0.05 0.1 0.2 0.25 0.3 0.35 20 02 20 06 20 10 20 14 20 18 20 22 20 26 20 30 20 34 20 38 20 42 20 46 2 050 20 54 20 58 20 62 20 66 20 70 20 74 0.15
The results from our projections suggest that spending on health, long-term care and social welfare combined could rise from 17.7 per cent of GNP in 2005 to 29.6 per cent in 2050 (under the higher migration assumption, the figure for 2050 is 27.4 per cent). While contributions from the NPRF will contribute to funding this age-related additional spending, a gap will still remain. In the context of higher migration and 6 per cent withdrawals from the NPRF every year from 2026 on, an increase in current receipts from 29 per cent of GNP to 31.7 per cent would keep the public finances on a su
res are based on annual productivity increases of 2 per cent in the long run and increasing female participation.
Although Ireland is facing age-related fiscal challenges it is in a relatively good position to deal with these challenges. With a low debt level and low rates of taxation, the public finance base is solid. However, it will be important to maintain these features so that the age-related pressures do not destabilise the public finances or lead to tax increases at a level that could depress economic activity. With this in mind, we would argue that, at a minimum, the current level of contribution to the NPRF be maintained.
While care should be exercised in maintaining the quality of the public finances generally, the figures presented in
old-age contributory pension is currently about 32 per cent of gross average industrial earnings. Were this to be increased to 40 per cent (and all the other social welfare pension payments raised accordingly), we estimate that the cost in 2005 would increase by 0.8 per
human capital. Third, when we imposed a higher tax share to
cent of GNP. In 2050, the extra cost would be 2.3 per cent of GNP.
As a final note, we should point to three limitations in our analysis that could result in the age-related fiscal pressures being stronger than suggested. First, we have made no adjustment for the possibility of productivity rising less rapidly in an ageing population. To the extent that older workers may have skills that are obsolete, our GNP projections may be overly optimistic. Second, we have assumed that immigrants are as productive as domestic workers and this may not be true, at least in the years immediately after immigrants arrive when they may have lower levels of location-specific
20
BARROS, P. P., 1998. “The Black Box of Healthcare Expenditure Growth Determinants”,
Health Economics Vol. 7, pp. 533-544.
BERGIN, A., J. CULLEN, D. DUFFY, J. FITZ GERALD, I. KEARNEY, D. McCOY, 2003. Medium-Term Review 2003-2010, No. 9, Dublin: The Economic and Social Research Institute.
CENTRAL STATISTICS OFFICE, 2004. Population and Labour Force Projections 2006-2036, Dublin: CSO.
COMMISSION ON PUBLIC SERVICE PENSIONS, 2000. Final Report, Dublin: Stationery Office.
CUTLER, D. M., and L. SHEINER, 2001. “Demographics and Medical Care Spending: Standard and Non-standard Effects”, in A. J. Auerbach, and R. D. Lee (eds.), Demographic
Change and Fiscal Policy, Cambridge: Cambridge University Press.
DEPARTMENT OF FINANCE, 1998. Long-Term Issues Group Paper, available at www.finance.gov.ie
DEPARTMENT OF FINANCE, 1999. Report of the Budget Strategy for Ageing Group, available at www.finance.gov.ie
DEPARTMENT OF FINANCE, 2004. Budget 2005, Dublin: Stationery Office.
DEPARTMENT OF FINANCE, 2005. Revised Estimates for Public Services, Dublin: Stationery Office.
DEPARTMENT OF SOCIAL AND FAMILY AFFAIRS, 2002a. Actuarial Review of the Social
Insurance Fund, Dublin: Stationery Office.
DEPARTMENT OF SOCIAL AND FAMILY AFFAIRS, 2002b. Study to Examine the Future
Financing of Long-Term Care in Ireland, Dublin: Stationery Office.
ECONOMIC POLICY COMMITTEE, 2001. Budgetary Challenges Posed by Ageing Populations, available at
www.europa.eu.int/comm/economy_finance/epc/epc_ageing_en.htm
HIPE AND NPRS UNIT, ESRI, 2002. Activity in Acute Public Hospitals in Ireland 1990-1999, Dublin: The Economic and Social Research Institute.
21
P
ERSPECTIVES ON
R
ETIREMENT
S
AVING
P
OLICIES IN
I
RELAND
John McHale
*T
here is a danger of Irish households becoming deaf to the persistent clamour telling them they are not saving enough for retirement. But with overall economic growth showing remarkable robustness, not having put aside enough during working years may now be the single biggest threat to living standards many Irish people face. Of course, under-saving for retirement is by no means a uniquely Irish problem. Large-scale studies of households in the United States, for example, show that the median household reaches retirement with very low levels of financial wealth.1 And the recent Pensions Green Paper in the United Kingdom has pointed a large savings shortfall for a significant minority of the workforce.21.
Introduction
*Queen’s School of Business, Queen’s University, Kingston, ON, K7L4V1,
Canada. I am grateful to the editors Tim Callan and Aedín Doris for their support. Thanks are also due to Daniel McCoy and to the ESRI reviewers for their very useful feedback. I would also like to thank my colleague Laurence Ashworth for valuable discussions and comments.
1 Poterba, Venti, and Wise (1996) report that median level of all personal financial
assets of families with heads between 55 and 64 years was just $8,300 in 1991. Almost 20 per cent of families had no financial assets at all. It should be noted that not all experts agree that there is widespread under-saving for retirement in the United States. Scholz et al. (2004) use a rich life-cycle model to argue that fewer than 20 per cent of households have less wealth than their inferred optimal targets. One criticism of their approach is that they include the equity in homes as part of household wealth, since many households are unwilling or unable to run down this equity to finance their retirement (see, for example, Venti and Wise (2001)).
2 The Green Paper notes that there is no “right” replacement rate. Instead, two
Interestingly, surveys indicate that many individuals recognize they are not saving enough and wish to save more.3
There is one reason for being especially concerned about post-retirement living standards in Ireland, however. The country is almost unique in the OECD in not having an earnings-related state pension or mandatory earnings-related private provision.4 The flat-rate state pension provides a relatively low level of replacement for a worker with average earnings.5 Of course, many households are not solely reliant on the state pension for their retirement income needs. Yet just over half the workforce had pension coverage in 2004.6 For recent retirees, Hughes and Watson (2005) have calculated gross replacement rates averaging 51 per cent for couples and 43 per cent for singles in the year following retirement based on all income sources.7
These numbers suggest that many Irish households experience a significant drop in consumption at retirement.8 On the basis of US
3 Choi et al. (2001), for example, report the results of a survey where a sample of
employees at a large US food company where asked about their views on the adequacy of their own savings. When they asked the employees how much they should ideally be saving for retirement answer averaged 13.9 per cent. When asked to evaluate the adequacy of their own actual savings rate, two-thirds reported that they their savings were too low relative to their ideal rate, one-third thought their saving was about right, and just 1 employee (out of 195) thought their savings rate was too high.
4New Zealand is the other exception.
5In a comparative analysis of state pension systems, the OECD (2005) finds that a
worker on average earnings has a lower replacement rate in Ireland (31 per cent) than in any other OECD country. The OECD average is 57 per cent. The OECD also reports that the net replacement rate is 37 per cent, which compares with an OECD average of 64 per cent.
6 Based on estimates from the Quarterly National Household Survey, 52.4 per cent
of all persons between the ages of 20 and 69 years in employment had pension coverage. This compares with a figure of 51.2 per cent in the first quarter of 2002. This small increase probably reflects the introduction of Personal Saving Retirement Accounts. These accounts will be discussed later in the paper.
7Their data combines from all waves of the Living in Ireland Survey between 1994
and 2001. Unfortunately, despite the pooling from different waves the number of cases is small, with 200 pensioner couples and 60 single pensioners. Interpreting these rates is complicated by the fact that some people – often those with relatively generous occupational or personal pensions – retire before reaching 65 years. Hughes and Watson also report that in 2001 the median income of people 65 years and over was just 62 per cent of the median income of those aged less than 65 years in Ireland, which compares with an average of 83 per cent in the EU-15.
8 I thank the referees for pointing out that drops in consumption can be quite
data, Bernheim et al. (2001) argue that it is difficult to reconcile observed drops in consumption at retirement with models of rational, farsighted life-cycle planners.9 To properly understand savings behaviour, it seems necessary to introduce certain behavioural tendencies – such as bounded rationality when faced with complex life cycle planning problems and the problems of self control when faced with the lure of instant gratification – that lie outside the rational choice framework.10
In this paper, I examine a number of policy initiatives designed to increase collective and individual saving in Ireland. The resulting alphabet soup of policies – the National Pensions Reserve Fund (NPRF), Personal Retirement Savings Accounts (PRSAs) and Special Savings Investment Accounts (SSIAs) – suggest that this has been an active area of public-policy innovation. I will briefly review what I see as the merits of these programmes, and offer a suggestion for an additional policy that I believe will help households move closer to their desired saving rates without having to resort to heavy-handed government compulsion.
From an analytical perspective, the paper makes use of two relatively non-standard (but increasingly discussed) literatures. The first relates to the political risk that exists in all state-run pension systems. This is the risk that benefit rules will be made less generous before or during your retirement, typically due to an ageing-induced increase in the total cost to future generations of funding the benefits. Drawing on the idea of political risk, I argue that the NPRF can be viewed as a mechanism to help ensure that today’s levels of benefit generosity can be sustained. The fund also makes it easier for a prudent government to increase benefit generosity for current
retirees, despite the fact that those increases become very expensive as the elderly dependency rate rises. The second is work in behavioural economics that studies the present bias that hinders many of us in making the private retirement provision that we know is right for us when we adopt a more “temporally detached” perspective. The findings from this research help shed light on the surprising popularity of the SSIAs, and also provide clues to other policies for increasing retirement saving.
income is far higher than their average income (and thus capacity to save) over that life.
9 Banks et al. (1998) also find evidence of significant drops in consumption at
retirement in the United Kingdom. They find that part of the drop can be explained by the complementarity between working and consumption. They argue that the only way to reconcile the unexplained fall in consumption with the life-cycle hypothesis is to assume a systematic arrival of unexpected adverse information at retirement. Hurd and Rohwedder (2003) provide evidence that consumption changes at retirement are fully anticipated. They infer that the observed declines must be due to the ending of work-related expenses and the substitution of home production for market-purchased goods and services. An alternative explanation is the declines were anticipated, but behavioural failings made it difficult for households to put the necessary saving adjustments in place.
The rest of the paper is organised as follows. In the next section, I provide a very brief discussion of Ireland’s state pension system and discuss the merits of the recent shift to pre-funding future benefit obligations via the NPRF. Section 3 then turns to tax-based inducements for retirement saving, with particular focus on the recently introduced PRSAs. This leads to a discussion of ideas from the behavioural economics literature about how people actually make saving decisions in Section 4. Section 5 then applies these ideas to help understand the reasons for the popularity of the SSIA scheme. In Section 6, I attempt to combine the lessons from the behavioural economics research and the lessons learned from the SSIAs to sketch the outlines of a policy that I think would significantly increase retirement saving in low-cost financial instruments while preserving freedom of choice. Section 7 offers some concluding thoughts.
2.1
THE STATE PENSION2.
Pre-Funding
State Pensions
The outstanding feature of the Irish pensions system is the absence of an earnings-related state pension. Among OECD countries, only Australia, Ireland, Mexico and New Zealand lack what is typically called a second-tier pension that links pension payments to an individual’s earnings history (OECD, 2005).11 Instead, the Irish system depends solely on two forms of flat-rate pension. Social assistance pensions are non-contributory, means-tested and payable to those aged 66 years and over.12 Social insurance pensions are contributory, non-means-tested and payable at age 65 years.13The strengths of the Irish system are that it is relatively inexpensive and it redistributes towards the lifetime poor (by combining flat rate benefits with earnings-related contributions).14
11 Australia and Mexico mandate contributions to defined contribution private
accounts.
12 The maximum payment from the Old Age (Non-Contributory) Pension to a
single individual is €166 per week in 2005. Benefit eligibility falls to zero if the individual has a weekly income of over €170.10 per week.
13 There are actually two forms of contributory pensions. The Retirement Pension
is payable at age 65 years, but is conditional on actual retirement. No retirement test is applicable to the Old Age (Contributory) Pension. However, this pension is not available until age 66. The benefit payable to an individual without dependents is €179.30 from both contributory pensions in 2005. Along with other benefits, contributory pensions are funded by contributions made by employees (4 per cent of earnings up to €44,180) and employers (10.75 per cent of earnings without limit). See McHale (2002) and Hughes and Watson (2005) for more details on the Irish pensions system.
14 One problem with such a system is that the PRSI contributions are viewed as a
The chief weakness of the system is that it provides low replacement rates for many workers, putting them at risk of substantial drops in living standards at retirement. Using a stylised model of the system, the OECD (2005) calculated that a worker on average earnings over their working life would have a gross replacement rate of 30.6 per cent and a net replacement rate of 36.6 per cent. A worker earning twice average earnings would have gross and net replacement rates of just 15.3 and 21.9 per cent respectively. It should be noted that some systems with complicated formulas for determining earnings-related benefits actually end up with little more differentiation in benefits than are observed in Ireland. The OECD (2005) has usefully calculated measures of benefit dispersion (measured by the Gini coefficient) as implied by their country-specific state pension models. The Gini coefficient is zero for Ireland given its pure flat-rate benefit system, which compares to an average OECD Gini of 0.16. But the mere existence of a complicated earnings-related state pension does not guarantee differentiation in benefits. Canada, for example, has a relatively complicated earnings-related system, but ends up with a Gini coefficient not much greater than Ireland’s at 0.04 – the system is full of sound and fury but in the end gives all retirees roughly similar amounts. One problem with such a system is that higher earning retirees may be surprised by how little of their income the state pension replaces.15 The Irish system at least has the virtue of transparency: workers can form reasonably accurate expectations of future state benefits based on widely known benefit levels for current retirees. I will return below to the question of whether this is likely to be enough to induce the saving necessary to sustain living standards in retirement.
2.2
THE NATIONAL PENSION RESERVE FUNDIn common with all industrialised countries, Ireland faces a significant ageing of its population structure in coming decades. The resulting increases in old age dependency rates are generally very good news, reflecting as they do the fact that people are living longer. Of course, the coming surge in dependency rates also reflects the retirement of the post-WWII baby-boom generation in most countries. Helpfully, Ireland’s baby boom came later than in other countries, giving the government some additional time to deal to prepare for ageing-related fiscal costs.
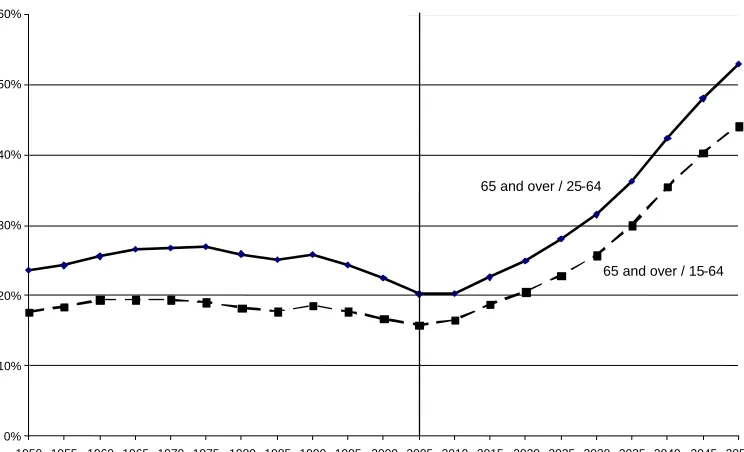
Figure 1 shows the evolution of two measures of the old age dependency rate in Ireland: the ratio of the population aged 65 years and over to the population aged between 15 and 64 years, and the ratio of the population aged 65 years and over to the population aged between 25 and 64 years. With an increasing proportion of the
15In the case of Canada, the OECD estimates a gross replacement rate of 42.5 per
population now staying in school until their early twenties, the latter is probably a better measure of the old age dependency “burden.”
Figure 1: Old Age Dependency Rates in Ireland
0% 10% 20% 30% 40% 50% 60%
1950 1955 1960 1965 1970 1975 1980 1985 1990 1995 2000 2005 2010 2015 2020 2025 2030 2035 2040 2045 2050
Source: United Nations Population Division (2004 Revision, Medium Variant).
65 and over / 25-64
65 and over / 15-64
Figure 2: Old Age Dependency Rates in Ireland and Europe, 65+ / 25-64 Years
0% 10% 20% 30% 40% 50% 60%
1950 1955 1960 1965 1970 1975 1980 1985 1990 1995 2000 2005 2010 2015 2020 2025 2030 2035 2040 2045 2050 Europe
Ireland
Source: United Nations Population Division (2004 Revision, Medium Variant).
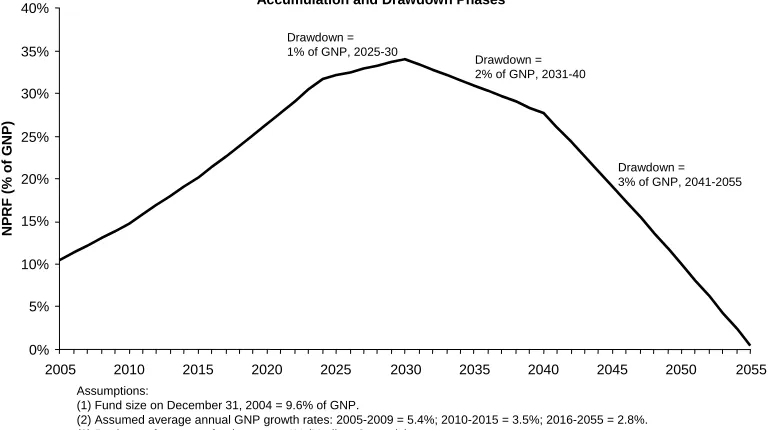
In its effort to take advantage of the demographic window, the Irish government is pre-funding part of the cost of future benefits with the National Pension Reserve Fund (NPRF). Starting in 1999, the plan was to put aside 1 per cent of GNP each year until 2055 regardless of the state of the economy.16 Disbursements of the fund are prohibited until 2025. The value of the fund had already reached 9.6 per cent of GNP by the end of 2004. Figure 3 shows the hypothetical evolution of the fund based on given GNP growth assumptions, a real rate of return on the fund of 4 per cent, and a drawdown schedule that would exhaust the fund by 2055. These simple calculations show that the fund should significantly ease the burden on future generations of funding the pensions of today’s younger workers.
16 In addition, the proceeds from the privatisation of Eircom were invested in the
Figure 3: Hypothetical Evolution of the National Pensions Reserve
Accumulation and Drawdown Phases
0% 5% 10% 15% 20% 25% 30% 35% 40%
2005 2010 2015 2020 2025 2030 2035 2040 2045 2050 2055
NP
RF
(%
o
f
G
N
P)
Drawdown = 1% of GNP, 2025-30
Drawdown = 2% of GNP, 2031-40
Drawdown = 3% of GNP, 2041-2055
Assumptions:
(1) Fund size on December 31, 2004 = 9.6% of GNP.
(2) Assumed average annual GNP growth rates: 2005-2009 = 5.4%; 2010-2015 = 3.5%; 2016-2055 = 2.8%. (3) Real rate of return on fund assets = 4% (Medium Scenario).
(4) 1% of GNP is added to the fund each year until 2055.
Is the NPRF good policy? The most common rationale for pre-funding is intergenerational equity. The argument is simply that it is unfair to place the burden of ageing-related costs on future workers. This rationale has been strongly questioned by the ESRI in its 2003
Medium-Term Review (see also Fitz Gerald, 2004). The Review authors
point out that today’s workers already face a high burden from the direct monetary and disruption costs of closing the infrastructure deficit. The benefits of this infrastructure will be enjoyed by future workers (who hopefully will also be earning substantially higher incomes), so that having these workers meet the higher pension burden does not seem like an unreasonable quid pro quo.