The effects of an incremental increase in
the Irish carbon tax towards 2030
Kelly de Bruin
a, Aykut Mert Yakut
aAbstract: This paper investigates the economic and environmental impacts of an incremental increase in the rate of Irish carbon tax. For this analysis an intertemporal computable general equilibrium (CGE) model, namely Ireland Environment-Energy-Economy (I3E), is developed. This model allows for the investigation of industry level impacts as well as economy wide impacts by explicitly modelling sectoral interlinkages. We examine two potential future paths of carbon tax increases and the impacts of recycling carbon tax revenues through a lump sum transfer to households. Our results show that LPG, diesel and gasoline prices will be impacted most with increases of up to 10% in 2020 compared to a baseline scenario. The energy and transport sectors will be hit the hardest with losses of up to 4% of value added in 2020. Households face higher overall prices, with an up to 2.4% increase in the CPI in 2020 which lowers household real disposable income by 0.24% in 2020. Though income increases as prices rise, households consume less and save more in the medium-run. Driven by this decline in real private consumption, real gross domestic product declines, though at a negligible rate of 0.4% in 2020. Overall emissions in 2020 fall by 18% compared to the baseline. However, this is still far short of EU targets.
Keywords: Carbon tax, Emissions, Welfare, Intertemporal CGE
JEL classifications: C61, D15, D25, H23, O44
a. Economic and Social Research Institute, Dublin
ESRI working papers represent un-refereed work-in-progress by researchers who are solely responsible for the content and any views expressed therein. Any comments on these papers will be welcome and should be sent to the author(s) by
Working Paper No.
6
1
9
1
Introduction
The adverse impacts of carbon emissions on our climatic system, and in turn societies, have long been
recognised by the international academic community. The human-induced increase of atmospheric tem-perature is estimated to be over 0.8◦C to date compared to pre-industrial levels (IPCC, 2014). Climate
change involves, in addition to increases in temperature, more variability in temperature and
precipita-tion, increased occurrences of extreme weather events and a rise in sea levels. The concomitant impacts of these climatic changes on societies and economies are uncertain but are expected to be very
signifi-cant, where at a global level economic damage of approximately 2% of GDP per year for a temperature
increase of 2.5◦C are estimated (IPCC,2014). Impacts over longer periods of time and higher levels of climate change are highly uncertain and could result in extremely high impacts, abrupt climate change,
and climatic tipping points.
Global recognition of the need to limit climate change has driven negotiations over the past decades to combine efforts to decrease greenhouse gas (GHG) emissions within the United Nations Framework
Convention on Climate Change (UNFCCC). In 2015, the Paris Agreement was adopted and to date has
been ratified by 194 states and the European Union, though the US has given notice to withdraw from the agreement. Within the Paris Agreement, members of the convention voluntarily submit their national
emission targets through Intended Nationally Determined Contributions (INDCs). The main elements
of the EU INDCs are summarised in the EU 2030 climate and energy framework with defines three key targets to be reached by 2030: at least 40% GHG emission reduction (compared to 1990 levels), at least
27% share of renewable energy, at least 27% improvement in energy efficiency. The EU has also defined
a longer-term perspective on climate and energy policy for 2050, which further decreases emissions by 80-95% of 1990 levels.
To achieve these targets at least cost, the EU has implemented a cap and trade system, namely the EU
Emissions Trading System (ETS). It operates in all 28 EU countries as well as in Poland, Liechtenstein, and Norway and covers 45% of EU GHG emissions. In this system, massive energy-using installations
(power stations and industrial plants) and airlines in the EU have to buy emission allowances. Companies can trade emissions throughout the EU ensuring that emissions are reduced where it costs the least to do
so. The cap is set to decrease emissions from the ETS sectors by 21% in 2020 (compared to 2005) and
by 43% in 2030. The overall EU reduction goal in non-ETS sectors is set at 30% (compared to 2005), to achieve this the EU sets individual binding targets for each Member States based on the Effort Sharing
Decision.
The non-ETS reduction target for Ireland is set at a reduction of 20% compared to 2005 levels by 2020 and a 30% reduction by 2030. These targets are legally binding and Ireland will face fines should
it not meet its targets. Though steps have been made to limit GHG emissions in Ireland through a carbon
tax and other policy measures, recent estimates by the Environmental Protection Agency (EPA) of Ireland project that, at best, Ireland will achieve a 1% reduction of emissions by 2020 given the strong economic
need to improve climate policy in Ireland to reach its 2020 targets in order to avoid facing EU level fines
and to also contribute to the transition to a low carbon global economy.
To create sound carbon tax policies, research is needed to understand both how effective policies
may be in reducing emissions and how these policies will affect the overall economy, producers and
households. There is relatively no literature addressing both the economic and environmental impacts of increasing the carbon tax in Ireland. This paper attempts to fill that gap.
This paper aims to shed light on the impacts of increasing the Irish carbon tax rate on both the economy and the level of emissions through emission reduction responses to increased prices. A key
concern with increasing the carbon tax is the impact this will have on households’ expenditures. A carbon
tax should incentivise households to decarbonise without making them worse off. One way of achieving this is to recycle the revenues from the carbon tax back to households. In this paper we examine this
mechanism and investigate if decarbonisation can be achieved without negatively impacting households.
This analysis applies the Environment, Energy, and Economy (I3E) model. The I3E model is an in-tertemporal computable general equilibrium (CGE) model with multiple firms, one representative
house-hold group (RHG), multiple commodities, government, enterprises, and rest of the world accounts. CGE
models examine how inputs and outputs flow between sectors of the economy and finally result in final goods consumed by households. The explicit modelling of sectoral inter-linkages makes it possible to
investigate the wider economic impacts of a specific shock or policy through the different transmission
channels in the economy and the distributional impacts of policies whose effects may be transmitted through multiple markets. The nature of the methodology makes it very useful to examine the direct and
indirect impacts of a carbon tax on the Irish economy.
This paper implements two scenarios, where there are future increases in carbon taxes. In both paths, the tax increases in 2019 to C40 per tonne ofCO2, after which the carbon tax increases annually by C5 in
the less stringent path and C10 in the stringent path. The impacts of these carbon increases are compared
with a baseline scenario where the carbon tax of C20 remains at its current level.
The results indicate that the overall economic impacts of increasing a the carbon tax are negligible.
However, sector level impacts are significant, where the energy and transport sectors are impacted the
most, while chemical products, basic pharmaceutical products, food, beverage, and tobacco benefit the most. Prices of energy commodities increase significantly, particularly for diesel and LPG, however
households face only a moderate increase in overall prices. Household disposable income, however, increases due to increased transfers from the government from the recycling of carbon tax revenue while
wages increase due to a shift towards labour intensive services. As carbon taxes cause prices to rise,
households choose to consume less and save more, thereby decreasing their real consumption. The carbon tax increases can successfully decouple emissions from economic growth, but the resulting reductions in
emissions still falls far short of the EU targets.
This paper is structured as follows; in the next section, we present a brief survey of literature on the carbon tax by focusing on the case of Ireland. Section3 describes the ESAM and the I3E model in a
discusses the results and Section5draws conclusions.
2
Literature review
For Ireland, the literature to date in this area has examined the potential introduction of a carbon tax, i.e.
has focused on the pre-2009 period.Bergin et al.(2004), using the supply-side macroeconometric model, namely HERMES, described inFitzGerald et al.(2002), finds that a carbon tax would modestly reduce
CO2emissions, mostly through power generation, and the overall macroeconomic impacts depend on how
the carbon tax revenue is recycled. If the revenue was used to reduce VAT or social insurance, economic growth would be accelerated, while lump-sum transfers to households or companies would slow growth.
Conefrey et al.(2013) examines the implementation of a C20 carbon tax, focusing on revenue recycling
and double dividend applying the HERMES model. The results reveal that the effects of a carbon tax on the overall price level, real GDP, household real disposable income, and employment are small. They
find evidence of a double dividend when tax is recycled through a reduction in income taxes.
A CGE analysis ofWissema & Dellink(2007) with 23 sectors and a single household investigates the impacts of a carbon energy tax in Ireland. They find that a C15 per tonne tax would result in a
25.8% decrease in emissions compared to levels in 1998. The main shortcomings of their framework are
the absence of a distinction between ETS and non-ETS emissions, and the omission of any carbon-tax exempted sectors.
The first study investigating the economic impacts of increasing the carbon tax, de Bruin & Yakut (2018), conducts a static price multiplier analysis based on an Energy Social Accounting Matrix. They
find that a doubling of the carbon tax to C40 per tonne ofCO2 affects the prices of diesel and petrol
the most. Notably, the production sectors that drive Irish exports are relatively insensitive to a carbon tax increase, suggesting that an increase in the current carbon tax will not have significant impacts on
the international competitiveness of Irish exports. Impacts on households are found to be small. The
post-multiplier analysis reveals that a doubling of the carbon tax will result in less than a 5% decrease in GHG emissions.
This paper contributes significantly to the current literature as it represents the first dynamic study
into the impact of increasing the Irish carbon tax in its current form. Furthermore, this paper utilises the latest available data, representing the significant changes in the Irish economy over the past decades.
3
The I3E Model
The I3E model is an intertemporal computable general equilibrium (CGE) model with multiple firms, one representative household group (RHG), multiple commodities, government, enterprises, and rest of the
world accounts. The model describes how firms produce commodities, which are used as inputs to other firms’ production processes or consumed by households, the government and the rest of the world. The
relationships among these agents in a non-technical manner. For the technical details of the model, see
de Bruin and Yakut (2019).
3.1 Households
Households are represented through a single Ramsey-type representative household group. The
house-hold maximises her present discounted value of utility subject to her intertemporal budget constraint by choosing the optimal consumption path, represented as the volume of composite total consumption. A
composite total consumption commodity is an aggregate of all goods consumed by the household and is
created in the interests of simplification. The multiplication of the volume of composite total consumption and its price yields the household’s total consumption expenditure. The difference between disposable
income and consumption expenditure is private saving. The household has a Constant Relative Risk
Aversion (CRRA) type utility function which ensures that the household smooths its consumption over time.
The disposable income of the household is equal to the summation of net-of-tax wage income
(includ-ing social security premiums) from activities, capital income in the form of dividends from the enterprise account, unilateral and unconditional transfers from the government, net factor income receipts from the
rest of the world account, and finally revenue cycling income from the government based on carbon tax
collection.
Once the household has determined her optimal total consumption path, she disaggregates the
com-posite total consumption into consumption across the various commodities for the given parameters and prices endogenously solved within the model. The disaggregation process first involves optimising
con-sumption over the composite commodities of transportation, residential energy, nourishment, services,
and other commodities. A composite consumption commodity can be treated as a bundle of commodities which are easily substitutable. Then, for example, the service composite commodity is disaggregated
across the various services, i.e. the household decides how much educational services, accommodation
services, financial services, etc. to consume.
3.2 Activities
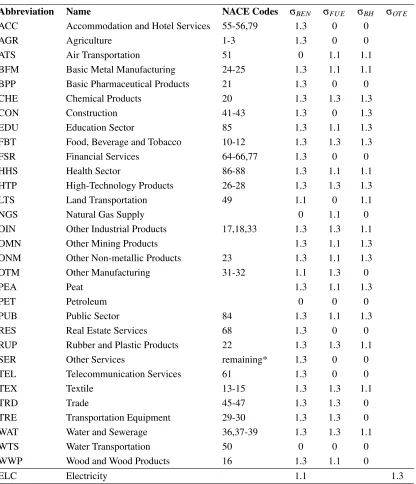
The production side of the model comprises 32 representative firms (or industries) that produce multiple
products, where these firms are referred to as activities. Examples of industries are agriculture, textiles,
chemical producers, construction.1 Allowing activities to produce multiple products is an important feature of the I3E since activities can change their production composition, to some extent, in reaction to
changes in tax rates, international prices, demand-side conditions, etc.
Based on the Social Accounting Matrix (SAM) which is constructed using the Supply and Use Ta-bles (SUTs), activities are divided into two types; single-product producers and multi-product producers.
Single-product producers are those activities that produce only one commodity or the value of
produc-tion of a single commodity exceeds 95% of the total producproduc-tion of the activity. For these activities it is assumed that the production of each commodity is a fixed fraction of the total output. Multi-product
pro-ducers are assumed to decide how much of each commodity to produce through revenue maximisation.
The activities are assumed to produce a composite product which is an aggregate of value added, business energy, and other inputs. This structure describes how the activities use value added (factors of
production), business energy and other inputs to produce its final product. Value added is an aggregate of capital and labour, i.e. the factors of production, while the composite commodity of other inputs
com-prises all intermediate inputs besides the energy commodities, which are peat, coal, crude oil, gasoline,
kerosene, fuel oil, liquid petroleum gas, diesel, electricity, natural gas, and other petroleum products. The composite commodity of business energy is an aggregate of other model-defined composite commodities,
namely business heating and fuel, which are also aggregates of the aforementioned energy commodities.
The substitution elasticities across energy commodities within the composite commodity of business en-ergy differs across activities to reflect the distinct enen-ergy needs of the various production processes. For
instance, the business energy of the water transportation sector is a Leontief aggregate (i.e. the elasticity
of substitution is zero) of the energy commodities as diesel constitutes more than 90% of the total energy demand of the activity.
Another important characteristic of the I3E model is that the determination of investment for the
majority of activities (27 out of 32), i.e. the investment by destination, is an endogenous decision based on a dividend maximisation problem. Dividend maximising activities are introduced to better represent
the economic dynamics. If the investment decision is not made by activities endogenously, all model
dynamics would rely on the consumers’ consumption smoothing. Firms maximise the present discounted value of the firm, i.e. the dividend stream, subject to capital accumulation function. Sectoral dividend
is equal to net-of-corporate tax sectoral profit minus total investment expenditure, which includes the
cost of new investment equipment and the adjustment costs. Adjustment costs are an increasing and convex function of investment; for a given level of sectoral capital stock, the cost of installing new capital
equipment will be greater. Adjustment cost is measured by the price of the value added since it is assumed
that the installation of new capital requires an interruption of the production process resulting in losses of output. In this structure, firms choose the level of physical investment, capital stock, and labour demand.
The Lagrange multiplier of this maximisation problem is the well-known Tobin’sq which is the ratio of the market value of existing capital to its replacement costHayashi(1982). For the remaining five
(non-dividend maximising) firms, the investment expenditure is a fixed fraction of gross profit.
3.3 Enterprises
The model includes an “enterprises” account, where a representative enterprise is assumed to be the owner of all firms. This specification helps to simplify some details of the model and also solves the issue of
sectoral profits and receives transfers from the government which are fixed in nominal terms and pays
corporate tax to the government. The remaining amount is either saved by the enterprise account (fixed fraction of net-of-tax profit receipts) or paid to households as dividend payments.
3.4 Government
The I3E model has an explicit representation of the government sector. The government collects direct taxes on labour incomes and on sectoral profits (corporate tax), indirect taxes on sales of commodities,
carbon tax on energy commodities, export tax on exported commodities2, and production activities. Car-bon tax collected on the domestic consumption of energy-commodities is implemented as a fixed price of per-tonne equivalent of carbon, i.e. the carbon tax,PCARc,t, which is exogenously determined by the
government,
CTAX Sc,t = al phacPCARc,t carconcQSc,t (1)
where carconc is the carbon content of commodity c. The parameter al phac equates the carbon tax
collection of the government on commoditycfor the given levels of variables and parameters.
The government allocates her total revenues to consumption of commodities, transfers to households
(fixed in real terms), transfers to enterprises (fixed in nominal terms), recycling of carbon tax receipts to
households, and interest payments over the outstanding foreign debt stock.
The total government consumption on commodities has an autonomous part which is fixed in nominal
terms and an induced part which is a positive function of the current period’s nominal gross domestic product. This structure indicates that the Irish fiscal policy is pro-cyclical, and is consistent with the
findings ofCronin & McQuinn(2018).
The difference between total revenues and expenditures of the government is public saving which drives changes in the foreign debt stock, i.e. as public saving increases (decreases), the government debt
stock becomes lower (higher).
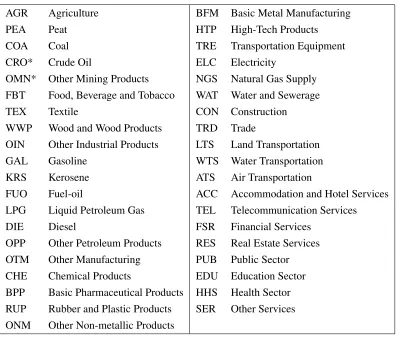
3.5 Commodities
The I3E model includes 39 commodities, 37 of which are domestically produced and imported, and
two of which are not domestically produced but imported.3 In the Supply and Use Tables, as the trade flows are shown by commodities, the exporter or importer activity is not known. For each commodity which is exported, a composite commodity4 is created whose supply comes from the productions of several activities while it is either sold in the domestic market or exported. The volume of export and
domestic sales are determined by a revenue maximisation problem for the given levels of the elasticity of substitution, the share parameters, and the endogenously solved prices.
2 The domestic sale of electricity is exempted from the carbon tax but its export is subject to a carbon tax. Export tax is positive
only for electricity.
3 A full list of the commodities is available in AppendixA.2.
4 It is a constant elasticity of substitution aggregate of different products. This means that each activity’s product is an imperfect
The supply of domestically sold commodities comes from imported commodities and domestically
produced commodities, which are imperfect substitutes of each other. Total domestic demand comes from five sources; intermediate input demands of activities, private demand of households, government
demand, investment demand, and trade and transportation margins. The level of intermediate input
de-mand stems from the activities’s cost minimisation problem, while the level of consumption dede-mand stems from the household’s utility maximisation problem. The government demand per commodity is a
fixed fraction of the total government consumption. The investment per commodity, i.e. the investment by origin is a fixed fraction of the total investment expenditures of the activities. As the capital
compo-sition matrix which shows the sectoral capital stock’s compocompo-sition across commodities is unknown for
the Irish economy, the composition of commodity demand by investment purpose is assumed to be fixed through time.
The last component of domestic demand comprises trade and transportation margins, which are
nec-essary to deliver commodities from factories and docks to markets. Each commodity demands margin as a fixed fraction of its total composite supply, and the total volume of these demands is equal to the total
supply of margins. The total demand is met by the trade activity in the model as the CSO announces only
the trade margins, although the convention is announcing the total of trade and transportation margins separately.
3.6 Economic Growth
I3E is a dynamic model, which incorporates economic growth over the modelling horizon which runs from 2014 to 2050. Economic growth originates from three sources; the growth of employment driven by
population growth, the growth in capital stock driven by investment, and finally the growth in total factor
productivity which is predominantly a residual (known as the Solow residual) of the economic growth that is not explained by growth in the factors of production (labour and capital).
It is assumed that the total population grows at a constant rate and the technology, i.e. the productivity
of labour force, grows at a constant rate. In the current version, the values of population growth and economic growth are retrieved from the medium-run estimates of the macroeconometric forecast model
of the ESRI, namely COSMO (COre Structural MOdel for Ireland), (Bergin et al.,2017). Accordingly,
the former and the later are calibrated as 0.8% and 3.3%, respectively, and implied labour productivity growth is calculated as 2.48%.
4
Results
In this section we present the results from our analysis. We first discuss the baseline results and the implementation of the carbon tax scenarios. We then discuss the results concerning energy prices, the
4.1 Baseline
The baseline scenario is where there is no change in any policy variables/parameters; the economy is
assumed to evolve according to its internal dynamics. For instance, since the internal dynamics of the
I3E model are driven by the population and labour productivity growths, the Irish economy would grow at 3.3% per annum without any policy intervention. Since there are no external interventions in the
economy, the baseline scenario is also called the business-as-usual path. Therefore, in the base path, the
current carbon tax of C20 is continued but not increased.
The baseline of the I3E model does incorporate some significant changes in the Irish economy
between 2014 and 2017. Firstly, there was an almost 50% decline in the international oil price in
2015, which also affected the prices of other oil-related commodities including kerosene, fuel oil, liq-uid petroleum gas, etc. On the other hand, the international price of coal had a positive trend in the same
period. Such large variations in international prices, in addition to the strong economic growth profile of
the Irish economy, have inevitable repercussions on demand for these fossil fuels and hence emissions. According to the Energy Protection Agency’s figures, total emissions of Ireland has increased by 6.4%
between 2014 and 2017 (EPA,2018b). Moreover, changes in international prices have also affected trade
and thus current account balances.
Secondly, another significant recent development in the Irish economy has been the decline in peat
production, and hence consumption as only small amounts of peat are traded internationally. According
to the Energy Balances, the total peat production including changes in inventories declined by 10.6% between 2014 and 2017 (SEAI,2019). In line with the vision of a non-peat economy by 2030, the peat
sector has switched her production to biomass and the total indigenous production of biomass, renewable
and waste have been increased by 33.2% from 2014 through 2017.
In order to capture the effects of these issues on the Irish economy, we have applied the following
changes in order to produce the baseline of I3E. International energy prices are lowered for the period of 2015-2017 and it is assumed that their values in 2018 and onwards will be equal to their values in 2017,
i.e. the baseline of the model does not consider any other changes in international energy prices beyond
2018. The decline in peat production has also been introduced. Since biomass, renewable and waste commodities have not been defined explicitly in the I3E model due to lack data in order to disaggregate
electricity production activity, it has been assumed that the peat sector has switched her production to
electricity as peat production falls.
We now briefly discuss key results from the baseline scenario, which are relevant for interpreting the
results of the carbon tax scenarios. Under the baseline scenario, we find that the decreasing international
prices of carbon commodities affect the domestic purchaser, i.e. retail prices of energy commodities directly and the prices of other commodities indirectly. The domestic purchaser price of liquid petroleum
gas (LPG) is the most affected with a 13.5% price reduction between 2014 and 2030, while the prices
the positive trend of the coal price, the domestic retail price of coal increases by 40% between 2014 and
2030, which also affects the price of peat since these two commodities are almost perfect substitutes. This results in a 13.5% decrease in the price of peat between 2014 and 2030. The effects of the movements
in the primary energy prices also shift the cost of production and thus the domestic price of electricity,
although the price increase is relatively small (1.2% up to 2020).
Along the baseline, labour demand of the peat sector increases by on average 0.7% per annum. This
increase in labour demand is lower than the growth rate of real GDP, indicating that the weight of the peat sector in total employment weakens. This is due to the government policy of transition to a non-peat
economy by 2030.
As the prices of energy commodities decrease, the cost of production in all sectors decrease which, in turn, puts downward pressure on domestic prices. However, decreasing prices increase commodity
demands, relaxing the downward pressures on prices. For instance, domestic purchaser prices of
agricul-tural products, food, beverage, and tobacco, and textile slightly decline, but the magnitudes are less than 0.3%, in absolute terms.
The joint effect of declining international prices and peat production has negligible impacts on the
real gross domestic product. The growth rate of real GDP slightly declines in the short-run, but it returns to its medium-run average, i.e. to 3.3%, by 2030. On the other hand, the total economy-wide emissions
increase by 13.9% in 2018, relative to 2014, as declines in international prices spur demand for energy
commodities in the domestic market. Moreover, under the assumption of constant energy prices (fixed at their 2017 levels) during the period of 2018-2030, the growth rate of economy-wideCO2emissions will
reach an average of 3.32% per annum along the baseline. In other words, emissions grow at a slightly
higher rate than GDP.
4.2 Carbon Tax Scenarios
In CGE modelling, a change in a policy variable/parameter or a set of policy variables/parameters is
defined as a shock process or scenario. The effects of the scenario are given as the paths of variables that are solved within the model and are reported in terms of a percentage change with respect to the
baseline. To investigate the impacts of an incremental increase in the carbon tax, we develop two carbon
tax scenarios. In the first scenario, namelyCT1, the carbon tax per ton equivalent ofCO2 is increased
to C40 in 2019 and then increased by C5 per annum reaching C95 in 2030. In an alternative policy
scenario, namelyCT2, the carbon tax per ton equivalent ofCO2 is increased to C40 in 2019 and then
increased by C10 per annum reaching C150 in 2030.
In the following subsections, the results of scenarios defined above will be presented relative to the
baseline. The main results from the baseline that should be kept in mind when interpreting the scenario
4.3 Energy Prices
We first examine how the implementation of a higher carbon tax impact the prices of energy commodities.
Table1shows the percentage changes in energy commodity prices for 2019, 2020, 2025 and 2030
com-pared to the baseline. Note that along the baseline, all prices of the major energy commodities decline, relative to their levels in 2014, due to the downward international trend. However, incremental increases
[image:11.612.154.474.231.400.2]in the carbon tax reverse this downward trend significantly.
Table 1: Changes in Purchaser (Retail) Prices of Energy Commodities percentage changes with respect to baseline
Peat Coal Gasoline Kerosene
CT1 CT2 CT1 CT2 CT1 CT2 CT1 CT2
2019 2.72 3.67 3.54 4.22 4.82 5.50 2.99 3.68
2020 3.02 4.30 4.17 5.46 5.77 7.38 3.48 4.64
2025 4.49 7.77 7.35 11.76 10.55 16.87 5.96 9.54
2030 5.91 11.47 10.59 18.20 15.39 26.48 8.51 14.59
Fuel oil LPG Diesel Natural gas
CT1 CT2 CT1 CT2 CT1 CT2 CT1 CT2
2019 1.93 2.66 6.41 7.08 6.40 7.08 3.09 3.85
2020 2.14 3.06 7.76 9.77 7.75 9.76 3.60 4.84
2025 3.25 5.09 14.57 23.34 14.55 23.32 6.18 9.88
2030 4.37 7.11 21.46 37.10 21.43 37.07 8.82 15.03
Along the scenario path ofCT1 ( C40 in 2019 and increasing by C5 each year after that), the results
show that the prices of gasoline, diesel, and LPG are particularly impacted. With an over 6% increase in the price of diesel and LPG in 2019, rising to a more than 20% in 2030. Gasoline prices increase by
almost 5% in 2019 and over 15% in 2030. Though a significant portion of coal used is exempt from
the carbon tax of C20 and imposed a minimum fee of C4 per tonne of carbon, we assume here that this minimum charge increases in line with the carbon tax. The resulting impacts on coal prices are an
increase of more than 3% in 2019 and more than 10% in 2030. The prices of kerosene and natural gas
also increase quite sharply by 3% in 2019 and more than 8% in 2030. The price of peat increases by almost 3% in 2019 and 6% in 2030. As domestic peat production declines, the price of peat increases due
to slow switching process in the consumption profiles of final users. Fuel oil is the least impacted, with a
less than 2% increase in 2019 and more than 4% in 2030. Naturally, the magnitudes of price increases are larger along the path ofCT2 than the path ofCT1. These are shown to illustrate the potential impacts of
a further increase in the carbon tax and to illuminate whether there are any non-linearities in the impacts. The results show that prices increase uniformly with the carbon tax increases, meaning that doubling the
4.4 Impacts Across Sectors
Here we examine the impacts across sectors of an increasing carbon tax. Though some sectors will
expe-rience significant negative impacts from a carbon tax increase, others will benefit. Changes in the sectoral
value-added of the major carbon-emitting sectors (and hence the largest users of carbon commodities) are shown in Table2. The transportation sectors and petroleum production are the most negatively affected
sectors due to the increasing costs of production. The water transportation sector has no substitution
op-portunity across energy commodities due to the structure of production. As the sector’s demand on diesel is inevitable and diesel is the most affected commodity concerning changes in its price, the decline in the
[image:12.612.105.522.280.530.2]economic activity of the water transportation sector is significant.
Table 2: Changes in Value-added of Selected Activities percentage changes with respect to baseline
Agriculture Chemical Prod. Basic Pharm. Prod. Food-Bev.-Tobacco
CT1 CT2 CT1 CT2 CT1 CT2 CT1 CT2
2019 0.08 0.13 0.23 0.35 0.24 0.37 0.06 0.12
2020 0.09 0.14 0.28 0.42 0.30 0.45 0.07 0.12
2025 0.14 0.23 0.53 0.82 0.58 0.89 0.12 0.18
2030 0.19 0.31 0.79 1.24 0.86 1.34 0.18 0.28
Peat Petroleum Electricity Public Trans.
CT1 CT2 CT1 CT2 CT1 CT2 CT1 CT2
2019 -2.93 -3.28 -2.81 -3.31 -0.72 -0.88 -1.12 -1.21
2020 -3.48 -4.43 -3.47 -4.48 -0.89 -1.19 -1.41 -1.76
2025 -6.10 -10.06 -6.59 -9.79 -1.74 -2.68 -2.86 -4.42
2030 -8.45 -15.27 -9.36 -14.24 -2.52 -4.02 -4.25 -6.86
Accom & Hotels Financial Ser. Health Water Trans.
CT1 CT2 CT1 CT2 CT1 CT2 CT1 CT2
2019 0.54 0.71 0.16 0.24 0.14 0.07 -2.13 -2.19
2020 0.60 0.84 0.20 0.29 0.19 0.18 -2.65 -3.18
2025 0.87 1.37 0.39 0.60 0.42 0.64 -5.06 -7.46
2030 1.08 1.76 0.59 0.92 0.59 0.95 -7.17 -10.85
On the other hand, chemical products, basic pharmaceutical products, food, beverage, and tobacco,
accommodation and hotels, and financial services are affected positively as households and firms switch their consumption patterns towards less energy-intensive commodities.
Sectoral labour demands also change in line with declining sectoral economic activities as can be
seen in Table3. Notice that the dramatic decline in the labour demand of peat sector comprises not only changes in the carbon tax but also the effects of switching of peat production to electricity. Notice
that although peat production declines, the sectoral employment has an upward trend along the baseline.
On the other hand, increasing the carbon tax reverses this process and leads to a decline in sectoral employment and allows the Irish economy to reallocate the employees in the peat sector to other sectors.
increase their labour demands, in line with the increasing volumes of sectoral value added.
Table 3: Changes in Labour Demand of Selected Activities percentage changes with respect to baseline
Agriculture Chemical Prod. Basic Pharm. Prod. Food-Bev.-Tobacco
2019 0.15 0.30 0.37 0.56 0.42 0.61 0.07 0.20
2020 0.14 0.27 0.43 0.64 0.49 0.72 0.05 0.15
2025 0.09 0.16 0.73 1.13 0.86 1.32 -0.01 0.00
2030 0.07 0.12 1.07 1.67 1.25 1.95 -0.01 -0.03
Peat Petroleum Electricity Public Trans.
CT1 CT2 CT1 CT2 CT1 CT2 CT1 CT2
2019 -4.79 -4.36 -4.04 -4.04 -0.96 -0.83 -1.55 -1.43
2020 -6.13 -6.94 -5.01 -5.92 -1.23 -1.37 -1.97 -2.26
2025 -12.66 -18.64 -9.50 -14.01 -2.55 -3.86 -4.03 -6.17
2030 -18.89 -28.73 -13.42 -20.36 -3.79 -6.08 -5.97 -9.66
Accom & Hotels Financial Ser. Health Water Trans.
CT1 CT2 CT1 CT2 CT1 CT2 CT1 CT2
2019 0.64 0.84 0.21 0.28 0.15 0.07 -2.50 -2.44
2020 0.70 0.98 0.25 0.34 0.21 0.20 -3.12 -3.64
2025 0.99 1.56 0.46 0.70 0.47 0.71 -5.95 -8.74
2030 1.22 1.99 0.70 1.09 0.65 1.05 -8.39 -12.69
4.5 Macroeconomic Impacts
In this section we discuss the overall macroeconomic impacts of an increasing carbon tax. Table4shows
the percentage changes in selected macroeconomic aggregates up to 2030 along the two carbon tax sce-nario paths with respect to the baseline. The results indicate that incremental increases in the carbon tax
have insignificant effects on the level of real GDP. For example, along the path ofCT1, the real GDP
decreases by 0.5% by 2030, relative to its level along the baseline. Similarly,CT2 with an incremental increase in the carbon tax by C10 towards 2030 affects the level of real GDP by 0.66%. The results
indi-cate that the growth rate of real GDP drops to 3.28% and 3.27%, respectively, in the medium-run from its medium-run projection of 3.3%. ComparingCT1 andCT2, it is evident that a carbon tax that increases
at twice the rate does not double the impact on GDP. The increase in the overall consumer price index,
i.e. the overall cost-of-living, increases by less than 2% until 2025 and reaches to 2.5% in 2030, relative to the baseline, along the path ofCT1.
Although the price elasticities of energy commodities are low, their domestic consumptions (variable
QSc,t in equation1) decline as the carbon tax rises. However, as the relative changes in carbon tax
out-weigh the declines in quantities, the total carbon tax collection of the government increases, relative to its
baseline level. Note that in the baseline there was a positive trend in carbon tax collections due to
hand, it reaches 2.3, 3.95, and 5.23 fold its baseline level along the path ofCT2.
Table 4: Changes in Main Macroeconomic Aggregates percentage changes with respect to baseline
Real GDP Real Gov. rev. Debt-to-GDP Ratio Carbon Tax Rev.*
CT1 CT2 CT1 CT2 CT1 CT2 CT1 CT2
2019 -0.30 -0.36 -0.30 -0.32 -3.08 -4.98 87.78 87.82
2020 -0.31 -0.39 -0.35 -0.40 -2.76 -4.72 108.00 127.74
2025 -0.40 -0.52 -0.64 -0.80 -0.91 -2.19 200.23 295.49
2030 -0.49 -0.66 -0.94 -1.20 0.98 0.84 279.84 423.07
Capital Stock Overall CPI Wage Rate* Real Trade Bal.
CT1 CT2 CT1 CT2 CT1 CT2 CT1 CT2
2019 -0.37 -0.60 1.47 2.21 0.93 1.58 -0.10 -0.21
2020 -0.36 -0.57 1.55 2.36 0.92 1.54 -0.07 -0.18
2025 -0.29 -0.46 1.98 3.17 0.89 1.45 0.20 0.18
2030 -0.23 -0.37 2.47 4.10 0.93 1.50 0.67 0.90
Note:The variables in real terms are measured in 2014 prices. The variables with the sign “*” are in nominal terms.
Along both carbon tax scenario paths, the total tax collections on both production and domestic
sales decrease in real terms. Tax collections on production decrease by around 5% due to a decline in economic activity and tax collections on domestic sales decrease by around 2% due to the decline in
domestic consumption. Since the share of the carbon tax in total revenues of the government is quite low
in 2014 (around 2.3%), the total government revenue declines in real terms. The effects are within the range of 0.95% and 1.2%, relative to the baseline, along the scenario paths ofCT1 andCT2, respectively.
The results show an initial improvement in the debt-to-GDP ratio, however, towards the medium-run,
the public savings decline and the debt-to-GDP ratio increases, although the effect is less than 1%. The initial improvement is due to an increase in nominal GDP. Though economic activity slows down in real
terms, increasing commodity prices lead to a higher nominal GDP and a lower debt-to-GDP ratio. The
nominal GDP growth is boosted by government expenditure behaviour. Firstly, as the GDP increases, government consumption also increases due to its pro-cyclical behaviour and, in turn, refuels the GDP
growth. Secondly, as the overall CPI increases, the government’s unilateral transfers to households also
increase, increasing households’ consumption. Thirdly, the government’s revenue cycling scheme also increases household disposable income. In the very short-run, the increase in GDP outweighs the increase
in government’s total expenditures and the debt-to-GDP ratio declines. In the medium run government
expenditures increase further, resulting in a decline in the public savings and an increase to debt-to-GDP ratio.
Increasing labour demand due to a shift towards consumption of services, which are more less car-bon intensive and more labour intensive, rises the wage rate, increasing wage income of households.5
There-Although the cost of labour increases, firms also lower their capital demand due to declining economic
activity.
The real trade balance, i.e. the net exports in 2014 prices, slightly declines in 2019 and 2020 after
the sharp increases in the carbon tax. However, the incremental increases in the carbon tax have positive
impacts on the trade balance of Ireland, with an increase of up to 0.9% in 2030, relative to the baseline. In other words, the Irish economy is able to absorb the cost-push effects of increasing carbon tax in 5 years.
4.6 Emissions Impacts
Table5shows the changes in emissions of the selected major emitter sectors, in addition to the residen-tial emissions and the total economy-wide emissions.6 The emissions provided in Table5 include total sectoral emissions. Changes in the sectoral emissions, which are calculated based on their intermediate
[image:15.612.134.494.343.512.2]input demands are substantial for the transportation sectors, peat, electricity, and petroleum sectors which also saw declines in their economic activities, as shown in Table2. However, although the value-added
Table 5: Changes in Emissions percentage changes with respect to baseline
Agriculture Peat Petroleum Residential
CT1 CT2 CT1 CT2 CT1 CT2 CT1 CT2
2019 -8.33 -8.20 -14.15 -16.32 -4.48 -4.68 -2.56 -2.51
2020 -10.27 -12.00 -16.91 -21.97 -5.50 -6.63 -3.23 -3.83
2025 -19.08 -27.72 -29.33 -44.08 -10.20 -15.04 -6.52 -10.11
2030 -26.55 -39.32 -39.73 -58.56 -14.30 -21.66 -9.64 -15.85
Electricity Pub Transp. Water Transp. Economy-wide
CT1 CT2 CT1 CT2 CT1 CT2 CT1 CT2
2019 -4.67 -4.80 -11.01 -10.96 -11.59 -11.57 -5.23 -5.27
2020 -5.73 -6.90 -13.51 -15.82 -14.19 -16.62 -6.46 -7.66
2025 -10.73 -16.41 -24.65 -35.33 -25.66 -36.50 -12.17 -18.07
2030 -15.25 -24.45 -33.86 -49.00 -34.99 -50.10 -17.21 -26.39
of agriculture increases (due to increased demand), total carbon emissions of agriculture decline which
indicates that the sector switches its intermediate input demands towards non-energy commodities, to
some extent, and its energy demand to electricity.
The residential emissions, i.e. the emissions based on residential heating and lighting, drops by
around 3% in the short-run, along both carbon tax scenario paths. This predominantly due to decreasing energy demand of households, but there are limited amounts of switching towards less-carbon intensive
energy commodities. The effects become more prominent in towards 2030 and reaches almost 16% along
the path ofCT2.
inelastic supply of labour. However, a labour market distortion may cause the opposite result depending on the modelling choice and the level of rigidity in the labour market.
6 Since the introduction of the Emission Trading System (ETS) to the I3E framework is still in progress, the sectoral emissions
[image:15.612.134.493.345.512.2]The most important implication of increasing carbon tax is a decline in economy-wide emissions
by 17.2% and 26.4% by 2030, along the carbon tax scenario paths, respectively. In other words, the annual average growth rate of total emissions drop to 3.27% and 3.24%, along the paths ofCT1 andCT2,
respectively. This indicates that emissions grow at a lower rate that GDP. The total economy-wideCO2
emissions of Ireland reach 51.6 and 45.9 million ton equivalent by 2030 along the carbon tax scenarios paths, respectively. These results indicate that the carbon tax breaks the link between carbon emissions
and economic growth which helps Ireland in her transition to a decarbonised economy. It should also be noted that the level of the economy-wide emissions was 48.1 million ton equivalent ofCO2in 2005.
The economy-wide emission figure by 2030 indicates that the total Irish emissions will be 7.2% higher
than its 2005 emissions if the government follows the path ofCT1. On the other hand, along the path of
CT2, the economy-wide emissions will be 4.6% lower in 2030. These results indicate that Ireland will
not reach its EU targets with a carbon tax alone, even she follows the path ofCT2.
4.7 Household Impacts
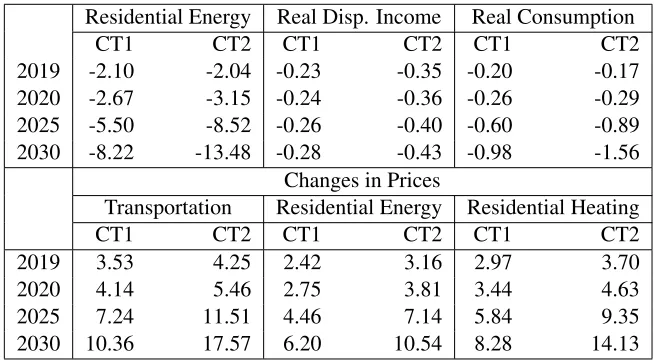
In this section, we discuss how households will be impacted by an increasing carbon tax. For the house-hold sector, the I3E model defines several composite commodities such as transportation, residential
energy and residential heating. Table6shows the changes in the household-specific prices of these
com-posite commodities, and also the changes in the overall consumer price index. Accordingly, the cost of transportation increases by less than 5% in the short-run and the effect is slightly more than 10% along
the path ofCT1. The increase in price of residential heating is higher (8.3% in 2030 forCT1) than the increase in price of residential energy (6.2% in 2030) due to the fact that the substitution elasticities
across the commodities in the former is lower than those of in the latter. As the price of residential energy
[image:16.612.149.476.526.706.2]increases (middle-lower panel of Table6), households consume less residential energy (left-upper panel of Table6).
Table 6: Household Level Results percentage changes with respect to baseline
Residential Energy Real Disp. Income Real Consumption
CT1 CT2 CT1 CT2 CT1 CT2
2019 -2.10 -2.04 -0.23 -0.35 -0.20 -0.17
2020 -2.67 -3.15 -0.24 -0.36 -0.26 -0.29
2025 -5.50 -8.52 -0.26 -0.40 -0.60 -0.89
2030 -8.22 -13.48 -0.28 -0.43 -0.98 -1.56
Changes in Prices
Transportation Residential Energy Residential Heating
CT1 CT2 CT1 CT2 CT1 CT2
2019 3.53 4.25 2.42 3.16 2.97 3.70
2020 4.14 5.46 2.75 3.81 3.44 4.63
2025 7.24 11.51 4.46 7.14 5.84 9.35
Table6also provides the results of changes in household disposable income and real consumption of
households. i.e. changes in the level of the composite commodity. Although nominal disposable income of households increases due to both increases in wage income and recycling of carbon tax revenues
by the government, real disposable income decreases due to inflation. Theoretically, households have
pre-cautionary savings; as they observe an adverse shock in the economy, they smooth their nominal consumption expenditures to keep the level of utility constant through time and increase their savings.
As prices increase due to an increasing carbon tax, Irish households lower their real consumption and increase their savings in nominal terms with the help of increasing nominal disposable income.
5
Conclusion
Ireland is under significant pressure to reach her EU GHG emissions targets for 2020 and 2030. Designing efficient and effective climate policies is imperative to achieve these targets. A carbon tax is considered
the cornerstone of an effective climate policy, where pricing carbon usage results in economically efficient
emission reduction, i.e. reductions are made where they have least impact on the economy. A mayor concern when implementing a carbon tax increase, is its impact on households. Several suggestions have
been put forward to lighten the burden felt by households, the most notable of these is the concept of
recycling carbon tax revenues back to households. Currently, the Irish carbon tax stands at 20 C per tonne ofCO2, in this paper we examine the economic and emission reduction impacts of an incremental
increase in the Irish carbon tax. Understanding the economic impacts and emission reduction potential of an increase in the carbon tax as well as the potential of a revenue recycling scheme to assist households
is essential for formulating a sound carbon tax policy in Ireland.
In this paper we develop a computable general equilibrium model; the Ireland, Environment, Energy and Economy (I3E) model. This model uses data to describe the interactions between various production
sectors, the government, the rest of the world and households. In this manner it can estimate sector level
impacts as well as macroeconomic impacts of a carbon tax increase. Applying I3E, we examine two potential carbon tax paths including a revenue recycling scheme of a lump transfer of carbon tax revenues
to households. In the first, the carbon tax is set to C40 in 2019 and then increased by C5 per annum until
2030. In other words, the carbon price per ton equivalent ofCO2emission is doubled in 2019, relative to
2018, and again doubled in 2027, relative to 2019. In order to provide a policy alternative, the carbon tax
is set to C40 in 2019 and then increased by C10 per annum until 2030. In other words, the carbon price
per ton equivalent ofCO2emission is doubled in 2019, tripled in 2021, four-folded in 2023, relative to its
level in 2018.
Our results show that energy and transport sectors will be hit hardest by an increase in the carbon tax,
while chemical products, basic pharmaceutical products, food, beverage, and tobacco, accommodation and hotels, and financial services benefit the most. Due to a consumption shift towards services, which
are less carbon intensive, but more labour intensive, labour demand with a concomitant increase in wages.
Households face significantly higher energy prices, overall price levels, however, increase only
mod-erately. Due to the increased wages and government transfers from the carbon tax revenue recycling scheme, households’ nominal disposable income increases. Though disposable income increases, due to
price increases households decide to consume less and save more. Due to higher overall price level, i.e.
the cost-of-living, real disposable income decreases, although the effect is less than 0.3% in 2030. Concerning the potential emission reductions of an increased carbon tax, our estimates show that an
increased carbon tax can reduce emissions significantly. Due to the strong projected economic growth, however, even a stringent carbon tax path will not bring Ireland close to her emissions targets.
Though the I3E model presents a significant improvement to the literature on the impacts of an Irish
carbon tax, further research is needed to address the shortcomings of the modelling framework applied here. Firstly, a more detailed representation of the ETS sector, including future ETS price projections,
would need to be developed to fully understand the potential impacts of an increased carbon tax.
Sec-ondly, international energy price projections should be included to present a more realistic representation of energy prices. Finally, a distinction between household types would allow for a better understanding
of the distributional impacts of an increase in the carbon tax.
References
Bergin, A., Conroy, N., Rodriguez, A. G., Holland, D., McInerney, N., Morgenroth, E. L., & Smith, D.
(2017). COSMO: A new COre Structural MOdel for Ireland(Tech. Rep.). ESRI Working Paper.
Bergin, A., FitzGerald, J., & Kearney, I. (2004). The Macro-Economic Effects of Using Fiscal
Instruments to Reduce Greenhouse Gas Emissions (Tech. Rep.). Economic and Social Research
Institute (ESRI). https://www.esri.ie/publications/the-macro-economic-effects-of
-using-fiscal-instruments-to-reduce-greenhouse-gas-emissions-2001-eep-ds8-m1
-final-report-prepared-for-the-environmental-protection-agency/.
Conefrey, T., FitzGerald, J. D., Valeri, L. M., & Tol, R. S. J. (2013). The impact of a carbon tax on economic growth and carbon dioxide emissions in Ireland. Journal of Environmental Planning and
Management,56(7), 934–952. doi: 10.1080/09640568.2012.709467
Cronin, D., & McQuinn, K. (2018). The Cyclicality of Irish Fiscal Policy Ex-Ante and Ex-Post. The
Economic and Social Review,49(1), 1-16.
de Bruin, K. C., & Yakut, A. M. (2018).The Economic and Environmental Impacts of Increasing the Irish
Carbon Tax(Research Series, No. 79). Economic and social Research Institute. doi: 10.26504/rs79
EPA. (2018a). Ireland’s Greenhouse Gas Emissions Projections 2017-2035(Report). Environmental
Protection Agency (EPA). http://www.epa.ie/pubs/reports/research/climate/EPA%20RR%
EPA. (2018b). Ireland’s Provisional Greenhouse Gas Emissions 1990-2017. http://www.epa.ie/
pubs/reports/air/airemissions/ghgemissions2017/.
FitzGerald, J., Hore, J., & Kearney, I. (2002).A Model for Forecasting Energy Demand and Greenhouse Gas Emissions in Ireland(Papers No. WP146). Economic and Social Research Institute (ESRI).
Hayashi, F. (1982). Tobin’s Marginal q and Average q: A Neoclassical Interpretation. Econometrica,
50(1), 213-224.
IPCC. (2014). Climate Change 2014: Synthesis Report. Contribution of Working Groups I, II and III
to the Fifth Assessment Report of the Intergovernmental Panel on Climate Change(R. K. Pachauri &
L. A. Meyer, Eds.). Intergovernmental Panel on Climate Change, Geneva, Switzerland.
SEAI. (2019). Energy Balances since 1990. https://www.seai.ie/resources/publications/
Energy-Balances-1990-2017.xlsx.
Wissema, W., & Dellink, R. (2007). AGE analysis of the impact of a carbon energy tax on the Irish
Appendix A
Lists of Activities and Commodities
Table A.1: Activities
Abbreviation Name NACE Codes σBEN σFU E σBH σOT E
ACC Accommodation and Hotel Services 55-56,79 1.3 0 0
AGR Agriculture 1-3 1.3 0 0
ATS Air Transportation 51 0 1.1 1.1
BFM Basic Metal Manufacturing 24-25 1.3 1.1 1.1
BPP Basic Pharmaceutical Products 21 1.3 0 0
CHE Chemical Products 20 1.3 1.3 1.3
CON Construction 41-43 1.3 0 1.3
EDU Education Sector 85 1.3 1.1 1.3
FBT Food, Beverage and Tobacco 10-12 1.3 1.3 1.3
FSR Financial Services 64-66,77 1.3 0 0
HHS Health Sector 86-88 1.3 1.1 1.1
HTP High-Technology Products 26-28 1.3 1.3 1.3
LTS Land Transportation 49 1.1 0 1.1
NGS Natural Gas Supply 0 1.1 0
OIN Other Industrial Products 17,18,33 1.3 1.3 1.1
OMN Other Mining Products 1.3 1.1 1.3
ONM Other Non-metallic Products 23 1.3 1.1 1.3
OTM Other Manufacturing 31-32 1.1 1.3 0
PEA Peat 1.3 1.1 1.3
PET Petroleum 0 0 0
PUB Public Sector 84 1.3 1.1 1.3
RES Real Estate Services 68 1.3 0 0
RUP Rubber and Plastic Products 22 1.3 1.3 1.1
SER Other Services remaining* 1.3 0 0
TEL Telecommunication Services 61 1.3 0 0
TEX Textile 13-15 1.3 1.3 1.1
TRD Trade 45-47 1.3 1.3 0
TRE Transportation Equipment 29-30 1.3 1.3 0
WAT Water and Sewerage 36,37-39 1.3 1.3 1.1
WTS Water Transportation 50 0 0 0
WWP Wood and Wood Products 16 1.3 1.1 0
ELC Electricity 1.1 1.3
*: It excludes NACE codes 5-9 (Mining, Quarrying and extraction), 19 (Petroleum Products), and 35 (Electricity and Gas Supply).
Table A.2: Commodities
AGR Agriculture BFM Basic Metal Manufacturing
PEA Peat HTP High-Tech Products
COA Coal TRE Transportation Equipment
CRO* Crude Oil ELC Electricity
OMN* Other Mining Products NGS Natural Gas Supply
FBT Food, Beverage and Tobacco WAT Water and Sewerage
TEX Textile CON Construction
WWP Wood and Wood Products TRD Trade
OIN Other Industrial Products LTS Land Transportation
GAL Gasoline WTS Water Transportation
KRS Kerosene ATS Air Transportation
FUO Fuel-oil ACC Accommodation and Hotel Services
LPG Liquid Petroleum Gas TEL Telecommunication Services
DIE Diesel FSR Financial Services
OPP Other Petroleum Products RES Real Estate Services
OTM Other Manufacturing PUB Public Sector
CHE Chemical Products EDU Education Sector
BPP Basic Pharmaceutical Products HHS Health Sector
RUP Rubber and Plastic Products SER Other Services
ONM Other Non-metallic Products
Year
Number
Title/Author(s)
2019618 Household savings constraints, uncertainty and
macroprudential policy
Philip Economides, Kieran McQuinn, Conor O’Toole
617 It’s not just for boys! Understanding gender differences in STEM
Judith Delaney, Paul Devereux
616 Optimal development of electricity generation mix
considering fossil fuel phase-out and strategic multi-area interconnection
Desta Fitiwi, Muireann Lynch, Valentin Bertsch
615 The effects of spatial position of calorie information on choice, consumption and attention
Deirdre A. Robertson, Pete Lunn
614 The determinants of SME capital structure across the lifecycle
Maria Martinez-Cillero, Martina Lawless, Conor O’Toole
613 Monetary policy normalisation and mortgage arrears in
a recovering economy: The case of the Irish residential market
Rachel Slaymaker, Conor O’Toole, Kieran McQuinn, Mike Fahy
612 Can official advice improve mortgage-holders’
perceptions of switching? An experimental investigation
Shane Timmons, Martina Barjaková, Terence J. McElvaney, Pete Lunn
611 Underestimation of money growth and pensions:
Experimental investigations
Féidhlim P. McGowan, Pete Lunn, Deirdre A. Robertson
610 Housing Assistance Payment: Potential impacts on
financial incentives to work
Barra Roantree, Mark Regan, Tim Callan, Michael Savage, John R. Walsh
609 Predicting farms’ noncompliance with regulations on
nitrate pollution
Pete Lunn, Seán Lyons and Martin Murphy
2018
608 How openness to trade rescued the Irish economy
Kieran McQuinn, Petros Varthalitis
607 Senior cycle review: Analysis of discussion in schools on the purpose of senior cycle education in Ireland
Joanne Banks, Selina McCoy, Emer Smyth
606 LNG and gas storage optimisation and valuation:
Lessons from the integrated Irish and UK markets
Mel T. Devine, Marianna Russo
605 The profitability of energy storage in European
electricity markets