Working Paper Document
ECONOMIC IMPORTANCE OF
THE BELGIAN PORTS :
Flemish maritime ports, Liège port complex
and the port of Brussels – Report 2014
by George van Gastel
Editor
Jan Smets, Governor of the National Bank of Belgium
Statement of purpose:
The purpose of these working papers is to promote the circulation of research results (Research Series) and analytical studies (Documents Series) made within the National Bank of Belgium or presented by external economists in seminars, conferences and conventions organised by the Bank. The aim is therefore to provide a platform for discussion. The opinions expressed are strictly those of the authors and do not necessarily reflect the views of the National Bank of Belgium.
Orders
For orders and information on subscriptions and reductions: National Bank of Belgium, Documentation - Publications service, boulevard de Berlaimont 14, 1000 Brussels
Tel +32 2 221 20 33 - Fax +32 2 21 30 42
The Working Papers are available on the website of the Bank: http://www.nbb.be
© National Bank of Belgium, Brussels
All rights reserved.
Reproduction for educational and non-commercial purposes is permitted provided that the source is acknowledged.
Abstract
This paper is an annual publication issued by the Microeconomic Analysis service of the National Bank
of Belgium.
The Flemish maritime ports (Antwerp, Ghent, Ostend, Zeebrugge), the Autonomous Port of Liège and
the port of Brussels play a major role in their respective regional economies and in the Belgian
economy, not only in terms of industrial activity but also as intermodal centers facilitating the commodity
flow.
This update paper
1provides an extensive overview of the economic importance and development of the
Flemish maritime ports, the Liège port complex and the port of Brussels for the period 2009 - 2014, with
an emphasis on 2014. Focusing on the three major variables of value added, employment and
investment, the report also provides some information based on the social balance sheet and an
overview of the financial situation in these ports as a whole. These observations are linked to a more
general context, along with a few cargo statistics.
Annual accounts data from the Central Balance Sheet Office were used for the calculation of direct
effects, the study of financial ratios and the analysis of the social balance sheet. The indirect effects of
the activities concerned were estimated in terms of value added and employment, on the basis of data
from the National Accounts Institute. As a result of the underlying calculation method the changes of
indirect employment and indirect value added can differ from one another.
The developments concerning economic activity in the six ports in 2013 - 2014 are summarised in the
table on the next page:
In 2014 the growth of maritime traffic in the Flemish sea ports was once again due solely to
developments in the port of Antwerp. However, that did not necessarily mean that direct value added
followed the same trend: except for the port of Zeebrugge, all other Flemish ports recorded an increase.
Direct employment is continuing to decline, except in the port of Ghent where it remains steady.
Investment appears to be picking up, after last year’s weak figures.
Cargo traffic in the ports of Liège and Brussels was up in 2014, but that did not result in any increase in
value added. The decline in direct employment also persisted, certainly in the port of Liège.
This report provides a comprehensive account of these issues, giving details for each economic sector,
although the comments are confined to the main changes that occurred in 2014.
This report is available for download at the following address http://www.nbb.be.
Key words: branch survey, maritime cluster, subcontracting, indirect effects, transport, intermodality,
public investments.
JEL classification: C67, H57, J21, L22, L91, L92, R15, R34 and R41.
1
Ports Value added (current prices)
Employment Investment (current prices)
Cargo traffic
____
€ million Change 2013-2014 (in p.c.)
FTE
Change 2013-2014 (in p.c.)
€ million Change 2013-2014 (in p.c.)
x 1,000 tonnes
Change 2013-2014 (in p.c.)
ANTWERP Direct ...9,923.8 + 1.4 60,586 - 1.2 3,229.0 + 37.0
Indirect ...9,035.7 + 2.7 82,068 - 0.7
TOTAL ...18,959.5 + 2.0 142,654 - 0.9 3,229.0 + 37.0 199,012 + 4.2
GHENT Direct ...3,575.4 + 4.9 27,602 + 0.6 403.6 - 4.3
Indirect ...3,898.2 + 6.8 34,443 + 0.4
TOTAL ...7,473.6 + 5.9 62,044 + 0.5 403.6 - 4.3 25,889 - 0.3
OSTEND Direct ...492.4 + 1.4 4,957 - 1.7 118.9 + 56.1
Indirect ...355.2 - 0.4 4,275 - 0.4
TOTAL ...847.6 + 0.7 9,232 - 1.1 118.9 + 56.1 1,431 - 21.3
ZEEBRUGGE Direct ...935.8 - 4.5 9,365 - 3.7 220.1 + 0.2
Indirect ...767.4 - 2.6 10,192 - 0.8
TOTAL ...1,703.2 - 3.7 19,557 - 2.2 220.1 + 0.2 42,548 - 0.7
FLEMISH Direct ...14,927.4 + 1.9 102,510 - 1.0 3,971.6 + 29.2
MARITIME Indirect ...13,040.2 + 3.0 123,917 - 0.5
PORTS TOTAL ...27,967.6 + 2.4 226,427 - 0.7 3,971.6 + 29.2 268,880 + 2.8
LIÈGE Direct ...1,130.9 - 5.9 8,165 - 7.9 195.7 - 8.4
Indirect ...1,186.0 - 7.8 11,773 - 8.2
TOTAL ...2,316.9 - 6.9 19,937 - 8.1 195.7 - 8.4 15,001 + 0.4
BRUSSELS Direct ...473.8 - 2.2 4,032 - 1.3 53.0 - 22.6
Indirect ...342.2 - 3.4 3,706 - 3.8
TOTAL ...816.0 - 2.7 7,738 - 2.5 53.0 - 22.6 4,439 + 2.7
BELGIAN Direct ...16,532.0 + 1.2 114,706 - 1.5 4,220.3 + 25.7
PORTS Indirect ...14,089.9 + 2.2 135,736 - 1.1
TOTAL ...30,622.0 + 1.6 250,442 - 1.3 4,220.3 + 25.7 288,320 + 2.7
Source: NBB (calculations based on the Belgian accounts filed with the Central Balance Sheet Office, and the Belgian IOTs). For ports with economic linkages between them, a portion of the indirect effect calculated by port is cancelled out when the calculation is done at a more aggregate level, i.e. for a group of ports. The sum of the indirect effects by port is thus greater than the total indirect effects calculated for the ports as a whole.
Corresponding author:
NBB, Microeconomic Information department, e-mail: george.vangastel@nbb.be
This paper was made with the technical support and the expertise of Mr Marc Van Kerckhoven.
Research results and conclusions expressed are those of the author and do not necessarily reflect the
views of the National Bank of Belgium or any other institution to which the author is affiliated. All
remaining errors are ours.
Contents
Foreword ... 4
Introduction ... 5
1
ECONOMIC IMPORTANCE OF THE BELGIAN PORTS... 8
1.1
Traffic in the Belgian ports ... 8
1.2
Competitive position of the Belgian ports ... 9
1.3
Direct and indirect value added in the Belgian ports... 11
1.4
Direct and indirect employment in the Belgian ports ... 12
1.5
Investment in the Belgian ports ... 13
1.6
Demography of the Belgian ports ... 14
1.7
Breakdown of the variables by company size ... 15
1.8
Social balance sheet in the Belgian ports ... 16
1.9
Financial ratios in the Belgian ports ... 19
1.10
Financial health in the Belgian ports ... 20
2
PORT OF ANTWERP ... 22
2.1
Port developments ... 22
2.2
Value added ... 22
2.3
Employment ... 23
2.4
Investment ... 23
3
PORT OF GHENT... 27
3.1
Port developments ... 27
3.2
Value added ... 27
3.3
Employment ... 27
3.4
Investment ... 28
4
PORT OF OSTEND ... 32
4.1
Port developments ... 32
4.2
Value added ... 32
4.3
Employment ... 32
4.4
Investment ... 32
5
PORT OF ZEEBRUGGE ... 37
5.1
Port developments ... 37
5.2
Value added ... 37
5.3
Employment ... 38
5.4
Investment ... 38
6
LIÈGE PORT COMPLEX ... 42
6.1
Port developments ... 42
6.2
Value added ... 42
6.3
Employment ... 42
6.4
Investment ... 42
7
PORT OF BRUSSELS ... 47
7.1
Port developments ... 47
7.2
Value added ... 47
7.3
Employment ... 47
7.4
Investment ... 47
8
BRIEF SUMMARY ... 52
ANNEX 1: LIST OF NACE-BEL BRANCHES ... 54
ANNEX 2: DEFINITION OF THE FINANCIAL RATIOS ... 59
BIBLIOGRAPHY ... 60
Foreword
Every year the National Bank of Belgium publishes an update of the study of the economic importance
of the Flemish maritime ports, the Liège port complex and the port of Brussels. Two aspects of the
sector’s economic impact are highlighted: the direct effects and the indirect effects. The former concerns
the activities resulting from the presence of maritime and non-maritime enterprises and public services
in or near the ports, while the latter relates to the value added and employment generated by suppliers
and subcontractors serving these enterprises and based in Belgium.
The statistical data covers the period 2009 - 2014, but only the main developments recorded in the
period 2013 - 2014 are discussed in detail. The number of annexes is limited to:
the list of NACE-BEL 2008 branches.
the definition of the financial ratios.
The methodology remains mainly unchanged: the criteria for selecting firms and the analysis are the
same as in previous editions. The NACE-BEL 2008 code is used to select and classify companies by
sector. Owing to the use of the latest available statistical data (see introduction), the estimates of the
indirect effects may differ from those in previous publications.
Introduction
Objectives of the study and some comments on the methodology
The economic importance of the ports examined is analysed from three angles, namely the purely
economic angle, and the social and financial angles. The study only covers firms belonging to branches
of activity which have an economic link with the ports. That link is defined in relation to both a functional
and a geographical criterion.
The main developments in the period 2009 - 2014 concern the study of the following variables:
value added at current prices
2: the value which a firm adds to its inputs during the financial year via
the production process. The value added of a firm indicates its contribution to the wealth of the
country or region (in percentages of GDP). In accounting terms, this is calculated as the sum of staff
costs, depreciation and value adjustments, the operating profit or loss, provisions for liabilities and
charges, and certain operating expenses;
employment in full-time equivalents (FTE): the average workforce during the financial year. Direct
employment only covers employees on the payroll of the businesses concerned, indirect
employment also includes self-employed workers.
investment at current prices
3: this corresponds to the tangible fixed assets acquired during the year,
including capitalised production costs
4.
The economic impact of the ports under review is described on the basis of these three variables.
Employment and the social balance sheet are also taken into account in the analysis of the social
impact. That section deals in particular with working time, labour costs, the extent to which use is made
of external personnel, and the composition, movements and training of the labour force.
The financial analysis forms the third angle of the study; it is based on the examination of three financial
ratios and a financial health indicator, using a model designed by the Bank
5. The ratios in question are
the return on equity after taxes, liquidity in the broad sense, and solvency. The current edition presents a
financial analysis of Belgian ports taken as a whole. Readers wishing to compare the financial ratios of
an individual company with its sector ratios can find this information in the company reports published by
the Central Balance Sheet Office. These company reports are composed of five parts
6, one of which is
devoted to comparing the financial ratios of the company with those of its sector, and another of which is
devoted to situating the company in one of the ten categories of financial health based on its composite
financial health indicator. This comparison is more relevant than a comparison based principally on
geographic location, which would include a variety of business activities. The financial health indicator is
based on Belgian companies' annual accounts. This indicator is designed as a weighted combination of
variables, created by means of a model constructed in the same way as a failure prediction model. The
model takes the form of a logistic regression discriminating between failing and non-failing companies.
The indicator summarizes each company’s situation in a single value which takes account
simultaneously of the solvency, liquidity and profitability dimensions.
2
Unless otherwise stated, the text always indicates value added at current prices. Developments at constant prices (by volume) are explicitly mentioned. Value added at constant prices is calculated by means of the deflator of gross domestic product. 3
Unless otherwise stated, investment is always indicated at current prices. Developments at constant prices (by volume) are explicitly mentioned. Investment at constant prices is calculated by means of the deflator of gross fixed capital formation. 4
Decommissioning of assets is not taken into account. 5
See Vivet D. (2011), Development of a financial health indicator based on companies’ annual accounts, NBB, Working Paper No. 213 (Document series), Brussels.
6
The microeconomic data used in this study were obtained from the annual accounts filed with the
Central Balance Sheet Office
7and from the statistics produced by the National Accounts Institute (NAI
8).
The most recent annual accounts for the 2014 financial year included in this study were filed with the
Central Balance Sheet Office in February 2016
9. The data necessary to estimate the indirect effects up
to 2014, are also published by the NAI with a low frequency and after a certain time lag. The results of
the indirect effects are approximations and should be interpreted with caution. The latest updates were
included in the calculations, while the methodology remained unchanged. For more information, see the
2004 report published in June 2006
10.
The NACE-BEL 2008 classification is used for the purposes of selecting and ranking the companies by
sector. NACE-BEL 2008 is the classification system for economic activities employed by the National
Accounts Institute. The activity codes (NACE-BEL) for economic units have been harmonised between
the institutions making up the NAI, which should help give a more accurate and up-to-date picture of
economic reality. The harmonised NACE codes have been incorporated into the national accounts from
the year 2009 on. Among all the branches of activity followed by the NAI, 8.9 % of the value added of
non-financial corporations switched branch in 2012. Owing to differences in extrapolation methods from
one branch of activity to another, a marginal impact on the overall GDP figure has been recorded. This
harmonisation has an impact on the sample of enterprises used for the study and has also an impact on
the allocation of the companies into sectors.
In December 2013 the National Accounts Institute published an input-output table for 2010. In December
2015 the input-output table for 2010 was updated with the new accounting rules of the ESA 2010
standard
11and the harmonised NACE codes
12. The latest supply and use table relates to the year 2012.
These tables were used to produce estimates for the years 2009 to 2014. The reader must keep in mind
that indirect effects need to be interpreted with caution, and should be regarded more as an indicator of
the importance of the ports for the national and local economy rather than as an absolute value.
The indirect effects have been calculated for each port separately. For ports with economic linkages
between them, a portion of the indirect effect calculated by port is cancelled out when the calculation is
done at a more aggregate level, i.e. for a group of ports. The sum of the indirect effects by port is thus
greater than the total indirect effects calculated for the ports as a whole.
As part of the strategic plans for the port areas, the Flemish Region has established several land banks.
This acquired land is a compensation for land that disappears through the port development and
includes other land or results from land exchanges with farmers concerned. In this publication, the
amounts relating to these land banks are not included in the investments of the public sector. The
investment by the public sector to improve the maritime access to the different Belgian ports is also not
included.
7
A service of the National Bank’s Microeconomic Information Department. (See http://www.centralbalancesheetoffice.be). 8
The National Accounts Institute (NAI) set up by the law of 21 December 1994, links three institutions: the National Statistical Institute (NSI, now FPS Economy, SMEs, Self-employed and Energy – Directorate General of Statistics and Economic Information), the National Bank of Belgium and the Federal Planning Bureau. The NAI’s duties include drawing up the real national accounts and the input-output tables which are needed to estimate the indirect effects. The latest available data for calculating the indirect effects in this study were the input-output table for 2010 and the supply and use table for 2012.
9
Belgian firms are required to submit their annual accounts to the Central Balance Sheet Office by no later than seven months following the end of the financial year. A small proportion of firms -mainly small businesses or those in difficulties- fail to meet the obligation by that date. In February 2016, that percentage was negligible and the impact on the figures is minimal.
10
The methodology is presented in the introduction by Lagneaux F. (2006) and set out in full in annexes 1 to 4. The study is available on the following address: http://www.nbb.be > Publications and research > Economic/financial publications > Working papers > 2006 – No. 86.
11
Eurostat has formulated the European System of National and Regional Accounts (ESA) to provide a systematically detailed description of the EU economies, their components and relations with the other economies. The ESA is therefore used as the central reference point for the economic and social statistics of the EU and its Member States. The international systems of national accounts are revised from time to time to cater for new statistical requirements called for in response to changes in the contemporary economies and reflecting methodological developments.
12
Some of the results for years up to 2013 may differ from those stated in the earlier studies. That is due
mainly to the harmonisation of the NACE codes and in a lesser extent to the availability of more
accurate data on certain firms, information that is extrapolated into the past to ensure consistent time
series.
For a number of years, the National Bank’s port studies have been an important statistical source for the
various stakeholders concerned with their economic analysis. Since most port authorities and various
government bodies provide detailed accounts of maritime activities, the Bank sought scope for efficiency
and synergy. For that reason, this year’s publication will place more emphasis on the statistical section.
The commentary will give the general outline via the contribution from the port authorities. For the more
detailed, comprehensive account of developments, see the annual reports of the Belgian port authorities
and specialised publications such as those issued by the Flemish Port Commission.
International environment
Global GDP grew by 2.6 % in 2014. The advanced economies saw 1.7 % growth, roughly 0.5
percentage point higher than in the previous year. The United Kingdom and the United States recorded
growth of 2.9 % and 2.4 % respectively. In the euro zone, the negative growth was converted to
expansion of 0.9 %. However, growth in Russia was down by 0.7 percentage point to 0.6 %.
In the emerging economies, the growth slowdown continued, primarily owing to the disappointing
performance in Brazil, where GDP growth dropped from 3 % in 2013 to 0.1 % in 2014. China’s growth
figure remained relatively strong (7.4 %), despite a 0.4 percentage point fall.
1 ECONOMIC IMPORTANCE OF THE BELGIAN PORTS
1.1
Traffic in the Belgian ports
CHART 1 CARGO TRAFFIC IN THE BELGIAN PORTS
(indices 2009 = 100)
Sources: Port Authorities.
In 2014, maritime traffic in Flanders increased by around 2.8 % overall. That increase was due solely to
the substantial growth in the port of Antwerp. However, the decline in tonnage at Zeebrugge and Ghent
was modest in 2014. The port of Zeebrugge will see a decrease in 2015 owing to the tendency towards
cooperation and rationalisation in the shipping companies. The continuing downward trend at Ostend is
due to the port’s repositioning, focusing on a number of niche activities.
The port of Brussels recorded strong growth of 2.7 % while in Liège the increase was rather modest
(0.4 %).
In regard to container traffic, only two ports really count, namely Zeebrugge (representing almost 15.9 %
of total traffic) and Antwerp (83.8 %). Antwerp alone recorded significant growth of 5.9 %, while traffic
in Zeebrugge was more or less stable with an increase of 0.5 %. All things considered, that is still a
pleasing figure in view of the said developments in the shipping companies. The expansion of container
traffic in Antwerp seems to have halted the downward trend evident in recent years, so that the relative
share is now up slightly at 48 % of total traffic. Furthermore, traffic has now regained its 2010 level.
Roll-on/roll-off traffic recorded a modest rise of around 0.7 % in 2014. That growth was largely due to
developments at the biggest RoRo port, Zeebrugge, where this traffic was up by 4 %. In that port it is
cars which account for most of the growth, with an increase of 13.2 %. The port of Ghent also saw a
substantial 9 % rise in roll-on/roll-off traffic. Conversely, in the port of Antwerp the downward trend
continued, with a 2 % decline.
Except at the port of Ghent, where the figure of 0.5 % implied virtual stabilisation, the pressure on
conventional general cargo appeared to persist in all other ports in 2014. That category declined by
more than 4.6 % overall, In the biggest port – Antwerp – traffic was down by 2.5 %. In Zeebrugge there
was a notable decline of 28.8 %, but that appears to be a correction following 23.1 % growth in 2013.
As regards liquid bulk, the total increase of 3.5 % is almost entirely attributable to the port of Antwerp
(+5.6 %). The ports of Ghent and Zeebrugge recorded steep falls of 11.9 % and 5.1 % respectively.
0 10 20 30 40 50 60 70 80 90 100 110 120 130 140 150
2009 2010 2011 2012 2013 2014
The overall decline of 1.7 % in bulk cargo was due mainly to the 6.5 % fall in the port of Antwerp. In
Ghent, the main port for dry bulk, there was an increase of 2.3 %. Zeebrugge and Ostend, both
representing shares of around 4 %, respectively recorded 5 % growth and a 3.8 % decline.
TABLE 1 MARITIME TRAFFIC IN THE FLEMISH PORTS IN 2014
(in thousands of tonnes, unless otherwise stated)
Antwerp Ghent Ostend Zeebrugge Total Change from 2013 to 2014
(in p.c.)
Share in 2014 (in p.c.)
Containers ... 108,317 414 0 20,514 129,244 + 4.8 48.1
Change 2013 - 2014 (p.c.) ... + 5.9 - 29.6 n, + 0.5
Roll-on/roll-off13 ... 4,470 2,149 0 13,043 19,662 + 0.7 7.3 Conventional general cargo14 ... 9,885 3,175 65 1,193 14,317 - 4.6 5.3 Liquid bulk ... 62,834 3,412 57 6,562 72,865 + 3.5 27.1
Dry bulk ... 13,506 16,740 1,309 1,236 32,792 - 1.7 12.2 TOTAL 2014 ... 199,012 25,889 1,431 42,548 268,880 + 2.8 100.0
Change 2013 - 2014 (p.c. ) ... + 4.2 - 0.3 - 21.3 - 0.7 + 2.8
TOTAL 2015 (p.m.) ... 208,419 26,362 1,295 38,318 274,394
Change 2014 - 2015 (p.c. ) ... + 4.7 + 1.8 - 9.5 - 9.9 + 2.1
Source: Port authorities and Flemish Port Commission.
1.2
Competitive position of the Belgian ports
To refine the analysis of the competitive position of the Flemish maritime ports, all cargo traffic is
compared with that of the other ports in the Hamburg - Le Havre range
15. The share of the four Flemish
ports in that range increased slightly in 2014 from 22.9 to 23.0 %.
In 2014 the port of
Rotterdam
lost ground to some extent in favour of Antwerp, since the recorded
growth was significantly lower. Owing to that development in Antwerp, the overall market share of the
Flemish ports remained unchanged. Rotterdam declined in dry bulk (-0.7 %) and in liquid bulk (-2.1 %).
Together these two categories account for 65 % of total traffic, so that any decline has a substantial
impact on the overall figure. However, container traffic expanded strongly in 2014: +8.1 %. Conventional
general cargo, in which Rotterdam is traditionally less strong, was up by 28.1 %. This primarily concerns
a correction following the very weak figures for conventional general cargo in 2013. For Rotterdam,
developments in 2015 nevertheless imply a strong revival.
The port of
Amsterdam
which had been expanding over the past few years recorded further growth of
around 1.5 %, just below the average for recent years. There was no resulting increase in its market
share. The growth was achieved in dry bulk (+2.7 %) and liquid bulk (+2.3 %), the core business of the
port of Amsterdam (share of bulk: 96 %). Containers, RoRo and other general cargo declined. In 2014
total traffic came to 79.7 million tonnes.
Zeeland Seaports
regained its 2011 level with strong growth of more than 6 %. Liquid bulk is the main
item, in which traffic was up by 1.7 million tonnes (+12.9 %); that is also the main factor behind the
overall growth of the ports of Flessingue and Terneuzen. Dry bulk, containers and RoRo also recorded
an increase. Conventional general cargo, which is quite important for Zeeland Seaports with a 22 %
share of the traffic portfolio, was down by 2.5 % in 2014. Total traffic came to 35.1 million tonnes in
2014.
After a very strong performance in 2011 and 2012, the port of
Bremen
recorded a decline in traffic in
2013. In 2014 there was a further decrease, albeit small. For the ports of Bremen and Bremerhaven,
13
Abbreviated as RoRo. Horizontal handling of goods using wheeled equipment inside and outside the ship, unlike LoLo (lift on/ lift-off), which entails vertical handling. The RoRo data presented in this report do not take into account containerised cargo, this category of goods being included in the line entitled "containers".
14
The term "general cargo" comprises the following categories: containerised goods, RoRo and conventional general cargo. 15
containers account for three-quarters of traffic. There are regular shifts in the container market and
these have a major impact on total traffic for Bremen.
In
Hamburg
the upward trend peaked in 2014 with very strong growth of +4.8 %, and traffic totalling
145.7 million tonnes. In 2015 this expansion apparently came to a halt, when a very sharp decline was
recorded. In 2014 growth in Hamburg occurred mainly in the sectors where the port is strong: containers
(+6.2 %) and dry bulk (+2.9 %).
In 2014 the port of
Dunkirk
achieved the strongest relative growth in the range (+7.9 %),with traffic
totalling 47,0 million tonnes. That growth is due mainly to the increase in dry bulk (+9.3 %), which
accounts for the major part (50 %) of traffic at the port. The second largest sector, RoRo, also recorded
a big rise (+13 %).
Le Havre
’s position was more or less stable in 2014. A loss of dry bulk was offset by relatively strong
[image:12.595.65.518.292.604.2]growth in container traffic (+4.9 %). Le Havre has yet to regain the level prevailing before the economic
crisis. The total traffic of 67.6 million tonnes in 2014 is still well below the 2008 figure of 80.5 million
tonnes.
TABLE 2 TOTAL MARITIME TRAFFIC IN THE HAMBURG - LE HAVRE RANGE (INCLUDING OSTEND AND ZEELAND SEAPORTS)
(in millions of tonnes,unless otherwise stated16)
Port 2009 2010 2011 2012 2013 2014 2015 (p.m.)
Annual average change from 2009 to 2014
Change from 2013 to 2014
Average share in the range from 2009 to
2014
Share in 2014
(in p.c.) (in p.c.) (in p.c.) (in p.c.)
Antwerp ... 157.8 178.2 187.2 184.1 191.0 199.0 208.4 + 4.7 + 4.2 16.4 17.1 Ghent ... 20.8 27.3 27.2 26.3 26.0 25.9 26.4 + 4.5 - 0.3 2.3 2.2 Ostend ... 5.4 4.9 3.8 3.2 1.8 1.4 1.3 - 23.2 - 21.3 0.3 0.1 Zeebrugge ... 44.9 49.6 47.0 43.5 42.8 42.5 38.3 - 1.1 - 0.7 4.0 3.6
Total Flemish ports ... 228.8 260.0 265.2 257.2 261.6 268.9 274.4 + 3.3 + 2.8 23.0 23.0
Amsterdam17 ... 73.4 72.7 74.9 77.1 78.5 79.7 78.4 + 1.7 + 1.5 6.8 6.8 Bremen ... 63.1 68.9 80.6 84.0 78.8 78.3 73.4 + 4.4 - 0.6 6.8 6.7 Dunkirk ... 45.0 42.7 47.5 47.6 43.6 47.0 46.6 + 0.9 + 7.9 4.1 4.0 Hamburg ... 110.4 120.0 132.2 130.9 139.0 145.7 137.8 + 5.7 + 4.8 11.6 12.5 Le Havre ... 73.8 70.2 67.6 63.5 67.2 67.6 68.9 - 1.7 + 0.6 6.1 5.8 Rotterdam ... 387.0 430.2 434.6 441.5 440.5 444.7 466.4 + 2.8 + 1.0 38.5 38.1 Zeeland Seaports18 ... 28.8 33.0 35.5 34.0 33.0 35.1 0.0 + 4.0 + 6.3 3.0 3.0
Total for the 11 ports ...1,010.3 1,097.6 1,138.0 1,135.8 1,142.1 1,166.9 1,145.9 + 2.9 + 2.2
Total world traffic 7,858.0 8,408.9 8,784.3 9,196.7 9,513.6 9,841.7 + 4.6 + 3.4
Share for the 11 ports
in world traffic (in p.c.) ... 12.9 13.1 13.0 12.4 12.0 11.9
Sources: For the traffic in the range: port authorities; for world traffic (tonnes loaded): Unctad, Review of Maritime Transport 2015.
Duisburg is maintaining its position as Europe’s biggest inland port. With the exception of the port of
Paris all other major inland ports recorded positive growth.
16
In principle, maritime traffic excludes bunkering. However, some ports’ traffic figures do include bunkering, which may lead to minor differences in mutual comparisons.
17
The figures stated here refer to the port of Amsterdam only, and not the entire complex which also includes the ports of Beverwijk, Velsen/IJmuiden and Zaanstad.
18
TABLE 3 CARGO TRAFFIC BY SHIP IN THE PORTS OF DUISBURG, PARIS, LIÈGE AND BRUSSELS
(in thousands of tonnes,unless otherwise stated)
Port 2009 2010 2011 2012 2013 2014 2015
(p.m.)
Annual average change from 2009 to 2014
Change from 2013 to
2014
(in p.c.) (in p.c.)
Duisburg19 ... 34,500 49,200 50,400 38,200 47,200 51,100 n. + 8.2 + 8.3 Paris ... 20,214 20,865 22,338 22,600 21,200 20,100 20,550 - 0.1 - 5.2
Liège20
... 16,287 19,095 19,455 16,477 14,947 15,001 14,605 -1.6 + 0.4 Brussels ... 4,011 4,385 4,855 4,606 4,324 4,439 4,364 + 2.0 + 2.7
Sources: Port of Duisburg,Port of Paris, Liège Port Authority and Brussels Port Authority.
1.3
Direct and indirect value added in the Belgian ports
The direct growth of value added recorded in the Belgian ports (+1.2 %) was almost entirely in line with
GDP growth. The increase is due primarily to growth in the ports of Ghent and Antwerp. Ostend also
recorded expansion.
The noteworthy rise in Ghent was due mainly to strong expansion in the non-maritime cluster. In the port
of Antwerp there were widely varying growth figures, and the increase came mainly from developments
in shipping companies and the chemical sector.
In Zeebrugge, the maritime cluster recorded an increase but that growth was negated by the decline in
the non-maritime cluster, and more particularly by the departure of an industrial firm in the electronics
sector.
In the port of Ostend, growth figures were generally positive with the exception of trade.
In the port of Liège there was an overall decline in both clusters, one factor being developments in the
metalworking industry, a key industrial sector.
Finally, in the port of Brussels, trade was the only sector to record a favourable trend.
As regards indirect value added, the downward trend which had begun in 2010 was reversed. For all
ports together, growth came to 2.2 %, driven mainly by shipping companies, chemicals and the
metalworking industry.
In 2014 direct value added of the Belgian ports accounted for 4.1 % of Belgium’s GDP (and 7.6 %
including indirect value added).
19
The traffic considered here is the total of the cargo handled in all Duisburg Ports, thus, totalling the Duisport Group and the private company ports.
20
TABLE 4 VALUE ADDED IN THE BELGIAN PORTS
(in € million - current prices)
2009 2010 2011 2012 2013 2014 Relative share in
2014
Change from 2013 to 2014
Annual average change from 2009
to 2014 (in p.c.) (in p.c.) (in p.c.)
_______________________ _____________________ ____________________ _____________________ ____________________ _____________________ ________________________ _____________________ ____________________________
1. DIRECT EFFECTS ... 15,061.1 16,680.9 16,459.3 16,382.5 16,340.5 16,532.0 100.0 + 1.2 + 1.9 Antwerp ... 8,794.5 10,006.4 9,710.8 10,020.9 9,782.0 9,923.8 60.0 + 1.4 + 2.4 Ghent ... 3,091.2 3,371.5 3,361.9 3,203.7 3,407.1 3,575.4 21.6 + 4.9 + 3.0 Ostend ... 450.7 494.6 470.5 485.7 485.4 492.4 3.0 + 1.4 + 1.8 Zeebrugge ... 925.8 960.3 976.2 944.7 979.4 935.8 5.7 - 4.5 + 0.2 Liège ... 1,271.1 1,311.0 1,413.9 1,186.1 1,202.2 1,130.9 6.8 - 5.9 - 2.3 Brussels ... 527.8 537.0 526.0 541.4 484.4 473.8 2.9 - 2.2 - 2.1
Outside the ports (p.m)21 ... 80.8 115.8 136.7 132.2 128.0 135.0 - + 5.5 + 10.8
2. INDIRECT EFFECTS ... 12,860.8 15,167.2 14,301.2 14,346.0 13,788.6 14,089.9 - + 2.2 + 1.8
TOTAL VALUE ADDED ... 27,921.9 31,848.1 30,760.4 30,728.5 30,129.1 30,622.0 - + 1.6 + 1.9
Source: NBB (calculations based on the Belgian accounts filed with the Central Balance Sheet Office, and the Belgian IOTs).
The data necessary to estimate the indirect effects are published by the NAI with a low frequency and after a certain time lag. The indirect effects for the period 2009-2014 are based on IOT 2010 and SUT 2010, 2011 and 2012. The calculated indirect effects are approximations and should be interpreted with caution.
CHART 2 CHANGE IN DIRECT VALUE ADDED
(in € million, current prices)
Source: NBB (calculations based on the Belgian accounts filed with the Central Balance Sheet Office).
1.4
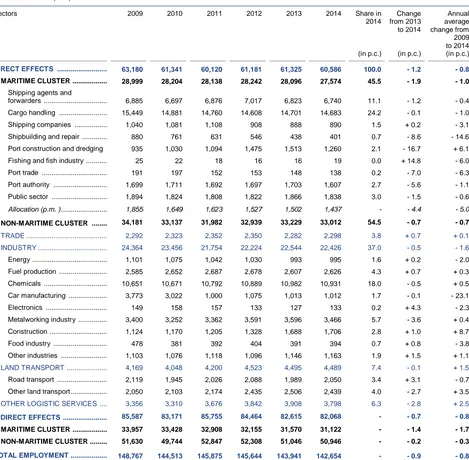
Direct and indirect employment in the Belgian ports
In contrast to value added, direct employment in the Belgian ports declined by -1.5 %, thus continuing
the downward trend of recent years. Only the ports of Ghent and Ostend have managed to improve or
stabilise their level of employment since 2009.
Zeebrugge and Liège recorded the steepest falls. In Zeebrugge – as already mentioned – that was due
to the departure of an industrial firm in the electronics branch. In the maritime cluster, employment
21
The firms in certain maritime branches may be selected from anywhere in the country, since their definition is sufficient in itself to link them to the port activity. These are branches directly connected with the activity of the sea ports. Their results are therefore allocated among the Flemish ports, using the formula for the allocation of value added per branch. For each year and for each branch, this formula is calculated on the basis of the ratio between the direct value added generated in a given Flemish port and the direct value added generated in all the Flemish maritime ports. The line "Outside the ports (p.m.)" included in the tables 4, 5 and 6 collates these data, which are also allocated respectively in the tables showing value added, employment and investment in chapters 2 to 5 on the line entitled "Allocation (p.m.)".
-1.000
-500
0
500
1.000
1.500
2.000
2010
2011
2012
2013
2014
actually increased. In Liège, just as in the case of value added, both clusters saw a predominantly
downward trend, owing to the metalworking industry.
Indirect employment has been declining since 2011. Although that fall can be attributed to developments
within various branches, the decline in indirect employment caused by the metalworking industry merits
a mention.
The share of port jobs in total Belgium employment came to 2.9 % for direct employment and 6.3 % for
total employment in 2014 (3.1 and 6.7 % respectively in 2009).
TABLE 5 EMPLOYMENT IN THE BELGIAN PORTS
(FTE)
2009 2010 2011 2012 2013 2014 Relative share in
2014
Change from 2013 to 2014
Annual average change from 2009
to 2014 (in p.c.) (in p.c.) (in p.c.)
_______________________ ____________________ ______________________ _____________________ ____________________ _____________________ __________________________________________________ ____________________ ___________________________
1. DIRECT EFFECTS ... 120,175 116,165 115,507 117,446 116,486 114,706 100.0 - 1.5 - 0.9 Antwerp ... 63,180 61,341 60,120 61,181 61,325 60,586 52.8 - 1.2 - 0.8 Ghent ... 26,642 25,813 26,550 27,148 27,445 27,602 24.1 + 0.6 + 0.7 Ostend ... 4,902 4,860 4,718 5,098 5,041 4,957 4.3 - 1.7 + 0.2 Zeebrugge ... 10,752 10,250 10,072 9,962 9,726 9,365 8.2 - 3.7 - 2.7 Liège ... 10,366 9,673 9,750 9,555 8,862 8,165 7.1 - 7.9 - 4.7 Brussels ... 4,334 4,227 4,297 4,502 4,087 4,032 3.5 - 1.3 - 1.4
Outside the ports (p.m.)22 .. 2,331 2,240 2,187 2,140 2,091 2,002 - - 4.2 - 3.0
2. INDIRECT EFFECTS ... 142,187 138,460 140,763 140,440 137,310 135,736 - - 1.1 - 0.9
TOTAL EMPLOYMENT ... 262,362 254,625 256,270 257,886 253,797 250,442 - - 1.3 - 0.9
Source: NBB (calculations based on the Belgian accounts filed with the Central Balance Sheet Office, and the Belgian IOTs).
The data necessary to estimate the indirect effects are published by the NAI with a low frequency and after a certain time lag.The indirect effects for the period 2009-2014 are based on IOT 2010 and SUT 2010, 2011 and 2012.The calculated indirect effects are approximations and should be interpreted with caution.
CHART 3 CHANGE IN DIRECT EMPLOYMENT
(FTE)
Source: NBB (calculations based on the Belgian accounts filed with the Central Balance Sheet Office).
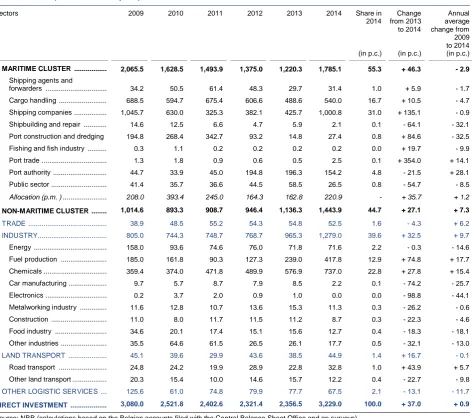
1.5
Investment in the Belgian ports
Investments recorded strong growth of 25.7 % overall. There were wide variations between ports. The
pattern of investment is closely linked to projects and consequently highly volatile, so that the figures
require a nuanced interpretation.
22
These figures stand for the activity of the maritime enterprises located outside the port limits and are divided among the Flemish ports according to the breakdown of value added.
-5.000
-4.000
-3.000
-2.000
-1.000
0
1.000
2.000
3.000
2010
2011
2012
2013
2014
TABLE 6 INVESTMENT IN THE BELGIAN PORTS23
(in € million - current prices)
2009 2010 2011 2012 2013 2014 Relative share in
2014
Change from 2013 to 2014
Annual average change from 2009
to 2014 (in p.c.) (in p.c.) (in p.c.)
____________________________________________ ____________________ _____________________ _____________________ _____________________ _________________________ ________________________ ____________________________
Antwerp ... 3,080.0 2,521.8 2,402.6 2,321.4 2,356.5 3,229.0 76.5 + 37.0 + 0.9 Ghent ... 601.3 501.7 445.8 460.2 421.6 403.6 9.6 - 4.3 - 7.7 Ostend ... 125.7 105.9 90.3 95.5 76.2 118.9 2.8 + 56.1 - 1.1 Zeebrugge ... 194.7 349.6 293.9 254.6 219.7 220.1 5.2 + 0.2 + 2.5 Liège ... 534.6 186.5 203.2 238.1 213.7 195.7 4.6 - 8.4 - 18.2 Brussels ... 66.8 66.7 52.3 51.9 68.4 53.0 1.3 - 22.6 - 4.6
Outside the ports (p.m.)24 ... 247.9 454.5 306.7 213.5 208.4 285.0 - + 36.8 + 2.8
DIRECT INVESTMENT ... 4,603.1 3,732.3 3,488.2 3,421.6 3,356.1 4,220.3 - + 25.7 - 1.7
Source: NBB (calculations based on the Belgian accounts filed with the Central Balance Sheet Office and on surveys).
CHART 4 CHANGE IN DIRECT INVESTMENT
(in € million, current prices)
Source: NBB (calculations based on the Belgian accounts filed with the Central Balance Sheet Office).
1.6
Demography of the Belgian ports
The table entitled 'Demography of the Belgian Ports' gives an overview of changes in the sample
population used for the study for the period 2009-2014. The public sector is not taken into consideration
in this table. As a reminder, besides Belgian commercial enterprises, the study also covers a limited
number of legal entities such as non-profit organizations or branches of foreign firms. The two columns,
entitled '2009' and '2014', with the heading "Population" indicate the number of legal persons (regardless
of the legal form of the entity) included in the study for the years 2009 and 2014 respectively. The
'Migrate-out' column lists firms that left the population during the period 2010 - 2014. Obviously, it is the
other way round for the 'Migrate-in' column. There are several explanations justifying the exclusion from
the survey population from one year to the next: the company has moved, changed activity, merged with
another firm already established in the port (in which case, only the surviving company continues to
feature in the study). The three last columns of the table give the number of firms affected by corporate
restructuring (absorption, merger, takeover or split), by a stoppage or failure. The firms included in the
'Migrate-in' column can either be newly established firms (after 2009) coming into the population studied
or existing companies that have, for instance, started activities or taken over another enterprise in the
23
Investment by the public authority Flemish Region is limited to the projects linked to a specific port. 24
These figures stand for the activity of the maritime enterprises located outside the port limits and are divided among the Flemish ports according to the breakdown of value added.
-1.500
-1.000
-500
0
500
1.000
1.500
2010
2011
2012
2013
2014
port. The 'Missing account' column adds the number of firms that have not filed their annual accounts for
the year 2014 and which, as far as we know, should not be excluded from the study
25.
TABLE 7 DEMOGRAPHY OF THE BELGIAN PORTS FOR THE PERIOD 2009 - 2014
(Number of firms)
Sectors Population26
Death
2009 Migrate-In Migrate-Out Missing account
2014 Restructuring Stoppage Failure
MARITIME CLUSTER ... 1,799 458 523 41 1,693 48 203 140
Shipping agents and forwarders 708 190 205 18 675 22 66 51 Cargo handling ... 375 77 89 5 358 19 37 12 Shipping companies ... 362 133 119 10 366 3 60 39 Shipbuilding and repair ... 160 36 56 7 133 1 18 25
Port construction and dredging 13 2 1 0 14 0 1 0
Fishing and fish industry ... 134 14 37 0 111 3 18 12 Port trade ... 40 5 16 1 28 0 3 1 Port authority ... 7 1 0 0 8 0 0 0 Public sector ... n. n. n. n. n. n. n. n.
NON-MARITIME CLUSTER ... 2,012 1,042 890 36 2,128 116 217 197
TRADE ... 578 233 243 10 558 25 61 63 INDUSTRY ... 591 240 203 8 620 28 51 50
Energy ... 15 14 7 0 22 1 2 1 Fuel production ... 8 2 1 0 9 0 0 1 Chemicals ... 91 24 17 0 98 1 9 3 Car manufacturing ... 25 2 7 0 20 1 2 0 Electronics ... 15 5 5 0 15 0 1 2 Metalworking industry ... 122 35 30 1 126 5 8 9 Construction ... 178 111 88 7 194 9 16 26 Food industry ... 29 4 4 0 29 0 3 0 Other industries ... 108 43 44 0 107 11 10 8
LAND TRANSPORT ... 201 85 79 4 203 8 18 24
Road transport ... 199 80 78 4 197 8 18 24 Other land transport ... 2 5 1 0 6 0 0 0
OTHER LOGISTIC SERVICES.. 642 484 365 14 747 55 87 60
TOTAL ... 3,811 1,500 1,413 77 3,821 164 420 337
Migrate-In = New in population after 2009.
Migrate-Out = Left the population in the period 2010-2014. This category includes the category 'Death', the enterprises which moved their acitivities outside the port area or whose NACE-BEL branch changed.
Death = legal situation at the closing date of this report Restructuring = Absorption + Takeover + Merger +Split
Source: NBB (calculations based on the Crossroads Bank for Enterprises CBE).
Over the period considered, net additions to the total survey population amounted to only a small
number of firms. In relative terms, it was mainly the maritime cluster that saw significant changes. In
particular, two branches - shipping agents and forwarders and shipping companies - experienced both
restructuring and a rise in bankruptcies. In the non-maritime cluster, firms generally come and go more
frequently than in the case of maritime firms. That need not be a bad sign, because newcomers may
create a more efficient and competitive market situation. Branches with a noticeably high rate of change
are other logistic services and construction. On balance, over the period considered those branches did
gain additional firms, but they are also the branches with the biggest percentage of failures.
1.7
Breakdown of the variables by company size
Note that the distribution of the firms according to size depends on the format of the annual accounts
filed by the firms. Thus, companies submitting their annual accounts to the Central Balance Sheet Office
25
See Coppens F., Verduyn F. (2009), Analysis of business demography using markov chains: an application to Belgian data, NBB, W orking Paper No. 170 (Research series), Brussels.
26
in the full format are considered to be large firms. The SME category covers companies submitting their
annual accounts in an abbreviated format.
[image:18.595.64.518.186.347.2]In 2014 there was a 2 % fall in the number of SMEs, thus maintaining the downward trend of recent
years. In contrast to last year, the number of large firms was also down slightly (-0.8 %). However, that
fall had no impact on the creation of value added, which increased by roughly 0.5 % in large firms and
by over 1.8 % in SMEs. Nevertheless, employment declined in both groups, but mainly in large firms
where it contracted by -1.8 %.
TABLE 8 BREAKDOWN OF FINDINGS IN THE BELGIAN PORTS IN 2014
Ports Number of firms27
Direct value added Direct employment Direct investment (in € million) (FTE)
____
(in € million)
Large firms SMEs Large firms SMEs Large firms SMEs Large firms SMEs
Antwerp ... 836 1,001 9,311.5 365.5 53,788 3,524 2,926.7 54.9
Ghent ... 279 321 3,354.0 190.0 25,051 2,235 356.1 33.2
Ostend ... 58 135 390.6 40.1 3,628 493 85.4 16.8
Zeebrugge ... 158 229 716.4 91.5 6,401 1,031 146.2 11.9
Liège ... 91 87 1,097.6 33.3 7,656 509 190.8 4.9
Brussels ... 116 238 409.6 64.0 3,176 853 38.3 14.7
Outside the ports ... 26 360 73.7 61.3 1,571 432 256.2 28.8
TOTAL ... 1,564 2,371 15,353.5 845.8 101,271 9,076 3,999.7 165.2
Source: NBB (calculations based on the Belgian accounts filed with the Central Balance Sheet Office and on surveys).
1.8
Social balance sheet in the Belgian ports
28The social balance sheet presents a coherent set of data on various aspects of employment in firms:
composition of the workforce, staff rotation, type of employment contracts, level of education, working
time, labour costs and training efforts. The results presented below concerning direct employment in the
six Belgian ports are not exhaustive. The figures are based on a constant sample
29relating to the period
2012 - 2014. The national data is calculated from a constant sample of filed annual accounts with the
Central Balance Sheet Office. The findings per individual port are also based on a constant sample.
1.8.1 Working time and labour costs
For a detailed analysis of the social balance sheet data, see the article by P. Heuse in the June 2016
Economic Review of the National Bank of Belgium.
In 2013 the reduction in employment in the constant sample of firms active in the Belgian ports was still
relatively modest (-0.2 %). In contrast, in 2014 the decline was considerably bigger (-3.9 %) and
exceeded the findings based on the general results in table 5. The number of hours worked fell faster
than the number of FTEs in 2014, so that the average number of hours worked per FTE declined further.
27
For each port, this is the number of firms located in the port zone. A firm may in fact be recorded in more than one port. The sample for the year 2014 comprises 1.457 large firms and 2.364 small and medium-sized firms, totalling 3.821 firms. The results of the public sector are not included in this table.
28
The national data mentioned were taken from Heuse P., 2014 social balance sheet, NBB, Economic Review, June 2016. The comparisons are merely an indication, since only firms filing their social balance sheet for a period of 12 months ending on 31 December were taken into account in that study. Moreover, NACE-BEL 78 branches (employment-related activities), 84 (public administration and defence; compulsory social security) and 85 (education) are excluded in that study.
29
TABLE 9 HOURS WORKED AND ASSOCIATED COSTS OF INTERNAL HUMAN RESOURCES
(reduced population: constant population)
(percentage change compared with the previous year, unless otherwise stated)
2012 2013 2014
Change in the average number of employees on the staff register (p.c.) ... -0.2 -3.9
Change in the number of hours actually worked (p.c.) ... -0.5 -4.2
Change in staff costs (p.c.) ... +2.0 -1.0
Average number of hours worked per annum per full-time equivalent (hours) ... 1,513 1,508 1,504
Average annual staff costs per full-time equivalent (euros) ... 76,545 78,251 80,621
Average staff costs per hour worked (euros) ... 51 52 54
Source: NBB (full presentation accounts only).
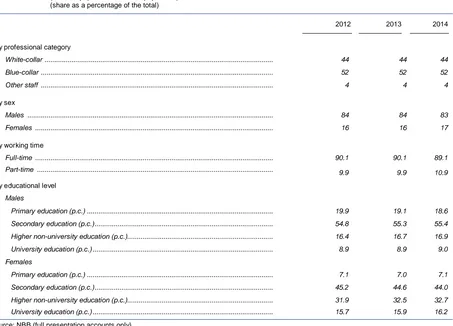
1.8.2 Composition of the workforce
The changes recorded for 2014 in table 10 are relatively minor. The proportion of blue collar workers
has remained virtually unchanged for a number of years, as has the proportion of employees with higher
education qualifications.
In contrast to previous years, female employment increased by 1 percentage point in 2014. The article
by P. Heuse mentioned above discusses female employment in more detail.
TABLE 10 INTERNAL WORKFORCE AT THE END OF THE FINANCIAL YEAR
(reduced population: constant population) (share as a percentage of the total)
2012 2013 2014
By professional category
White-collar ... 44 44 44
Blue-collar ... 52 52 52
Other staff ... 4 4 4
By sex
Males ... 84 84 83
Females ... 16 16 17
By working time
Full-time ... 90.1 90.1 89.1
Part-time ... 9.9 9.9 10.9
By educational level
Males
Primary education (p.c.) ... 19.9 19.1 18.6
Secondary education (p.c.)... 54.8 55.3 55.4
Higher non-university education (p.c.)... 16.4 16.7 16.9
University education (p.c.) ... 8.9 8.9 9.0
Females
Primary education (p.c.) ... 7.1 7.0 7.1
Secondary education (p.c.)... 45.2 44.6 44.0
Higher non-university education (p.c.)... 31.9 32.5 32.7
University education (p.c.) ... 15.7 15.9 16.2
Source: NBB (full presentation accounts only).
1.8.3 External staff
The general tendency to employ more temporary workers is also apparent in firms in the ports. Some
years ago this form of work occurred mainly in a number of specific sectors, but has now become more
widespread. Demand for more flexible labour to cater for cyclical fluctuations is part of the reason. Since
the increase in the number of hours worked exceeded the change in labour costs, there was a reduction
in the average hourly cost of external staff.
TABLE 11 HIRED TEMPORARY STAFF AND STAFF PLACED AT THE ENTERPRISE’S DISPOSAL
(reduced population: constant population)
(percentage change compared with the previous year, unless otherwise stated)
2012 2013 2014
Share of external staff in total employment (on the basis of the number of hours actually worked)
(share as a percentage of the total) ... 13.9 14.0 15.8
Change in the number of hours actually worked ... - 0.1 + 9.4 Change in costs ... + 1.8 + 8.2
Source: NBB (full presentation accounts only).
1.8.4 Staff turnover
In the constant sample, staff turnover was again decidedly negative. It is noteworthy that the number of
workers in the ‘unemployment with company allowance’ category more than doubled. It could be that
both employers and employees still want to make use of the bridging pension system which will be
subject to severe government restrictions from now on.
TABLE 12 STAFF TURNOVER
(reduced population: constant population)
(share as a percentage of the total, unless otherwise stated)
2012 2013 2014
Net number of staff hired during the year (FTE) ... + 1,502 + 314 - 1,479
Staff leaving, by reason for termination of contract
Retirement ... 6.9 8.6 7.4
Unemployment with company allowance ... 4.3 4.3 9.0
Dismissal ... 18.0 18.5 16.5
Other reason30
... 70.6 68.6 67.0
Source: NBB (full presentation accounts only).
1.8.5 Training
31Almost two-thirds of the constant sample reported training initiatives in the social balance sheet
(63.0 %); however, in 2014 that figure was down slightly against the previous year. The participation rate
increased for both men and women, but the number of hours’ training attended was down, so that the
firms’ training costs were nevertheless lower than in the previous year.
30
Spontaneous departures, death in service, expiry of the period of fixed-term contracts, provided that they are not immediately followed by a new contract, and the completion of the work for which the contract was concluded.
31
TABLE 13 EFFORTS DEVOTED TO FORMAL TRAINING
(reduced population: constant population)
(share as a percentage of the total, unless otherwise stated)
2012 2013 2014
P.c. of firms reporting training on the social balance sheet ... 62.6 63.4 62.3
Participation rate ... 56.8 57.2 58.4
Males ... 57.4 58.3 59.2
Females ... 54.2 52.2 54.6
Number of hours’ training per person (hours) ... 32.5 33.2 29.0
Males (hours) ... 33.5 34.0 29.7
Females (hours) ... 27.3 29.1 25.6
Training costs per hour (euros) ... 73.2 70.7 71.9
Males (euros) ... 72.6 69.6 71.8
Females (euros) ... 76.8 77.4 72.2
P.c. of the number of hours worked devoted to training ... 1.3 1.3 1.1
Training costs as a percentage of total staff costs... 1.8 1.8 1.5
Source: NBB (full presentation accounts only).
1.9
Financial ratios in the Belgian ports
The ratios presented below show the net return on equity after tax, liquidity in the broad sense (the
current ratio), and solvency (see Annex 2 for the definition of the ratios). The first ratio concerns the
firms’ ability to generate profits, and to give shareholders an idea of the firm’s return after tax. The
second ratio shows the firm’s ability to mobilise in due time the cash resources that it needs in order to
meet its short-term liabilities. Finally, the third ratio gives an idea of the firm’s ability to honour all its
financial commitments in the short and long term. This section gives information on the movement in the
ratios for the six Belgian ports together
32.
The study of the financial ratios is based on a constant sample
33composed for the years 2012 to 2014.
Consequently, the firms studied in the financial section of this report are not the same as those in the
constant sample of the previous report, which may explain some discrepancies between the figures in
the two publications. To permit comparison with the national data, i.e. all Belgian non-financial firms
companies, the same calculation method – namely globalisation – was used.
In 2014, firms included in the constant sample saw a further rise in their profitability, which reached a
level exceeding the average for all non-financial corporations. However, that favourable trend did not
occur in every port and was in fact due to the substantial improvement in Antwerp and Liège. Liquidity
and solvency deteriorated slightly and were below the national averages, although they remain at an
acceptable level.
32
Note that readers wishing to compare the financial ratios of a firm with those in the sector where it operates can find that information in the company file published by the Central Balance Sheet Office.
33
TABLE 14 FINANCIAL RATIOS IN THE BELGIAN PORTS FROM 2012 TO 2014
(reduced population: constant population)
Ports
__________________________________
Return on equity after tax (in p.c.)
__________________________
Liquidity in the broad sense
__________________________
Solvency (in p.c.)
__________________________ 2012 2013 2014 2012 2013 2014 2012 2013 2014
Antwerp ... 10.1 3.6 7.5 1.19 1.19 0.97 44.1 44.4 42.6 Ghent ... 4.1 5.1 5.8 1.24 1.34 1.27 39.2 42.5 40.3 Ostend ... 15.8 8.8 1.7 0.91 1.00 0.95 48.0 51.2 46.0 Zeebrugge ... 4.9 6.7 5.2 1.15 1.06 1.08 51.5 50.8 52.4 Liège ... -1.5 -2.6 5.1 0.90 0.82 0.70 40.7 42.0 42.6 Brussels ... 6.3 2.9 3.0 1.41 1.41 1.40 39.6 39.2 38.1
Belgian ports ... 8.1 3.2 6.8 1.16 1.17 1.00 43.4 44.1 42.7
Non-financial corporations34
... 6.8 5.3 5.5 1.26 1.25 1.24 43.1 43.1 43.4
Source: NBB (calculations based on the Belgian accounts filed with the Central Balance Sheet Office).
1.10 Financial health in the Belgian ports
The financial health indicator is designed as a weighted combination of variables, created by means of a
model constructed in the same way as a failure prediction model. The model takes the form of a logistic
regression discriminating between failing and non-failing companies. The definition of failure is based on
a legal criterion, namely that a company is considered to have failed if it has faced bankruptcy or judicial
administration in the past.
The indicator summarises each company’s situation in a single value which takes account
simultaneously of the solvency, liquidity and profitability dimensions. Those dimensions are
complementary in the establishment of a financial diagnosis, as a high debt level, for example, may be
offset by a plentiful cash flow, and vice versa. The indicator also takes account of the companies’ age
and size, particularly through interaction variables.
The indicator constitutes a strictly financial assessment of the companies at a given moment. That
assessment is based on data from the annual accounts, and therefore disregards any other fundamental
elements, such as development prospects, competition, management calibre or shareholders’
willingness to provide financial support. In that respect, it must be regarded as one of the factors
enabling an overall appraisal of a firm’s situation.
Classes 1, 2, 3 and 4 are associated with below-average failure rates, and therefore correspond to a
favourable financial situation. However, the rates are not zero, which means that these classes are not
totally risk free. Conversely, classes 6, 7, 8, 9 and 10 are associated with above-average failure rates,
and therefore correspond to a situation of vulnerability. That is why belonging to one of these classes
can be interpreted as a warning sign, which becomes stronger as we move from class 6 to class 10.
Finally, class 5 corresponds to an average failure rate and is therefore neutral in terms of interpretation.
The financial health classes are used in the enterprise files compiled by the Central Balance Sheet
Office
35.
The sample of firms for which the financial health index was calculated is naturally much
smaller than in the national study. Consequently, the results are more volatile. The result for a particular
firm can therefore be obtained from the company file
36and compared to the distribution of firms by
financial health class in the ports, or in Belgium as a whole.
Tables 15 and 16 show that, in 2014, a substantial majority of firms in the Belgian ports (66.5 % of the
number of firms and 81.3 % in terms of jobs) were in classes 1 to 4, i.e. with a below-average failure
34
For additional information see Rubbrecht I., Vivet D., Results and financial situation of firms in 2014, NBB, Economic review, December 2015, Brussels.
35
See Vivet D. (2011), Development of a financial health indicator based on companies’ annual accounts, NBB, W orking Paper No. 213 (Document series), Brussels.
36
risk. It is notable that the distribution according to the number of firms has changed very little since 2008.
That is not the case for the distribution according to firm size (number of employees): in the crisis year
2009, the overall share of classes 1 to 3 declined significantly, but in the ensuing years the situation was
largely restored.
TABLE 15 FINANCIAL HEALTH IN THE BELGIAN PORTS - IN % OF THE NUMBER OF COMPANIES
(reduced population)
2009 2010 2011 2012 2013 2014
_____________________ ______________________ _____________________ _____________________ _____________________ _____________________
Class 1 ... 8.3 8.2 7.9 8.4 8.4 8.6
Class 2 ... 18.1 18.4 19.3 18.6 19.1 19.3
Class 3 ... 17.7 18.5 18.7 18.5 19.2 18.4
Class 4 ... 18.7 19.1 20.2 19.2 19.4 20.2
Class 5 ... 17.9 18.1 17.5 18.3 17.6 17.6
Class 6 ... 13.1 11.8 11.4 12.0 10.7 11.1
Class 7 ... 3.6 3.3 2.6 2.8 3.4 2.8
Class 8 ... 1.5 1.9 1.7 1.6 1.5 1.5
Class 9 ... 0.7 0.4 0.5 0.4 0.5 0.4
Class 10 ... 0.4 0.2 0.3 0.2 0.3 0.1
TOTAL ... 100.0 100.0 100.0 100.0 100.0 100.0
Source: NBB (calculations based on the Belgian accounts filed with the Central Balance Sheet Office).
TABLE 16 FINANCIAL HEALTH IN THE BELGIAN PORTS - IN % OF WORKERS ENTERED IN THE STAFF REGISTER37
(reduced population)
2009 2010 2011 2012 2013 2014
_____________________ ______________________ _____________________ _____________________ _____________________ _____________________
Class 1 ... 6.7 10.0 8.7 7.7 8.0 7.8
Class 2 ... 23.5 23.0 18.7 15.2 22.4 20.9
Class 3 ... 29.4 33.3 35.2 39.2 33.0 35.1
Class 4 ... 24.9 20.9 18.6 16.6 16.7 17.5
Class 5 ... 11.0 8.7 15.5 16.9 16.5 15.8
Class 6 ... 3.4 3.3 2.6 3.7 2.6 2.0
Class 7 ... 0.6 0.5 0.4 0.4 0.5 0.5
Class 8 ... 0.3 0.3 0.2 0.3 0.3 0.2
Class 9 ... 0.0 0.0 0.1 0.0 0.1 0.1
Class 10 ... 0.1 0.0 0.0 0.0 0.0 0.0
TOTAL ... 100.0 100.0 100.0 100.0 100.0 100.0
Source: NBB (calculations based on the Belgian accounts filed with the Central Balance Sheet Office).