1
ESTIMATION OF METFORMIN HYDROCHLORIDE AND
VOGLIBOSE IN TABLET DOSAGE FORM BY RP-HPLC
METHOD
A dissertation submitted toTHE TAMILNADU Dr.M.G.R MEDICAL UNIVERSITY CHENNAI- 600 032
In partial fulfillment of the requirements for the award of degree of
MASTER OF PHARMACY
IN
PHARMACEUTICAL ANALYSIS
SUBMITTED
BY
Reg. No. 261330954
Under the guidance of
Prof.Dr.D.Babu Ananth, M.Pharm., Ph.D.,
DEPARTMENT OF PHARMACEUTICAL ANALYSIS
EDAYATHANGUDY.G.S PILLAY COLLEGE OF PHARMACY
NAGAPATTINAM-611002
2
Prof.Dr.D.Babu Ananth,
M.Pharm., Ph.D.,Principal,
Edayathangudy.G.S. Pillay College of Pharmacy,
Nagapattinam – 611 002.
CERTIFICATE
This is to certify that the dissertation entitled
“
ESTIMATION OF
METFORMIN
HYDROCHLORIDE
AND
VOGLIBOSE
IN
TABLET DOSAGE FORM BY RP-HPLC METHOD
”
submitted by
M.S.HARIKRISHNAN (Reg No: 261330954) in partial fulfillment for
the award of degree of Master of Pharmacy to the
Tamilnadu Dr.
M.G.R Medical University, Chennai is an independent bonafide work
of the candidate carried out under my guidance in,
Department of
Pharmaceutical Analysis, Edayathangudy.G.S Pillay College of
Pharmacy during the academic year 2015-2016.
Place: Nagapattinam Prof.Dr.D.Babu Ananth, M.Pharm., Ph.D.,
3
ACKNOWLEDGEMENT
I would like to express profound gratitude to Mrs.
Jothimani.G.S.Pillay, Chairman, E.G.S.Pillay College of Pharmacy, and
Thiru. S.Paramesvaran, M.Com, FCCA, Secretary, E.G.S.Pillay College of
Pharmacy.
I express my sincere and deep sense of gratitude to my guide
Prof.Dr.D.Babu Ananth, M.Pharm., Ph.D., Principal, E.G.S.Pillay College
of Pharmacy, for his guidance, invaluable and extreme support,
encouragement, and co-operation throughout the course of my work.
I wish to express my great thanks to Prof.Dr.M.Murugan,
M.Pharm.,PhD, Director cum Professor,Head,Department of Pharmaceutics,
E.G.S.Pillay College of Pharmacy, for his support during my project work.
I wish to express my great thanks to Prof.K.Shahul Hameed
Maraicar, M.Pharm., (PhD), Director cum Professor , Department of
Pharmaceutics, E.G.S.Pillay College of Pharmacy, for his support during my
project work.
I would like to extend my thanks to all the Teaching Staff and Non
Teaching Staff, who are all, supported me for the successful completion of my
4
INDEX
S.NO CONTENTS
1 INTRODUCTION
2 LITERATURE REVIEW
3 AIM & OBJECTIVE
4 PLAN OF WORK
5 DRUG PROFILE
6 MATERIALS & METHODS
7 RESULTS & DISCUSSION
8 SUMMARY
9 CONCLUSION
5
INTRODUCTION
Analytical chemistry is a branch of chemistry that Ideals with the
separation, identification and determination of components in a sample. It is the
science of making quantitative measurements, which requires background
knowledge of chemical and physical concepts. Analytical chemistry may be
defined as the “Science and art of determining the composition of materials in
terms of the elements or compounds contained”.
Pharmaceutical analysis plays a major role today, and it can be considered as
an interdisciplinary subject. Pharmaceutical analysis derives its principles from
various branches of science like Chemistry, Physics, Microbiology, Nuclear
Science, Electronics, etc. Analytical method is a specific application of a
technique to solve an analytical problem. Analytical instrumentation plays an
important role in the production and evaluation of new products and in the
protection of consumers and the environment. This instrumentation provides
the lower detection limits required to assure safe foods, drugs, water and air
Pharmaceutical analysis techniques are applied mainly in two areas
Traditionally, analytical chemistry has been split into two main types,
qualitative and quantitative:
1. Qualitative
Qualitative analysis is to establish the presence of a given element or
compound in a sample.
2. Quantitative
Quantitative analysis is to establish the amount of a given element or
compound in a sample.
6 A) Spectrometric techniques
o Ultraviolet and visible Spectrophotometry
o Fluorescence and phosphorescence Spectrophotometry
o Atomic Spectrometry (emission and absorption)
o Infrared Spectrophotometry
o Raman Spectroscopy
o X-Ray Spectroscopy
o Radiochemical Techniques including activation analysis
o Nuclear Magnetic Resonance Spectroscopy
o Electron Spin Resonance Spectroscopy
B) Electrochemical Techniques o Potentiometry
o Voltametry
o Voltametric Techniques
o Amperometric Techniques
o Colorimetry
o Electrogravimetry
o Conductance Techniques
C) Chromatographic Techniques
o Gas Chromatography
o High performance Liquid Chromatography
o Thin Layer Chromatography
7 o Mass Spectrometry
o Kinetic Techniques
E) Hyphenated Techniques
o GC-MS (Gas Chromatography – Mass Spectrometry)
o ICP-MS (Inductivity Coupled Plasma Mass Spectrometry)
o GC-IR (Gas Chromatography – Infrared Spectroscopy)
o MS-MS (Mass Spectrometry – Mass Spectrometry)
ANALYTICAL METHOD DEVELOPMENT
Methods are developed for new products when no official methods are
available. Alternate methods for existing (non-Pharmacopoeial) products are
developed to reduce the cost and time for better precision and ruggedness. Trial
runs are conducted, method is optimized and validated. When alternate method
proposed is intended to replace the existing procedure comparative laboratory
data including merit / demerits are made available
Steps of method development:
Documentation starts at the very beginning of the development process, a
system for full documentation of the development studies must be established.
All data relating to these studies must be recorded in laboratory notebook or an
electronic database.
1. Analyte standard characterization
All known information about the analyte and its structure is collected i.e.,
physical and chemical properties.
The standard analyte (≈100% purity) is obtained. Necessary arrangement is
made for the proper storage (refrigerator, desicators, freezer). When multiple
components are to be analyzed in the sample matrix, the number of
8
each one is determined. Only those methods (spectroscopic, MS, GC, HPLC
etc.,) that are compatible with sample stability are considered.
2. Method requirements
The goals or requirements of the analytical method that need to be developed
are considered and the analytical figures of merit are defined. The required
detection limits, selectivity, linearity, range, accuracy and precision are
defined.
3. Literature search and prior methodology
The literature for all types of information related to the analyte is surveyed. For
synthesis, physical and chemical properties, solubility and relevant analytical
methods.Books, periodicals, chemical manufacturers and regulatory agency
compendia such as USP / NF, AOAC and ASTM publications are reviewed.
Chemical Abstracts Service (CAS) automated computerized literature searches
are convenient.
4. Choosing a method
Using the information in the literatures and prints, methodology is adapted.
The methods are modified wherever necessary. Sometimes it is necessary to
acquire additional instrumentation to reproduce, modify, improve or validate
existing methods for in-house analytes and samples.
If there are no prior methods for the analyte in the literature, from analogy, the
compounds that are similar in structure and chemical properties are
investigated and are worked out. There is usually one compound for which
9 5. Instrumental setup and initial studies
The required instrumentation is setup. Installation, operational and
performance qualification of instrumentation using laboratory standard
operating procedures (SOP’s) are verified.
Always new consumables (e.g. solvents, filters and gases) are used, for
example, method development is never started, on a HPLC column that has
been used earlier.
The analyte standard in a suitable injection / introduction solution and in
known concentrations and solvents are prepared. It is important to start with an
authentic, known standard rather than with a complex sample matrix. If the
sample is extremely close to the standard (e.g., bulk drug), then it is possible to
start work with the actual sample.
6. Optimization
During optimization one parameter is changed at a time, and set of conditions
are isolated, rather than using a trial and error approach. Work has been done
from an organized methodical plan, and every step is documented (in a lab
notebook) in case of dead ends.
7. Documentation of analytical figures of merit
The originally determined analytical figures of merit limit of quantificatation
(LOQ), Limit of detection (LOD), linearity, time per analysis, cost, sample
preparation etc., are documented.
8. Evaluation of method development with actual samples
The sample solution should lead to unequivocal, absolute identification of the
10
9. Determination of percent recovery of actual sample and demonstration of quantitative sample analysis
Percent recovery of spiked, authentic standard analyte into a sample matrix that
is shown to contain no analyte is determined. Reproducibility of recovery
(average +/- standard deviation) from sample to sample and whether recovery
has been optimized has been shown. It is not necessary to obtain 100%
recovery as long as the results are reproducible and known with a high degree
of certainty.
The validity of analytical method can be verified only by laboratory studies.
Therefore documentation of the successful completion of such study is a basic
requirement for determining whether a method is suitable for its intended
11
INTRODUCTION TO VALIDATION
Validation
Validation of an analytical method is the process by which it is established, by
laboratory studies, that the performance characteristics of the method meet the
requirements for the intended analytical applications
Validation is defined as follows by different agencies
Food and Drug administration (FDA)
Establishing documentation evidence, which provides a high degree of
assurance that specific process, will consistently produce a product meeting its
predetermined specification and quality attributes.
World Health Organization (WHO)
Action of providing that any procedure, process, equipment, material, activity,
or system actually leads to the expected results
European Committee (EC)
Action of providing in accordance to the principles of good manufacturing
practice that any procedure, process, equipment, material, activity or system
actually leads to the expected results. In brief validation is a key process for
effective Quality Assurance.
Reasons for Validation
There are two important reasons for validating assays in the pharmaceutical
12
integral part of the quality-control system. The second is that current good
manufacturing practice regulation requires assay validation.
Steps followed for validation procedures
o Proposed protocols or parameters for validations are established.
o Experimental studies are conducted.
o Analytical results are evaluated.
o Statistical evaluation is carried out.
o Report is prepared documenting all the results.
Objective and Parameters of Analytical Method Validation
The purpose of validation of an analytical procedure is to demonstrate that it is
suitable for its intended purpose. According to ICH guidelines, typical
analytical performance characteristics that should be considered in the
validation of the types of methods are
1. Accuracy
2. Precision
3. Specificity
4. Detection Limit
5. Quantification Limit
6. Linearity
7. Range
8. Ruggedness
9. Robustness
1. Accuracy
The accuracy is the closeness of the measured value to the true value for the
13
using a minimum of nine determinations over a minimum of three
concentrations levels the specified range ( i.e, three concentrations and three
replicates of each concentration)
Accuracy was tested (% Recovery and % RSD of individual measurements) by
analyzing samples at least in triplicate, at each level (80,100 and 120 % of label
claim) is recommended. For each determination fresh samples were prepared
and assay value is calculated. Recovery was calculated from regression
equation obtained in linearity study. Accuracy was determined from the mean
relative error for a set of replicate analysis (i.e. the difference between
measured and nominal concentration) for spiked samples.
2. Precision
The precision of an analytical procedure expresses the closeness of agreement
between the series of measurements obtained from multiple sampling of the
same homogenous sample under the prescribed conditions. Precision of an
analytical method is usually expressed as the standard deviation, relative
standard deviation or coefficient of variations of a series of measurements. The
ICH documents recommend the repeatability should be assessed using a
minimum of nine determinations covering specified range of procedure.
Precision may be the measure of either the degree of reproducibility or
repeatability of the analytical method under normal operating conditions.
Repeatability:
Repeatability expresses the precision under the same operating condition over a
short interval of time. Repeatability is also termed intra – day assay precision.
Intermediate Precision: Intermediate precision expresses with in laboratories
14
Reproducibility:
When the procedure is carried out by different analyst in different laboratories
using different equipment, regents and laboratories setting. Reproducibility was
determined by measuring repeatability and the intermediate precision.
Reproducibility is assayed by means of an inter-laboratory trial.
3. Specificity
An investigation of specificity should be conducted during the validation of
identification tests, the determination of impurities.
An ICH document defines specificity as the ability to assess unequivocally the
analyte in the presence compounds that may be expected to products and
matrix components.
The definition has the following implications:
Identification test: Suitable identification tests should be able to discriminate
compounds of closely related structure which are likely to be present .Ensure
identity of an analyte .The analyte should have no interference from other
extraneous components and be well resolved from them.
Purity Test: To ensure that all the analytical procedures performed allow an
accurate statement of the content of impurity of the content of impurity of an
analyte i.e. related substances test, heavy metals, residual solvents etc.
Assay: To provide an exact result, this allows an accurate statement on the
content or potency of the analyte in a sample.
Detection Limit
It is the lowest amount of analyte in a sample that can be detected, but not
necessarily quantities as an exact value, under the stated experimental
conditions. The detection limit is usually expressed as the concentration of
15
4.Determination of detection limit
For instrumental and non- instrumental methods detection limit is generally
determined by the analysis of samples with known concentration of analyte and
by establishing the minimum level at which the analyte can be reliably
detected.
LOD = 3 * SD / slope of calibration curve
SD = Standard deviation of intercepts
4.Quantification Limit (QL)
It is the lowest amount of analyte in a sample that can be determined with
acceptable precision and accuracy under the stated experimental conditions.
Quantification limit is expressed as the concentration of analyte (e.g- % ppm)
in the sample.
Determination of quantification limit
For instrumental and non- instrumental methods, the quantitation limit is
generally determined by the analysis of samples with known concentration of
analyte and by establishing the minimum level at which the analyte can be
determined with acceptable accuracy and precision.
LOQ = 10 * SD / slope of calibration curve
16
Based on Standard Deviation of the blank
Measurement of the magnitude of the analytical background response is
performed by analyzing an appropriate number of blank samples and
calculating the standard deviation of these responses.
Based on the calibration curve
A specific calibration curve should be studied using the samples, containing an
analyte in the range of QL. The residuals SD of regression line or the S.D of
intercepts of regression lines may be used as the S.D. The quantitative limit is a
parameter of quantitative assay for low levels of compounds in sample
matrices, and is use particularly for the determination of impurities or
degradation products.
6. Linearity and Range
The linearity of an analytical procedure is its ability to obtain test results that
are directly proportional to concentration of analyte in samples. The range of
an analytical is the intervals between the upper and lower concentration
(amounts) of analyte in the sample for which it has been demonstrated which it
has been demonstrated that the analytical procedure has a suitable level of
precision accuracy and linearity.
Determination of linearity and range
The linearity and range determined by application of the procedure to a series
of Samples having analyte concentration spanning the claimed range of
procedure. When the relationship between response and concentration is not
linear, standardization may be providing by means of a calibration curve. The
ICH recommends that for the establishment of linearity a minimum of five
17
7. Ruggedness
Degree of reproducibility (Ruggedness) of test results obtained by the analysis
of the same samples under a variety of condition such as different laboratories,
different analysts, different instruments etc, normally expressed as the lack of
influence on test results of operational and environmental variable of the
analytical method.
Ruggedness is a measurement of reproducibility of test results under the
variation in condition normally expected from laboratory to laboratory and
from analyst to analyst. Degree of representative of test results is then
determined as a function of the assay variable.
By analysis of aliquots from homogenous lots in different laboratories, by
different analyst, using operational and environmental conditions that may
differs but are still with in the specified parameter of the assay variable.
8. Robustness
Robustness of an analytical method is measure of its capacity to remain
unaffected small but deliberate variations in method parameters and provides
an indication of its reliability during normal usage.
Testing varying some or all condition:
-Column temperature
-PH of buffer in mobile phase
-Reagents and flow rate
18
8. System Suitability
System suitability tests are based on the concept that the equipment,
electronics, analytical operations and samples constitute an integral system that
can be evaluated as a whole.
According to USP system suitability are an integral part of chromatographic
methods. These tests verify that the resolution and reproducibility of the
system are adequate for the analysis to be performed. One consequence of the
evaluation of robustness and ruggedness should be that a series of system
suitability parameters is established to ensure that the validity of the analytical
method is maintained whenever used.
The parameters that are affected by the changes in chromatographic conditions
are,
o Capacity factor (k’),
o Peak asymmetry / tailing factor (As)
o Column efficiency (N) and Selectivity ()
o Capacity factor (k')
k' = (t R- t0) / t 0
The capacity factor is a measure of the degree of retention of an analyte relative
to an unretained peak, where tR is the retention time for the sample peak and to
is the retention time for an unretained peak.
Recommendations
The peak should be well-resolved from the other peaks and the void volume.
Generally the value of k' is > 2.
Tailing factor (T)
A measure of the symmetry of a peak, given by the following equation where
19
apex point at 5% height. Ideally, peaks should be Gaussian in shape or totally
symmetrical.
T = W0.05 / 2f
The accuracy of quantitation decreases with increase in peak tailing because of
the difficulties encountered by the integrator in determining where/when the
peak ends and hence the calculation of the area under the peak. Integrator
variables are preset by the analyst for optimum calculation of the area for the
peak of interest.
Recommendations
T of </= 2
Theoretical plate number / Efficiency (N)
A measure of peak band spreading determined by various methods, some of
which are sensitive to peak asymmetry. The most common are shown here,
with the ones most sensitive to peak shape shown first:
4-sigma / tangential
N = 16 (tR / W) 2 = L / H
Half height
N = 5.54 (tR / W) 2 = L / H
Theoretical plate number is a measure of column efficiency,
Theoretical plate number is a measure of column efficiency, that is, how many
peaks can be located per unit run-time of the chromatogram, where tR is the
retention time for the sample peak and W is the peak width.
N is moderately constant for each peak on a chromatogram with a fixed set of
20
measures the column efficiency per unit length (L) of the column. Parameters
which can affect N or H include
Peak position, particle size in column, flow-rate of mobile phase, column
temperature, viscosity of mobile phase, and molecular weight of the analyte
Recommendations
The theoretical plate number depends on elution time but in general should be
> 2000.
Resolution (Rs)
Ability of a column to separate chromatographic peaks, Resolution can be
improved by increasing column length, decreasing particle size, increasing
temperature, changing the eluent or stationary phase. It can also be expressed in
terms of the separation of the apex of two peaks divided by the tangential width
average of the peaks.
Rs= ΔtR / W1/2+ W2/2;
Where ΔtR = t2 – t1
For reliable quantitation, of well-separated peaks are essential for quantitation.
Recommendations
Rs of > 2 between the two peaks of interest and the closest potential interfering
peak (impurity, excipient, degradation product, internal standard, etc.) are
desirable.
Statistical Analysis
21
The consistency and suitability of the developed method are substantiated
through the statistical analysis like standard deviation, relative standard
deviation and theoretical plates per meter.
For Accuracy: Standard deviation = =
1 ) x x
( i 2
n
Where, x = sample, xi = mean value of samples, n = number of samples
Relative Standard Deviation = /xi × 100
Molar extinction coefficient (mol-1 cm-1) = A/C × L
Where, A= Absorbance of drug, C= concentration of drug, L= Path length
Sandell, s sensitivity (µg/cm2/0.001 absorbance units) = C/A×0.001
Where, C= concentration of drug, A= Absorbance of drug
Selection of Internal Standard
A compound added to a sample in known concentration to facilitate the
qualitative identification and/or quantitative determination of the sample
components. Internal standards (IS) - substance used as reference in
quantitative analysis; the internal standard is first mixed with standard
solutions; later it is added to the unknown, and the ratio of peak heights (or
areas) of internal standard and analyte is used for quantitative analysis.
HPLC method validation
Everyday many chromatographers face the need to develop a HPLC separation
whereas individual approaches may exhibit considerable diversity; method
22
Fig .1 Steps involved in HPLC method validation1
1. Introduction on sample Define separation goals
2. Need for special HPLC Procedure, sample, pretreatment, etc
3. Choose detector and Detector settings
4. Choose LC method; Preliminary run; estimate best
separation conditions
5. Optimize separation condition
6. Check for problems or requirements for special procedure
7c. Qualitative method 7a. Recover
purified material
23
AIM AND SCOPE OF THE WORK
1. An RP-HPLC method for the Simultaneous estimation of Metformin
Hcl and Voglibose tablets was developed and Validated in Micro labs in
Hosur.
2. The scope of the study is to Development and validation of
Metformin HCl and Voglibose (500mg&0.3mg) using parameters like
system precision and system suitability, specificity, precision, accuracy,
linearity, robustness.
3. The method has been validated as per the guidelines given by ICH
requirements to assure that the method consistently meets the
24
PLAN OF WORK
Literature survey
Through survey of literature available for Metformin HCl and
Voglibose, regarding their physical and chemical properties, pharmacology,
pharmacokinetics and reported analytical methods, forms the basis for the
development of new RP-HPLC method for simultaneous analysis of these
drugs were designed.
Procurement of samples
Procurement of the drug specimens draws utmosts priority. Both the
drugs obtained from Micro Laboratory as gift samples and characterized by
their melting points.
Development of sample
1. Selection of solvent system.
2. Selection of mobile phase.
3. Simultaneous method development for assay
4. Analysis of the commercially available formulations.
Analytical validations of developed method according to ICH
guideline parameters, which are selected for method validation, are as follows.
25
2. Selectivity
3. Precision
a. Repeatability
b. Intermediate precision
4. Linearity
5. Accuracy
6. Robustness
7. Stability of analytical solutions
VALIDATION PARAMETERS
Prepare the mobile phase and arrange all the parameters as per optimized
method.
I.SYSTEM PRECISION SYSTEM SUITABILITY
I.a. SYSTEM PRECISION
Preparation of standard solution:
Solution-A: Accurately weighed 60mg of Voglibose and transfered to a 100ml
volumetric flask and made up to the volume with diluent. From this 5ml was
pipetted in to a 50ml volumetric flask and made up to the volume with diluent.
Solution-B: Accurately weighed 500mg of Metformin HCl was taken in to a
500ml volumetric flask and add 300ml of diluent dissolvedd to sonicate for
5min. Add 5ml of Solution-A and make up with diluent.
Filter the solution through 0.45µ membrane filter. Inject six
replicated injections in to the HPLC system and calculate the RSD from six
26
I.b.SYSTEM SUITABILITY
1.Blank solution: Purified Water is used as diluent.
2.Standard preparation:
Solution-A: Accurately weighed 60mg of Voglibose and transfed to a 100ml
volumetric flask and made up to the volume with diluent. From this 5ml was
pipette out in to a 50ml volumetric flask and made up to the volume with same
diluent.
Solution-B: Accurately weighed 500mg of Metformin HCl was taken in to a
500ml volumetric flask and add 300ml of diluent dissolvedd to sonicate for
5min. And add 5ml of Solution-A and make up with diluents.
3.Preparation of test solution: About 0.7200gm of sample was added in to a
500ml of volumetric flask and added 300ml of diluent and sonicate for 30min
to obtain uniform dispersion and then volume was made up to the mark with
diluent. Filtered through 0.45µm membrane filter paper.
The results are tabulated.
II. SPECIFICITY
1. Blank solution: Purified Water is used as diluents.
2. Placebo preparation:
Weigh accurately 0.720gms placebo powder and transfered to 500 ml
volumetricflask then added 300ml diluent. Shake and disperse the placebo and
sonicate for 30 minutes to dissolved the content and make up the volume with
diluent. Filter the solution through 0.45µ membrane filter. Collect the filtrate
after discarding first few ml of the filtrate.
3. Standard preparation:
Solution-A: Accurately 60mg of Voglibose was weighed and transfer in to a
100ml volumetric flask and made up to the volume with diluent. From this 5ml
was pipetted out in to a 50ml volumetric flask and made up to the volume with
27
Solution-B: Accurately weighed 500mg of Metformin HCl was taken in to a
500ml volumetric flask and add 300ml of diluent dissolved to sonicate for
5min. And add 5ml of Solution-A and make up with diluent.
4.Preparation of test solution: about 0.7200gm of sample was added in to a
500ml of volumetric flask and add 300ml of diluent and sonicate for 30min to
obtain uniform dispersion and then volume was made up to the mark with
diluent. Filtered through 0.45µ membrane filter paper.
III. PRECISION:
a) Repeatability: establish the repeatability of the analytical method by
estimating the assay for six sample preparations of the same batch under
normal operating conditions. Calculate the assay for all six-sample preparations
and report the %RSD for the same.
1. Blank solution: Purified water used as diluents
2. Standard preparation:
Solution-A: Accurately weighed 60mg of Voglibose transfered to a 100ml
volumetric flask and made up to the volume with diluent. From this 5ml was
pipette out in to a 50ml volumetric flask and made up to the volume with same
diluent.
Solution-B: Accurately weighed quantity of 500mg of Metformin HCl was
taken in to a 500ml volumetric flask and adds 300ml of diluent dissolved to
sonicate for 5min. And add 5ml of Solution-A and make up with diluent.
3.Preparation of test solution: about 0.7200gm of sample was added in to a
500ml of volumetric flask and add 300ml of diluent and sonicate for 30min to
obtain uniform dispersion and then volume was made up to the mark with
diluents. Filtered through 0.45µ membrane filter paper.
b)Intermediate precision (ruggedness): intermediate precision study was
carried out by repeating the complete experiment with different analysts, on
28
1.Blank solution: Purified water used as diluent
2. Standard preparation:
Solution-A: Accurately weighed 60mg of Voglibose transferred to a 100ml
volumetric flask and made up to the volume with diluent. From this 5ml was
pipette out in to a 50ml volumetric flask and made up to the volume with same
diluent.
Solution-B: Accurately weighed quantities 500mg of Metformin HCl was
taken in to a 500ml volumetric flask and add 300ml of diluent dissolved to
sonicate for 5min. And add 5ml of Solution-A and make up with diluent.
3.Preparation of test solution: about 0.7200gm of sample was added in to a
500ml of volumetric flask and add 300ml of diluent and sonicate for 30min to
obtain uniform dispersion and then volume was made up to the mark with
diluent. Filtered through 0.45µ membrane filter paper.
IV. LINEARITY:
Preparation of standard stock solution:
Accurately weighed 60mg of Voglibose working standard transferred to
100ml volumetric flask and dissolved with diluent and make up the volume
(solution A). Accurate weigh 5000mg of Metformin Hcl working standard and
transfered to 500ml volumetric flask and dissolved it in 300ml of diluent. Take
5ml of above solution A and transfered into a 500ml of Metformin Hcl
volumetric flask and make up the volume with diluent.
Preparation of linearity solution (50%): Pipette out 5ml from stock solution
in to a clean 100ml volumetric flask and make up to volume with diluent.
Preparation of linearity solution (75%): Pipette out 7.5ml from stock
solution in to a clean 100ml volumetric flask and make up to volume with
29
Preparation of linearity solution (100%): Pipette out 10ml from stock
solution in to a clean 100ml volumetric flask and make up to volume with
diluent.
Preparation of linearity solution (125): Pipette out 12.5ml from stock
solution in to a clean 100ml volumetric flask and make up to volume with
diluent.
Preparation of linearity solution (150%): Pipette out 15ml from stock
solution in to a clean 100ml volumetric flask and make up to volume with
diluent.
Run the solutions as described above.
V. ACCURACY/ RECOVERY:
Preparation of standard stock solution-A:
Accurately weighed 60mg of Voglibose working standard and transfered in
to a 100ml volumetric flask and dissolved with diluent and make up the volume
with diluent (solution A).
Preparation of linearity solution (50%): Accurately weighed 50mg of
Metformin HCl in to a 100ml volumetric flask containing about 145mg of
placebo and 5ml of Solution-A and added 70ml of diluent and sonicate about
30min to dissolved the content and make up the volume with diluent. Filter the
solution through 0.45µ membrane filter. Repeat this procedure for another two
sample preparations.
Preparation of linearity solution (75%): Accurately weighed 75mg of
Metformin HCl in to a 100ml volumetric flask containing about 145mg of
placebo and 7.5ml of Solution-A and added 70ml of diluent and sonicate about
30
solution through 0.45µ membrane filter. Repeat this procedure for another two
sample preparations.
Preparation of linearity solution (100%): Accurately weighed 100mg of
Metformin HCl in to a 100ml volumetric flask containing about 145mg of
placebo and 10ml of Solution-A and add 70ml of diluent and sonicate about
30min to dissolved the content and make up the volume with diluent. Filter the
solution through 0.45µ membrane filter. Repeat this procedure for another two
sample preparations.
Preparation of linearity solution (125%):Accurately weighed about 125mg
of Metformin HCl in to a 100ml volumetric flask containing about 145mg of
placebo and 12.5ml of Solution-A and add 70ml of diluent and sonicate about
30min to dissolved the content and make up the volume with diluent. Filter the
solution through 0.45µ membrane filter. Repeat this procedure for another two
sample preparations.
Preparation of linearity solution (150%): Accurately weighed quantity
about 150mg of Metformin HCl in to a 100ml volumetric flask containing
about 145mg of placebo and 15ml of Solution-A and add 70ml of diluent and
sonicate about 30min to dissolved the content and make up the volume with
diluent. Filter the solution through 0.45µ membrane filter. Repeat this
procedure for another two sample preparations.
VI. STABILITY OF ANALYTICAL SOLUTIONS:
To establish the stability of analytical solutions by injecting the
standard and sample solutions at periodic intervals up to 24hours.
31
2. Standard preparation:
Solution-A: Accurately weighed 60mg of Voglibose transfered in to a 100ml
volumetric flask and made up to the volume with diluent. From this 5ml was
pipette out in to a 50ml volumetric flask and made up to the volume with same
diluent.
Solution-B: Accurately weighed quantity 500mg of Metformin HCl was taken
in to a 500ml volumetric flask and add 300ml of diluent dissolved to sonicate
for 5min. And add 5ml of Solution-A and make up with diluent.
3. Preparation of test solution: about 0.7200gm of sample was added in to a
500ml of volumetric flask and add 300ml of diluent and sonicate for 30min to
obtain uniform dispersion and then volume was made up to the mark with
diluent. Filtered through 0.45µ membrane filter paper.
VII. ROBUSTNESS:
To determine the robustness of the analytical method. The robustness
of an analytical procedure is a measure of its capacity to remain unaffected by
small but deliberate variations in procedural parameters listed in the procedure
documentation and provides an indication of its suitability during normal
usage. Perform the study by evaluating the system suitability parameter and
estimating the assay under deliberately modified chromatographic conditions.
Deliberately modified chromatographic conditions: Deliberately modify the
actual chromatographic conditions specified under the method like flow rate,
mobile phase composition, column temperature on lower and higher side of the
actual value. Evaluate system suitability and determine the assay of Metformin
HCl and Voglibose under these
1. Blank solution: Purified water used as diluent
2. Standard preparation:
Solution-A: Accurately weighed 60mg of Voglibose transfered in to a 100ml
32
pipette out in to a 50ml volumetric flask and made up to the volume with same
diluent.
Solution-B: Accurately weighed quantitiy 500mg of Metformin HCl was
taken in to a 500ml volumetric flask and add 300ml of diluent dissolved to
sonicate for 5min. And add 5ml of Solution-A and make up with diluent.
3. Preparation of test solution: about 0.7200gm of sample was added in to a
500ml of volumetric flask and add 300ml of diluent and sonicate for 30min to
obtain uniform dispersion and then volume was made up to the mark with
diluent. Filtered through 0.45µ membrane filter paper. Robustness parameters
S.No Chromatographic parameter Low High
1 Flow Rate(1.0ml/min) 0.8ml 1.2ml
2 Column Temperature(25oC) 23oC 27oC
3
Mobile phase composition(Buffer:
Acetonitrile 380:620) 400:600 360:640
4 Buffer pH(6.5) 6.3 6.7
Separately inject 20µl of blank, standard and sample preparations in to the
chromatograph set under deliberately modified chromatographic conditions are
record the chromatograms. Measure the peak responses.
CHROMATOGRAMS
II. SPECIFICITY:
33
34
Fig- Blank
Fig- Metformin HCl
35
III.PRECISION:
a) Repeatability:
36
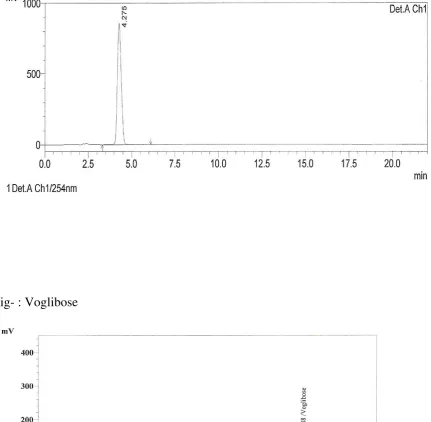
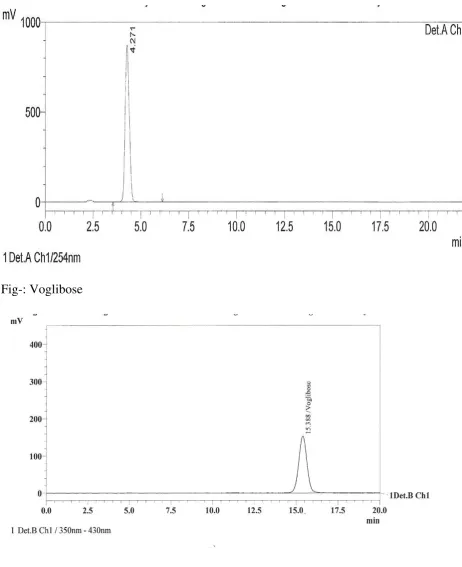
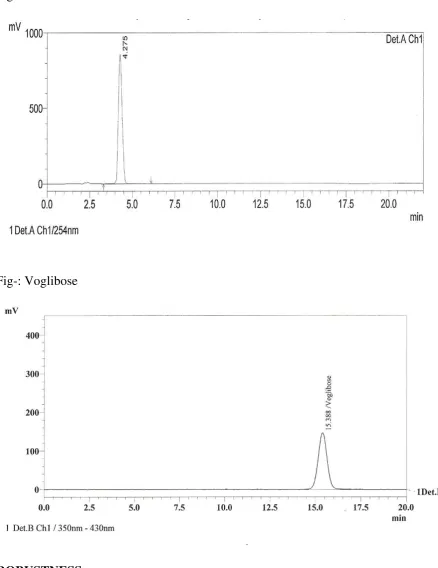
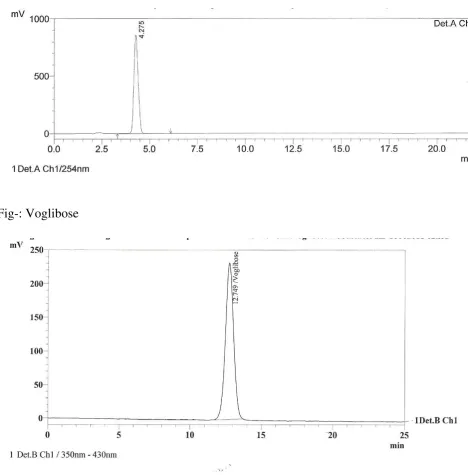
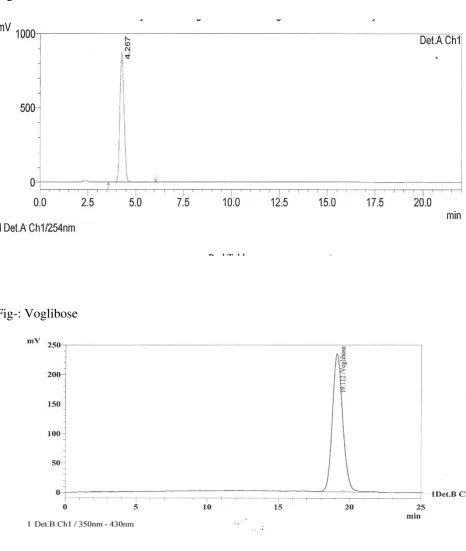
Fig- Voglibose
b) Intermediate Precision (Day to Day):
Fig- Metformin HCl:
37
LINEARITY:
Metformin HCl:
Fig- Metformin HCl 50%
38
Fig- Metformin HCl 75%
.
39
Fig- Metformin HCl 125%
Fig- Metformin HCl 150%
40
Fig- Voglibose 50%
.
Fig- Voglibose 75%
41
Fig- Voglibose 100%
Fig- Voglibose 125%
.
42
.
ACCURACY/RECOVERY:
Fig-: Metformin HCl 50%
43
Fig- Metformin HCl 75%
44
.
Fig-: Metformin HCl 100%
45
.
Fig-: Metformin HCl 125%
46
Fig-: Metformin HCl 150%
47
STABILITY OF ANALYTICAL SOLUTIONS:
48
Fig-: 0th hour- Metformin HCl
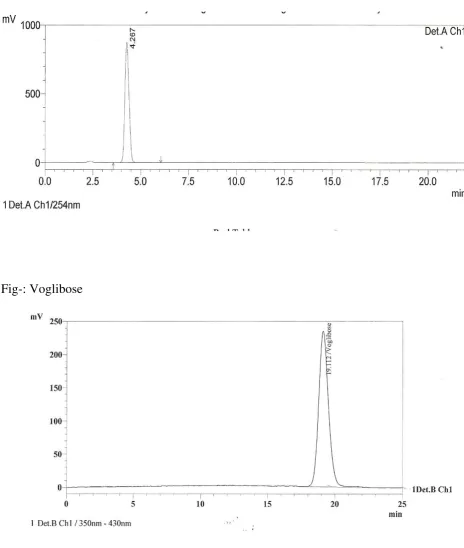
Fig-: Voglibose
49
Fig-: Voglibose
50
51
[image:51.595.97.529.96.518.2]Fig-: 8th hour- Metformin HCl
Fig- : Voglibose
52
Fig-: Voglibose
53
54
Fig- 24th hour-Metformin HCl
Fig-: Voglibose
ROBUSTNESS:
55
[image:55.595.93.562.78.554.2]Fig-: Metformin HCl
56
[image:56.595.94.561.100.652.2]Robustness of Low flow (0.8ml):
Fig-: Metformin HCl
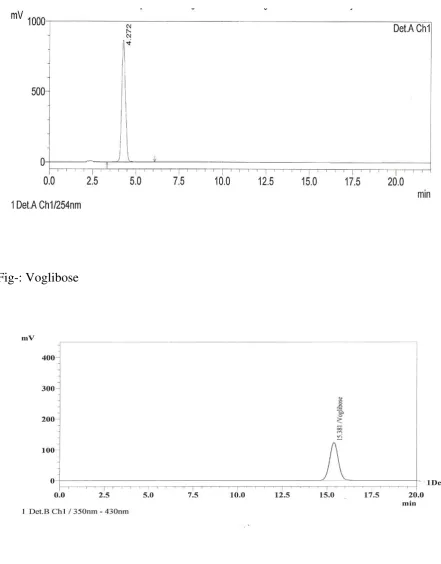
Fig-: Voglibose
57
Fig-: Metformin HCl
[image:57.595.90.547.78.605.2].
Fig-: Voglibose
58
[image:58.595.93.535.78.643.2]Fig-: Metformin HCl
Fig-: Voglibose
.
59
[image:59.595.89.554.75.624.2]Fig-: Metformin HCl
Fig-: Voglibose
60
[image:60.595.86.524.71.653.2]Fig-: Metformin HCl
Fig-: Voglibose
.
61
Fig-: Metformin HCl
.
62
[image:62.595.93.532.133.676.2]Robustness of Low pH (6.3):
Fig-: Metformin HCl
Fig-: Voglibose
RESULTS AND DISCUSSION
63
System
suitability
parameter
Retention
Time AUC
Theoretical
Plates
Tailing
factor
Solution-1 4.27 13441854 5978 1.17
Solution-2 4.25 13569231 5895 1.15
Solution-3 4.50 13442183 5965 1.16
Solution-4 4.31 13395011 5988 1.18
Solution-5 4.55 13454363 5875 1.05
Solution-6 4.51 13460528 5896 1.06
Mean 13460528.33
S.D 58020.83
64
Table:I b.System suitability parameters for Voglibose
System
suitability
parameter Retention Time AUC
Theoretical
Plates
Tailing
factor
Solution-1 15.20 119290 5978 1.17
Solution-2 15.10 120153 5895 1.15
Solution-3 15.10 119909 5965 1.16
Solution-4 15.00 120661 5988 1.18
Solution-5 15.12 120353 5875 1.05
Solution-6 15.02 120095 5896 1.06
Mean 120076.8
S.D 462.8
R.S.D 0.39
Acceptance criteria: theoretical plate ≥ 2000, Tailing factor ≤ 2.
Result:
Standard solution of Metformin HCl and Voglibose was determined
under proposed condition chromatogram indicating satisfactory % RSD of peak
65
II. SPECIFICITY
As per optimized method Standard and Sample preparations are
prepared and injected.
Acceptance criteria: No interference at the Rt of Metformin HCl and
voglibose
Result:
No peak observed due to blank, placebo at the retention time of
Metformin HCl and Voglibose peak.
[image:65.595.86.397.377.750.2]III. PRECISION:
Table No :III.a Repeatability
Metformin HCl Voglibose
Inj AUC Percentage AUC Percentage
1 13431738 99.7 120983 100.3
2 13422222 99.8 120974 100.4
3 13370026 99.3 120641 100.3
4 13418095 99.7 122999 102.4
5 13434540 99.8 122562 102.0
6 13430087 99.6 122700 102.0
Mean 99.65 101.23
S.D 0.19 1.00
66
Acceptance Criteria: %RSD of the assay percents should not be more than 2.
And assay % percent should be 95-105%.
Result:
The relative Standard deviation for the assay of six sample preparations
of Metformin HCl and Voglibose was found 0.19% and 0.99%.
CALCULATION:
Amount of Metformin HCl present in mg:
A x Ws x 500 x P x Aw x1000
B x 500x Wt taken x 100
A = peak area of Metformin HCl for sample preparation
B = peak area of Metformin HCl for standard preparation
Ws = weight of Metformin HCl in mg
P = potency of Metformin HCl
Aw = average weight of the tablets
Amount of Metformin HCl in mg:
= 13431738 x 500 x 500 x 100x 0.7620 x 1000
13460528 x 500x 0.7625x100
= 498.93mg
Assay in % = 498.93 x 100
500
67
Amount of Voglibose present in mg:
A x Ws x 5x 5 x 500 x P x Aw x1000
B x 100x50x 500 x Wt taken x 100
Assay in % = Assay in mg x 100
Label Claim
Amount of Voglibose in mg:
120983 x 60 x 5 x 5 x 500 x 99.62 x 0.7620x 1000
120073 x100 x 50 x 500 x 0.7625 x 100
= 0.3002mg
Assay in % = 0.3002 x 100
0.3
68
[image:68.595.142.456.114.492.2]IIIb. Intermediate precision:
Table No:III.b Intermediate Precision
Metformin HCl Voglibose
Inj AUC Percentage AUC Percentage
1 13486738 99.5 121125 100.59
2 13555222 100 120065 100.58
3 13480030 99.5 121104 100.66
4 13489595 99.7 123303 102.8
5 13514540 99.8 119562 101.5
6 13575591 100.1 123254 102.3
Mean 99.77 101.41
S.D 0.25 0.96
R.S.D 0.25 0.95
Acceptance criteria: %RSD of the assay percents should not be more than 2.
And assay % percent should be 95-105%.
Result:
The difference in the assay of relative standard deviation between two
69
CALCULATION:
Amount of Metformin HCl present in mg:
= A x Ws x 500 x P x Aw x1000
B x 500x Wt taken x 100
Amount of Metformin HCl in mg:
= 13486738 x 500 x 500 x 1000.7620 X 1000
13460528 x 500 x 0.7625 x 100
= 497.93mg
Assay in % = 497.93 x 100
500
= 99.5%
Amount of Voglibose present in mg:
A x Ws x 5x 5 x 500 x P x Aw x1000
B x 100x50x 500 x Wt taken x 100
Assay of Voglibosein mg:
= 121125 x 60 x 5 x 5 x 500 x 99.62 x 0.7620X 1000
120073 x 100 x 50 x 500 x 0.7625 x 100
= 0.3002mg
Assay in % = 0.3002 x 100
0.3
70
IV. LINEARITY:
Table No: IVa. Linearity for Metformin HCl
S.No
Test con
in%
Con in
PPM
Replication
inj Area
Average
Area
1 50% 500.00
1 6825366
6807014
2 6795821
3 6799856
2 75% 750.00
1 10052869
10169429
2 10256892
3 10198527
3 100% 1000.00
1 13592568
13532506
2 13499256
3 13505695
4 125% 1250.00
1 16892546
16941649
2 17012036
3 16920365
5 150% 1500.00
1 20165036
20540572
2 20935242
71
Acceptance criteria: r2should not be less than 0.99
Result:
The relationship between the concentration and the peak response of
Metformin HCl was linear in the specific range and the regression coefficient
[image:71.595.136.540.258.458.2]was found to be 0.999.
Fig No: 1 Linearity curve for Metformin HCl
Calculation for ppm:
Std wt x Pipetted out x 1000
500 x 100
5000 x 5 x 1000 =500 ppm
500 x 100
5000 x 7.5 x 1000 =750 ppm
500 x 100
5000 x 10 x 1000 =750 ppm
6807014
10169429
13532506
16941649
20540572 y = 3E+06x + 3E+06
R² = 0.9998
0 5000000 10000000 15000000 20000000 25000000
500 750 1000 1250 1500
72
500 x 100
5000 x 12.5 x 1000 =750 ppm
500 x 100
5000 x 15 x 1000 =750 ppm
[image:72.595.120.521.280.733.2]500 x 100
Table No: IVb. Linearity for Voglibose
S.No
Test con
in%
Con in
PPM
Replication
inj Area
Average
Area
1 50% 0.30
1 61259
61080
2 60958
3 61024
2 75% 0.45
1 91256
91691
2 92563
3 91254
3 100% 0.60
1 121356
121055
2 120598
3 121210
4 125% 0.75
1 150569
151419
2 151236
73
5 150% 0.90
1 186025
187925
2 187536
[image:73.595.145.509.245.464.2]3 190215
Fig No: 2 Linearity curve For Voglibose
Acceptance criteria: r2should not be less than 0.99.
Result:
The relationship between the concentration and the peak response of
Voglibose was linear in the specific range and the regression coefficient was
found to be 0.998.
Calculation for PPM:
Std wt x 5 x 5 x 1000
100 x 500 x 100
60 x 5 x 5 x 1000 =0.30ppm
61080
91691
121055
151753
187592 y = 31309x + 28708
R² = 0.9986
0 20000 40000 60000 80000 100000 120000 140000 160000 180000 200000
0.30 0.45 0.60 0.75 0.90
74
100 x 500 x 100
60 x 5 x 7.5 x 1000 =0.45ppm
100 x 500 x 100
60 x 5 x 10 x 1000 =0.60ppm
100 x 500 x 100
60 x 5 x 12.5 x 1000 =0.75ppm
100 x 500 x 100
60 x 5 x 15 x 1000 =0.90ppm
100 x 500 x 100
Result:
S.NO Parameter
Metformin
HCl Voglibose
1 Slope 3E 31309
2
75
[image:75.595.73.533.117.330.2]V. ACCURACY:
Table No: Va. Recovery data for 50%:
Metformin HCl Voglibose
S.NO
Con in
%
Amount of
Placebo added
in (mg) AUC Percentage AUC Percentage
1 50% 145 6807014 100.6 61080 102.2
2 50% 145 6799013 100.5 61349 102.7
3 50% 145 6805555 100.6 60945 102.0
CALCULATION
Recovery for Metformin HCl in mg:
Sample area x 500 x 500
Std area x 500 x 1
Recovery in % :
Recovery in mg x 100
Wt of Std added
6807014 x 500 x 500 = 2513mg
13550668 x 500 x 1
2513 =50.25%
76
Recovery for Voglibose:
Sample area x 60 x 5 x 500
Std area x 100 x 50 x 1
Recovery in % :
Recovery in mg x 100
Wt of Std added
61080 x 60 x 5 x 500 = 1514mg
[image:76.595.66.529.409.620.2]120983 x 100 x 50 x 1
Table No: Vb. Recovery data for 75%:
Metformin HCl Voglibose
S.NO
Con in
%
Amount of
Placebo added
in (mg) AUC Percentage AUC Percentage
1 75% 145 10120057 99.7 91691 102.3
2 75% 145 10169429 100.2 91221 101.8
77
Table No:Vc. Recovery data for 100%:
Metformin HCl Voglibose
S.NO
Con in
%
Amount of
Placebo added
in (mg) AUC Percentage AUC Percentage
1 100% 145 13411089 99.1 121055 101.3
2 100% 145 13449139 99.4 122890 102.9
3 100% 145 13532506 100.0 121495 101.7
Table No:Vd. Recovery data for 125%:
Metformin HCl Voglibose
S.NO
Con in
%
Amount of
Placebo added
in (mg)
AUC Percentage AUC Percentage
1 125% 145 16878822 99.8 151419 101.4
2 125% 145 16941649 100.2 151315 101.3
[image:77.595.65.529.458.669.2]78
Table No:Ve. Recovery data for150%:
Metformin HCl Voglibose
S.NO Con in
%
Amount of
Placebo added
in (mg)
AUC Percentage AUC Percentage
1 150% 145 20540572 101.2 186259 103.9
2 150% 145 20739237 102.2 182972 102.1
3 150% 145 20280016 99.9 183696 102.5
Fig No: 3 Recovery curve for Metformin HCl:
. 6803861 10174194 13464245 16885521 20519942 y = 3E+06x + 3E+06
R² = 0.9997
0 5000000 10000000 15000000 20000000 25000000
50 75 100 125 150
[image:78.595.130.509.423.656.2]79
Fig No: 4 Recovery curve for Voglibose
Acceptance criteria: the % recovery of each level should be with in the range
of 95-105%
Result:
The percentage of recovery of Metformin HCl and Voglibose was found
97.0% to 103.0%.
VI. SOLUTION STABILITY OF ANALYTICAL SOLUTIONS
Table No:VI. Stability of Analytical solutions
Time
interval
Peak response for
Metformin HCl
Peak response for
Voglibose
0th hour 13399963 121125
2th hour 13427856 121883
4th hour 13409897 120452
8th hour 13419360 122453
12th hour 13416331 121563
61125
91296
121813
151876
184309 y = 30695x + 29999
R² = 0.9998
0 20000 40000 60000 80000 100000 120000 140000 160000 180000 200000
50 75 100 125 150
[image:79.595.90.471.525.757.2]80
18th hour 13421622 122325
24th hour 13254286 121350
Mean 13392759.29 121593
S.D 61709.67638 700.0449986
R.S.D 0.46076895 0.575728042
Acceptance criteria: %RSD of the peak response should not be more than 2.
Result:
%RSD of Metformin HCl and Voglibose was found 0.46 and 0.57
respectively until 24 hrs.
VII. ROBUSTNESS
Table No: VII a. Robustness High
flow(1.2ml):
Metformin HCl Voglibose
S.NO AUC Assay in % AUC Assay in %
1 13540526 101.7 119025 99.8
2 13302485 99.5 122546 102.3
3 13454865 100.5 120458 100.4
Mean 100.57 100.83
S.D 1.10 1.31
81
Table No: VII b. Robustness Low
flow(0.8ml):
Metformin HCl Voglibose
S.NO AUC Assay in % AUC Assay in %
1 13530522 100.3 122025 100.9
2 13402452 99.7 123006 102.1
3 13334865 99.4 122258 101.7
Mean 99.80 101.57
S.D 0.46 0.61
R.S.D 0.46 0.60
Table No:VII c. Robustness of High
Temp(27 C);
Metformin HCl Voglibose
S.NO AUC Assay in % AUC Assay in %
1 13580524 100.9 121525 101.1
2 13292485 98.6 123046 102.4
3 13334865 99.2 119400 99.4
[image:81.595.85.469.140.407.2]82
S.D 1.19 1.50
R.S.D 1.20 1.49
TableNo:VII d.Robustness of Low
Temp(23OC):
Metformin HCl Voglibose
S.NO AUC Assay in % AUC Assay in %
1 13180524 99.0 120025 100.6
2 13092485 98.0 118546 99.0
3 13124865 98.1 118400 98.7
Mean 98.37 99.43
S.D 0.55 1.02
R.S.D 0.56 1.03
83
400:600):
Metformin HCl Voglibose
S.NO AUC Assay in % AUC Assay in %
1 13680524 102.2 122653 102.5
2 13352485 99.9 121542 101.7
3 13854865 103.2 122412 102.0
Mean 101.77 102.07
S.D 1.69 0.40
84
Table No:VII f. Robustness of Mobile phase Changes (Buffer:ACN
360:640):
Metformin HCl Voglibose
S.NO AUC Assay in % AUC Assay in %
1 13280524 99.7 121653 102
2 13392485 100.2 117546 98.1
3 13024865 97.3 119412 99.5
Mean 99.07 99.87
S.D 1.55 1.98
85
Table No:VII g. Robustness of High
pH(6.7):
Metformin HCl Voglibose
S.NO AUC Assay in % AUC Assay in %
1 13411089 99.4 121055 101.5
s2 13292485 98.6 123046 102.4
3 13532506 100 122890 102.9
Mean 99.33 102.27
S.D 0.70 0.71
86
Table No:VII h. Robustness of
LowpH(6.3):
Metformin HCl Voglibose
S.NO AUC Assay in % AUC
Assay in
%
1 13370026 99.3 120601 100.3
2 13418095 99.7 122999 102.4
3 3434540 99.8 122562 102.0
Mean 99.60 101.57
S.D 0.26 1.12
R.S.D 0.27 1.10
Result:
87
CALCULATION:
Amount of Metformin HCl present in mg:
= A x Ws x 500 x P x Aw x1000
B x 500x Wt taken x 100
Amount of Metformin HCl in mg:
= 13370026 x 500 x 500 x 100 x 0.7620 X 1000
13460528 x 500 x 0.7625 x 100
= 496.93mg
Assay in % = 497.93 x 100
500
= 99.3%
Amount of Voglibose present in mg:
A x Ws x 5x 5 x 500 x P x Aw x1000
B x 100x50x 500 x Wt taken x 100
Assay of Voglibosein mg:
= 120601 x 60 x 5 x 5 x 500 x 99.62 x 0.7620X 1000 = 0.3012mg
120173 x 100 x 50 x 500 x 0.7625 x 100
Assay in % = 0.3002 x 100 = 100.3%
0.3
Observation : when flow rate was changed Rt had changed significantly,
when mobile phase was changed there was change in the Rt had changed
significantly, when the temperature and pH were changed there were no
changes observed. So care must be taken while selecting the mobile phase and
88
While changing all the above parameters the assay% was observed