Modelling the Response of Deep Foundations under
Oblique Loading
K. Johnsona, P. Lemckea, W. Karunasenaa and N. Sivakugana
aSchool of Engineering, James Cook University, Townsville, Queensland, 4811, Australia.
Abstract: Deep foundations are slender pile elements used to transfer loads from structures into deeper soil strata below the ground. Deep foundations have a variety of loads including axial, lateral and moments. Often these loads will act together to form a combination of loads, such as oblique forces that have a component of axial and lateral forces. Due to the pile’s length, which can extend past 30 m, it is difficult and expensive to carry out full scale testing. Any full-scale test data is limited to the area conditions and soil properties at the testing site. Small scale testing can be used as an alternative to full scale testing, although scaling effects will influence the conclusions from this type of study greatly. Computer simulations of finite element modelling allow for in- depth studies into the complex pile-soil interaction under combination loading in deep foundation structures. This work used 3D finite element modelling to explore the effect of pile shape, sand properties, pile length and loading conditions on the capacity of a pile. Using trends discovered by these simulations design charts were developed to aid consultants when determining the bearing capacity for oblique interaction for square piles. It was found through a carefully planned sensitivity analysis that sand properties and pile shape can influence the capacity of a pile extensively. The mesh density, boundary and initial stress conditions imposed on the simulation will ultimately determine the accuracy and reliability of the model results. To gain a good understanding of a model’s capability and accuracy the simulation output must be tested and verified against case studies. The trends obtained from modelling the complex mechanisms such as the pile-soil interaction allows for greater understanding of failure mechanisms, which could otherwise not be observed.
Keywords: ABAQUS; Pile foundation; Pile-soil interaction
1. INTRODUCTION
Pile foundations are quite effective, especially in weaker soils, for transferring the structural loads to the underlying ground. Unlike shallow foundations, in pile foundations the load transfer mechanism is very complex and not fully understood yet. Thus most design procedures were developed assuming a circular pile and elastic response for the stress-strain relationship within the materials.
Lately both industry and researchers have begun to explore the advantages and disadvantages of using other cross-sectional shapes rather than the traditional circular pile. These shapes have included solid concrete octagonal and square piles, or alternatively hollow sections with and without end caps. With expanding ranges in pile technology comes the need to fine tune or expand existing pile design procedures to give rational predictions for pile response. Piles are difficult to investigate via laboratory testing due to their
scale. Therefore, numerical methods such as finite element method (FEM) can be used to gain an understanding of the failure mechanisms experienced by piles under various loading conditions.
The following work explores the pros and cons of using a cast in place square pile over the traditional circular pile. To accomplish the modelling work the finite element package ABAQUS was utilised. During the analysis it became evident that factors such as length to diameter ratio, sand constitutive properties and load direction play key roles in both real and model pile predictions.
2. GOVERNING FACTORS
Previous studies have explored constitutive models and found the use of isotropic models such as elastic, Mohr-Coulomb and Drucker-Prager are sufficiently accurate (Chen & Saleeb 1983, Hibbitt et al. 1998). In the past linear elastic constitutive models have been commonly used in developing pile design methods (Poulos & Davis 1980). The differences between a purely elastic and Mohr Coulomb constitutive model are shown in the following sections.
modelled is complex and simplifications have to be made to obtain a solution. Two of the governing factors which have a vast impact on both the real and model piles are:
a) the constitutive properties of the sand; and b) the pile-soil interaction at the interface over
the pile surface.
2.1 Constitutive Models
FEM has become increasingly popular as a soil response prediction tool. This has led to a higher demand for researchers to develop more comprehensive descriptions for soil behaviour, which in turn leads to more complex constitutive relationships. Prevost and Papescu (1996) state that for a constitutive model to be satisfactory it must be able to:
2.1.1 Linear Elastic Constitutive Model
The linear elastic constitutive model (Hooke’s law) is probably the most common model used in the engineering world to approximate a material’s stress-strain relationship. Hooke’s law relates the stresses and strains through two constants, Young’s modulus (E) and Poisson’s ratio (ν).
1) make a statement about the material behaviour for all stress and strain paths;
2.1.2 Mohr-Coulomb’s Model 2) identify model parameters by means of
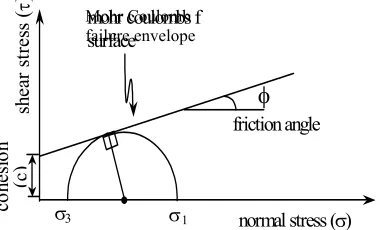
standard material tests; and As previously discussed soil behaves elasto-plastically, and when the sand is subjected to loads the displacement will contain both a recoverable and non-recoverable component. Therefore, a failure criteria needs to be included in the elastic models to define the stress states that cause plastic deformation. One possible failure envelope is Mohr-Coulomb surface as shown in Figure 3.
3) physically represent the material response to changes in applied stress or strain.
From standard tests researchers have determined that sand behaves elasto-plastically when loaded as shown in Figures 1 to 2.
perfectly plastic
E = young’s modulus
strain perfectly elastic
1
ess
st
[image:2.612.329.519.445.560.2]r
Figure 1. Ideal stress-strain relationship assumed for most structural materials.
normal stress (σ)
sh
ear
st
re
ss
(τ
)
φ
ailure
σ3 σ1
co
he
si
on
(c)
friction angle
σ1
mohr coulombs f surface
Mohr Coulomb failure envelope
strain unloading /reloading line when unloading the material rebounds partially
[image:2.612.97.255.556.670.2](b)
Figure 3. Mohr Coulomb’s failure surface.
ess
st
r
The failure envelope is only dependent on the major and minor principle stresses (σ1, σ3), and is independent from the intermediate principle stress (σ2). When mapped into three dimensional stress space Mohr-Coulomb resolves into an irregular hexagonal pyramid. This pyramid forms the failure/yield envelope, which in turn governs how the soil will behave. The material will behave elastically if the stress point lies within the failure envelop. However, if the stress reaches the yield surface the material will
undergo a degree of plastic deformation. In the Mohr-Coulomb model used herein, it is assumed that the soil has a linear elastic relation until failure.
2.2 Pile-Soil Interaction
The interaction at the pile-soil surface can range from perfect contact where no relative sliding between soil and pile occurs to perfect sliding conditions where no friction develops along the shaft of the pile. Initially, it was assumed the soil and pile are both deformable bodies and can undergo finite sliding.
0
10
20
30
40
0 200 400 600 800 Load (kN)
D
isp
la
ce
m
en
t (
m
m
)
Actual
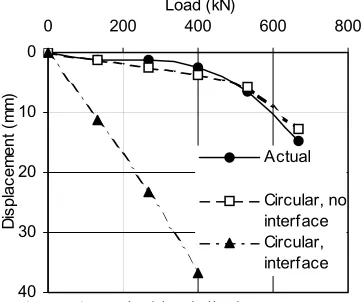
[image:3.612.326.521.368.684.2]Circular, no interface Circular, interface A basic Coulomb frictional model was used to govern the interaction between the pile and sand surfaces (Hibbitt et al., 1998). However, it was determined through the verification stage that the interface characteristics were dependent on the placement method of the pile. Piles that are impact driven (ID) tend to exhibit degrees of relative motion between the pile and soil once the system is under load. It was also determined through the FEM analysis that cast-in-place (CIP) piles tend to have much less relative sliding than their ID counterpart. A typical load-displacement curve for a 7.32 m cast-in-place circular pile in sand is shown in Figure 4.
Figure 4. Typical load-displacement curve.
The preliminary model results shown in the above figure were obtained from the mesh shown in figure 5. The predicted deflection for the CIP pile was approximately 10 times greater than that of the experimental pile, while the interface was activated. The model reduced to being a factor of 1.2 times the experimental deflection when the interface was not active. This means that for cast-in-place concrete piles some bondage between the concrete and surround soil may have occurred and thereby not allowing the slippage
normally observed along a smooth dry concrete surface. Also construction methods for cast-in-place piles are crude and this results in irregular rough sides not allowing a continuous slip surface to exist. Therefore, it was concluded that cast-in-place piles were better represented by a perfectly bonded surface allowing no relative slippage to occur.
However, for impact driven piles an interface model would be required to allow relative motion. In previous studies it was found that when modelling small test steel piles placed into sand the interface was a crucial part of the model (Johnson et al. 2001). This would suggest that the pile-soil interaction at the pile’s surface is dependent on the placement type and can affect a model’s accuracy significantly.
3. NUMERICAL MODEL
Two models were constructed in ABAQUS to allow load-deflection curves to be established for both square and circular piles. These models are shown in Figures 5 and 6.
Figure 5. Circular pile mesh.
fixed boundary
pile elements
degrees of freedom = 40866
Soil elements
roller boundary
degrees of freedom = 78378 pile
elements
Soil elements
fixed boundary roller
boundary
[image:3.612.95.276.413.564.2]Table 1: Test pile properties. The general characteristics of the meshes are as
follows: Material
Length (m)
Outer Diameter (m) Young’s Modulus (GPa) Poisson’s Ratio
Concrete 7.32 0.457 30 0.15 • Element Type: due to the pile shape and load
application angles not being axial the problem was discretized using 3-D finite elements. Twenty noded reduced rectangular prisms were utilised. These rectangular prisms have parabolic shape functions to approximate the displacement pattern between nodes.
Standard penetration test (SPT) results were available for the sand profile around the pile. Using the SPT data and pre-existing empirical correlations the friction angle (Peck et al., 1974) and Young’s modulus (Das, 1999) of the sand could be approximated. The sand was separated into two distinct homogenous layers with different properties. These layer properties are given in Table 2.
• Boundary Conditions: two separate boundary conditions were imposed onto the models. Due to symmetry the problem space could be reduced into half of its original size. The nodes at the base of the mesh and far bounds are fixed against displacement and rotation. The nodes on the plane of symmetry are restrained from moving normal to the plane, but can move vertically and along the plane (see Figs 5 and 6).
[image:4.612.326.522.287.349.2]
Table 2: Sand properties. Sand
Layer
Friction Angle (°)
Young’s Modulus (MPa)
Poisson’s Ratio
Top* 35 19 0.3
Bottom 40.5 52.8 0.4
• Input Data: the pile and soil properties given in section 3.1 were used in the numerical analysis. It was assumed that the sand behaved linearly elastically until a Mohr Coulomb’s plastic failure envelope was reached. Once the stress state at any location reaches the failure surface it will undergo plastic deformation. These constitutive parameters and an initial stress state were imposed on the model before the analysis was started. The initial stress accounted for the insitu stresses due to self-weight of the system before the load is added.
*The top layer of sand extended from the surface to approximately 1.5m below the pile.
3.1.2 Verification Results
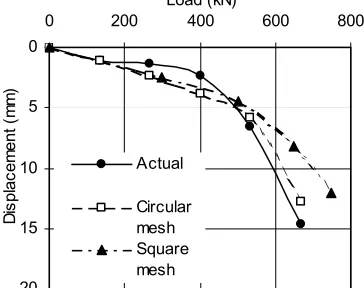
Several mesh densities and fixed boundary locations were trailed until a converged numerical solution was achieved. The final converged load-deflection curves for both the square and circular models are plotted against the actual test results in Figure 7.
3.1 Verification
To verify the reliability of the FEM pile meshes developed, load-deflection response from theory was compared against a number of full-scale pile test data. The test data used was obtained from the electronic deep foundation load test database developed by the Federal Highway Administration in America [http://www.tfhrc. gov/structur/agids/agids.htm]. Several individual piles were selected where the sand and pile properties could be established. Below is an example of an axially loaded verification pile case used.
3.1.1 Material Properties and Dimensions The circular cast-in-place test pile was made of solid reinforced concrete. The test pile properties and dimensions are summarized in Table 1.
0
5
10
15
20
0 200 400 600 800 Load (kN)
D
isp
la
ce
m
en
t (
m
m
)
Actual
Circular mesh Square mesh
Figure 7. Verification load-displacement curve.
[image:4.612.330.512.475.619.2]pile had a slightly higher contact area and therefore should yield slightly higher ultimate capacities. This was supported by the model results shown in Figure 7.
Three loading angles were chosen: axial, 45° oblique and lateral. All the loads were in plane so the results obtained for the square pile can only be applied in the field designs where similar conditions exist.
Further verification cases included small/full scale test data on both square and circular piles. The mesh results yielded results which were realistic, and gave a degree of confidence that the meshes were behaving reasonably.
4.2 Shape Factor (Fs) Design Chart
Current methods for pile design have assumed that the bearing capacity of a pile is independent of the pile’s shape. Therefore, simplified prediction methods based on a circular pile cross-section were established from experimental and theoretical studies. When designing piles other than circular, designers often convert the cross-sectional area to an equivalent circular area. This enables them to use the traditional methods to predict the bearing capacity. Through the numerical analysis it was found that the shape of the pile’s cross-section could have a considerable influence on the pile’s lateral and oblique bearing capacities. This observation was also seen in the experimental work conducted by Ashour and Norris (2000).
4. SHAPE FUNCTIONS/OBLIQUE INTERACTION
Using the models developed in the previous section, design charts were established to aid in the prediction of bearing capacity for cast-in-place square piles. During the numerical analysis, it became evident that the loading direction influenced the performance of the piles of different cross-sectional shapes. Therefore, effect of the angle of loading was also investigated using the numerical models.
4.1 Numerical Test Cases
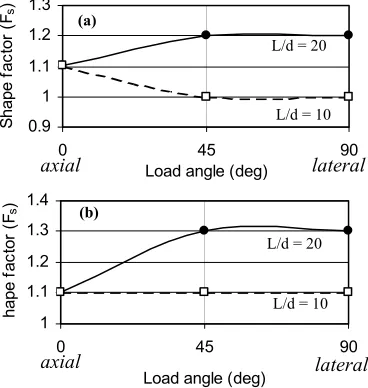
From the numerical results a shape factor (Fs) was calculated. The shape factor is a simple conversion factor allowing the designer to convert from a circular cross-section to square area. The shape factor was determined by dividing the ultimate square bearing capacity by its circular pile counterpart (Qult,square/Qult,circle). This shape ratio was found to be dependent on the angle of loading, the length to diameter ratio and the density of the sand. The final design chart obtained is shown in Figure 9 (a) and (b). A number of cases were used to explore the
[image:5.612.92.289.480.656.2] [image:5.612.332.516.489.683.2]effect of the square cross-section on the a pile capacity. The case scenarios were chosen so that the sensitivity of various geometric and constitutive parameters could be determined. In total 24 models were run for both the square and circular piles. The load-displacement relation for each scenario was obtained allowing the ultimate bearing capacity to be determined. A brief flow table showing the scope of the cases is shown in Figure 8.
where N = blow count, E = Young’s modulus, φ = friction angle, L = length and d = diameter.
Figure 8. Flow chart of numerical cases.
S
Figure 9. a) Shape factor for loose sand. 0.9
1 1.1 1.2 1.3
0 45 90
Load angle (deg)
S
hape f
ac
tor
(
Fs
)
1 1.1 1.2 1.3 1.4
45 90
Load angle (deg)
hape f
ac
tor
(
Fs
)
lateral
(b)
L/d = 10 L/d = 20
0 axial
(a)
axial lateral
L/d = 10 L/d = 20
L = 5, 20 m -axial load -oblique load -lateral load L/d = 10 L/d = 20
N = 30 E = 24 MPa φ = 36 °
L = 5, 20 m -axial load -oblique load -lateral load L/d = 10 L/d = 20 N = 10 E = 8 MPa φ = 30 °
pile cases modelled
The above plots enable designers to use the traditional methods for circular piles and convert across to a square cross-section. This is done by calculating the bearing capacity of a circular pile with the same length, and the length to diameter ratio as the square pile. Using Figure 9 a shape factor (Fs) can be determined which is multiplied into the ultimate circular capacity (Qult,circle) to give the equivalent square capacity (Qult,square) as follows:
Qult,circle * Fs = Qult,square (1).
5. DISCUSSION
One of the interesting observations from numerical study is that shape factor is dependent on the density of the sand. This phenomenon appears to be evident for both the oblique and lateral loading scenarios. One possible reason the above occurs could be due to the failure mechanisms involved. A square pile when placed under an oblique/lateral in-plane load can utilise its flat side enabling it to have higher shaft bearing capacity as opposed to the circular pile. This bearing resistance in the square pile will increase as the density of the sand increases. The circular pile, because of its geometry, allows the sand to flow more readily around it, and therefore the benefits of the increased sand strength would not be as great.
During the development of the numerical models, it became necessary to include the residual self-weight stresses of the system. As the depth of the sand increased so too did the magnitude of the effective stresses. This meant that there were initial stresses in the system, which would affect the constitutive behaviour during the loading sequence. The behaviour of any soil problem is dependent on the stress history of the soil medium.
In the beginning the models were developed without the presence of the initial effective stresses. This meant that the starting normal stress used for the Mohr-Coulomb model was zero, and the cohesion for sand was also zero. Once the load was increased even by the slightest amount it would produce a plastic strain, as Mohr stress circle would be reduced to a single point with no radius. This resulted in an unstable purely plastic response of the pile that was not a realistic solution. The numerical model was unable to obtain a single solution because for each load there is an infinite number of possible
displacements, i.e. convergence was not possible. By modelling the effective stresses in the system this allowed the computer simulation to achieve a converged realistic solution.
6. CONCLUSION
The finite element models used in this paper allowed the investigation into the effect of pile cross-section on its capacity. From this work a rational design chart was developed for cast-in-place square piles. When modelling real systems it is important to include all the major factors attributing to the object’s behaviour. The constitutive parameters, stress history and the interactions between elements are all key aspects to consider. Numerical models can offer a great deal of information when used correctly, and they can provide a platform for developing design procedures for industry.
7. ACKNOWLEDGMENT
The writers of this article would like to thank the staff at high performance computing facility at James Cook University for their support.
8. REFERENCES
Ashour, M. and Norris, G. Modelling lateral pile soil-pile interaction, Journal of Geotechnical Engineering, ASCE, Vol. 126, No. 5, pp420-428, 2000.
Chen, W. & Saleeb, A. Constitutive equations for engineering materials. United States: John Wiley & Sons, Inc, 1983.
Das, B. Principles of foundation engineering, 4th edition, PWS Publishing, Melbourne, 1999.
Hibbitt, Karlsson, & Sorensen, Inc. ABAQUS / standard user manuals. United States (Pawtucket): Hibbitt, Karlsson & Sorensen, Inc, 1998.
Johnson, K., Karunasena, W. and Sivakugan, N. Modelling pile-soil interaction using contact surfaces, Proceedings, First Asian Pacific Congress on Computational Mechanics, Sydney, 375-380, 2001.
Peck, R.B, Hanson, W.E. and Thornburn, T.H.,
Foundation engineering, 2nd edition, John Wiley & Sons, Inc, New York, 1974.
Poulos, H.G & Davis, E.H. Pile foundation analysis and design. Toronto: John Wiley & Sons, Inc, 1980.
Prevost, J.H., & Popescu, R. Constitutive relations for soil materials. Electronic journal of geotechnical engineering.