IDENTIFYING EXEMPLARY SCIENCE TEACHERS THROUGH THEIR
CLASSROOM INTERACTIONS WITH STUDENTS
Bruce G. Waldrip Darrell L. Fisher
ABSTRACT. The purpose of the study described in this paper was to use the Questionnaire on Teacher Interaction (QTI) to identify and describe exemplary science teachers. With a sample of over 493 science students, the reliability of the QTI scales ranged from 0.69-0.87. The exemplary teachers were identified as those whose students’ perceptions were more than one standard deviation above the mean on the scales of Leadership, Helping/Friendly, and Understanding and more than one standard deviation below the mean on the Uncertain, Dissatisfied and Admonishing scales. The construct validity of the QTI to identify these exemplary teachers was confirmed through interviews with students and these views are reported in the article.
KEY WORDS: exemplary teachers, science teachers, student perceptions, teacher-student interactions
1.
I
NTRODUCTIONThe recently released DETYA report The Status and Quality of Teaching and Learning of Science in Australian Schools (Goodrum, Hackling & Rennie, 2001) provides a contemporary, informative and disappointing picture of the current state of science education in Australia:
The actual picture of science teaching and learning is one of great variability but, on average the picture is disappointing. In some primary schools, often science is not taught at all. When it is taught on a regular basis, it is generally student-centred and activity-based, resulting in a high level of student satisfaction. When students move to high school, many experience
disappointment, because the science they are taught is neither relevant nor engaging and does not connect with their interests and experiences. Traditional chalk-and-talk teaching, copying notes, and ‘cookbook’ practical lessons offer little challenge or excitement to students. Disenchantment with science is reflected in the declining numbers of students who take science subjects in the post-compulsory years of schooling. (p. 3)
In another recent study, Foundations for Australia’s Future – Science and Technology in Primary Schools, Stocker (1997, p. 1) stated that “much has been achieved in primary science and technology education over the past ten years but much more needs to be done”. These are but two of a range of studies which, over the last few decades, have described the disappointing state of the teaching of science at all school levels across many countries (e.g. Brown, 1974; Harlen, 1998; Tobin & Fraser, 1988; Yager, Hidayat & Penick, 1988). It is therefore important to investigate what is occurring in science classrooms to provide a focus for improving the situation.
Some researchers in science education have tried to achieve this by identifying and describing the behaviour of very good or exemplary science teachers believing that, if we can do this, the descriptions of what these teachers do might lead to an overall improvement in student outcomes. However, exemplary teachers have been difficult to identify and researchers have found it difficult to describe what is exemplary teaching. Just profiling effective teaching by scoring whether effective practices are present is of little value in that ineffective teachers can also display some of these practices (Cruikshank, 1986). A teacher might be able to display a variety of competencies, but lacks the skills necessary to put these components together, and different teachers might put them together in quite different ways.
A wide variation in the beliefs and practices of teachers has been observed from classroom observations and interviews. Va n den Akker (1998), in describing schools that had productive primary science programs, revealed that these schools had:
learning process; a lot of group work and interaction; teaching involving stimulation and facilitation; increased variety of resources (materials and objects) and experiences; extensive integration of science topics with project-oriented activities over a long period; and a lot of emphasis on process skills for exploration, learning to learn, and attitudinal goals such as curiosity, precision and perseverance. (p. 436)
Other attempts to delineate teacher standards lie in the description of a set of skills and techniques that good teachers embrace in their practice. These standards define, for instance, the skills and knowledge required for teachers to achieve registration, or to be promoted to master teachers. In science teaching, these standards could describe the knowledge of science content, planning and management strategies, assessment processes, or utilisation of science resources.
In an attempt to promote teachers of high quality, professional standards for teachers have been developed by the Standards Council of the Teaching Profession (Standards Council of the Teaching Profession of Victoria, 1996). These standards describe what teachers should display if they are incorporating good components of teaching. They are designed around five generic dimensions of teaching, which are seen as contributing to better teaching:
• professional responsibilities; • content of teaching and learning; • teaching practice;
• assessment and reporting of student learning; • interaction with the school and broader community.
A Western Australian study (Tobin & Fraser, 1988) focused on case studies of classroom practices employed by exemplary teachers. The project was explicitly framed within constructivist principles, which are claimed to lead to greater value being placed on higher-order cognitive learning (Tobin & Fraser, 1990). The project reported considerable diversity in the methods that these teachers used, but nevertheless produced four assertions concerning exemplary science teachers. The assertions were that these teachers used management strategies that facilitated sustained student engagement, used strategies designed to increase student understanding of science, utilised strategies that encouraged students to participate in learning activities, and maintained good interactions with their students through the provision of a favourable classroom learning environment (Tobin & Fraser, 1988, 1990).
Allied to this project, a study by Treagust (1991) of two exemplary biology teachers created a similar list of assertions. Treagust described how the two teachers had rather different styles of structuring the lessons, and how their interactions with and expectations of students related to their personalities and teaching philosophies. Treagust made five assertions to describe what the teachers had in common that characterised the exemplary nature of their practice. The assertions were that these teachers exhibited classroom management and organisation styles that resulted in smooth transitions between one class structure and another, encouraged learning from students of different ability levels, manipulated the social environment to encourage students to engage in academic work, set academic work that had a high level of cognitive demand, and used the laboratory in an inquiry mode and as an integral part of the course.
In each of these studies, one of the behaviours of the exemplary teachers was their favourable
interactions with their students. It was thus decided to build on this past research and focus this study on the identification and description of exemplary science teachers in terms of their teacher-student interactions.
2. T
EACHER-S
TUDENTI
NTERACTIONShave been found to be linked empirically with favourable student outcomes. One particular
development in classroom environment research occurred in The Netherlands where the focus was on the interactions that occurred between teachers and students. Wubbels, Creton and Holvast (1988) investigated teacher behaviour in classrooms from a systems perspective, adapting a theory on communication processes developed by Watzlawick, Beavin and Jackson (1967). Within the systems perspective on communication, it is assumed that the behaviours of participants influence each other mutually. The behaviour of the teacher is influenced by the behaviour of the students and in turn influences student behaviour. Circular communication processes develop which not only consist of behaviour, but determine behaviour as well.
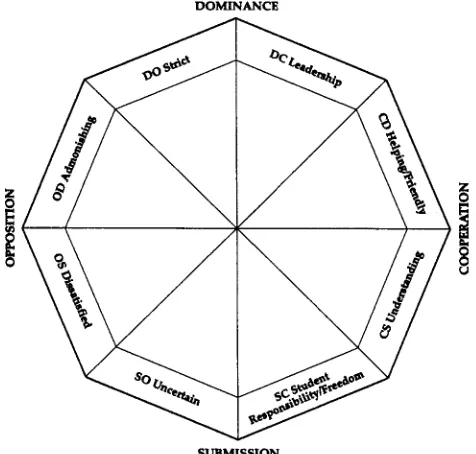
With the systems perspective in mind, Wubbels, Creton and Hooymayers (1985) developed a model to map interpersonal teacher behaviour extrapolated from the work of Leary (1957). The model maps interpersonal behaviour with the aid of an influence dimension (Dominance, D – Submission, S) and a proximity dimension (Cooperation, C – Opposition, O). These dimensions are represented in a coordinate system divided into eight equal sectors. Every instance of interactional teacher behaviour can be placed within this system of axes (Figure 1).
This model has been used in The Netherlands in the development of an instrument, the Questionnaire on Teacher Interaction (QTI), to gather students’ perceptions of their interactions with their teacher (Wubbels & Levy, 1993). The QTI contains eight scales based on the eight parts of the model. Table I presents a description and a sample item of each scale of the QTI.
The QTI is an unusual learning environment instrument in that it is based on a two-dimensional circumplex model for interpersonal behaviour. The circumplex nature of the model means that the interscale correlations are highest between adjacent scales, and lowest and negatively correlated with scales that are opposite. Thus the scales opposite each other in the model describe opposite types of teacher behaviour.
The QTI has been shown to be a valid and reliable instrument when used in The Netherlands (Wubbels & Levy, 1993). When the 64-item USA version of the QTI was used with 1606 students and 66 teachers in the USA, the cross-cultural validity and usefulness of the QTI were confirmed. Using the Cronbach alpha coefficient, Wubbels and Levy (1993) reported acceptable internal consistency reliabilities for the QTI scales ranging from 0.76–0.84 for student responses and from 0.74–0.84 for teacher responses.
[image:3.595.179.417.500.727.2]An initial use of the QTI in The Netherlands involved an investigation of relationships between perceptions on the QTI scales and student learning outcomes (Wubbels, Brekelmans & Hooymayers, 1991). Regarding students’ cognitive and affective outcomes, teachers’ leadership, understanding, and helping/friendly behaviours were associated with better student achievement. Conversely,
admonishing, uncertain and dissatisfied behaviours were related negatively to achievement. Wubbels and Brekelmans (1998) confirmed that student outcomes are indeed related to student perceptions of teacher behaviours. In another study, Wubbels and Levy (1993) claimed that student perceptions of interpersonal teacher behaviour appeared to account for 70% of the variability in student achievement and 55% for attitude outcomes.
An Australian version of the QTI containing 48 items was used in studies involving upper secondary science classes in Western Australia and Tasmania (Fisher, Fraser & Wubbels, 1993; Fisher, Fraser, Wubbels & Brekelmans, 1993; Fisher, Henderson & Fraser, 1995). These studies confirmed the reliability and validity of the QTI and noted that, generally, the dimensions of the QTI were significantly associated with student attitude scores. In particular, students’ attitude scores were higher in classrooms in which students perceived greater leadership, helpful/friendly, and understanding behaviours in their teachers.
In a study of middle secondary science classes, students’ attitude scores were higher in classrooms in which students perceived greater leadership, helping/friendly, and understanding behaviours in their teachers. Females perceived their teachers in a more positive way than did males, and students from an Asian background tended to perceive their teachers more positively than those from the other cultural groups identified in the study (Fisher & Rickards, 1997).
In another study in which the QTI was used in Australia, the perceptions of 490 mathematics students were used. It was found that students developed more positive attitudes towards their mathematics in classes where the teacher showed leadership and helping-friendly behaviour and minimal admonishment of students. Student cognitive gains were least in classes where students perceived that the teacher was dissatisfied and gave them too much freedom and responsibility, and where they were involved in investigations (Rawnsley & Fisher, 1997).
Australia (Fisher, Fraser & Wubbels, 1993; Fisher, Fraser, Wubbels & Brekelmans, 1993; Fisher et al., 1995; Fisher, Rickards & Fraser, 1996; Fisher & Waldrip, 1999). These studies all confirm the validity and usefulness of the QTI.
Generally, higher cognitive outcome scores and attitudinal outcomes are positively associated with leadership, helping, friendly and understanding teacher behaviours, while strict or controlling behaviours are associated with higher cognitive outcomes and to a lesser extent with attitudes (She & Fisher, 2000). Conversely, admonishing, dissatisfied and uncertain teacher behaviours are negatively associated with students’ cognitive and attitudinal outcomes. Therefore, it was decided to investigate the usefulness of the QTI to identify exemplary science teachers, in terms of those who would receive higher scores on the Leadership, Helping/Friendly and Understanding scales and lower scores on the Admonishing, Dissatisfied, and Uncertain scales. The study reported here was concerned with student-teacher interactions in secondary classrooms. The study is distinctive in that it uses the perceptions of students’ interactions with their teachers in the identification of exemplary teachers.
3. M
ETHODSThe aim was to use the QTI to identify and describe exemplary science teachers. These better teachers were identified through their scores on particular scales of the QTI. The suitability of the QTI in this identification process was checked by interviewing the school principals of these teachers. Finally, the construct validity of the QTI to identify exemplary teachers was confirmed through interviews with students.
The study involved a sample of 493 science students and their 25 teachers in 25 Australian secondary school classrooms. These teachers consisted of all science teachers within one administrative area of a private school system. This administrative area was considered by system administrators to be typical of Australian schools. Each student in the sample responded to the QTI and the results for each class were calculated as scores on each scale of the QTI. The exemplary teachers were defined as those whose students’ perceptions were more than one standard deviation above the mean on the scales of Leadership, Helping/Friendly, and Understanding and more than one standard deviation below the mean on the Uncertain, Dissatisfied and Admonishing scales. The authors were interested in establishing a method that was relatively simple for practising teachers and researchers to utilise and that was an alternative to some previous studies that employed a comparison of students’ ideal and actual interpersonal styles (Wubbels et al., 1991).
A number of students from classes that had indicated very positive student-teacher interactions were interviewed to examine why these students had such positive perceptions. The interviews thus examined the veracity of student perceptions. A maximum of two classes within a school were involved in the interview process. From each class, four students were interviewed separately. The students were chosen by the teacher concerned so that a range of ability and interest in science was achieved. The resulting students fell into four groups; high achieving/high interest; high achieving/low interest; struggles academically/high interest; and struggles academically/low interest.
During the interviews, we were interested in further examining the students’ perceptions of the scales that the individual items were measuring. The students were asked questions that explored the
following. “What do they think that item meant?” “Did the concept of each scale appear to be important to them?” “How did they interpret each scale?” “What dis-confirming evidence existed in students’ perceptions for each scale?” “Did the scales reflect characteristics of their best teachers?”
4. R
ESULTS4.1. Instrument Reliability
(Cronbach alpha reliability coefficient) and scale item mean of each of the QTI scales are shown in Table II. The table shows that, when using the individual student as the unit of analysis, the alpha coefficients ranged from 0.69–0.87, confirming that each QTI scale has acceptable reliability, especially for scales containing a relatively small number of items. The sample of classes was too small to use the class mean as the unit of analysis. The scale item means (range 0 to 1) showed that the scales of Leadership,
Helping/Friendly, Understanding, Student Responsibility/Freedom and Strict behaviour had the highest means, while there were lower means for the less desirable scales of Uncertain, Dissatisfied and
Admonishing. Another desirable characteristic of a questionnaire like the QTI is that it is capable of differentiating between perceptions of students in different classes. This was of added importance here because we were interested in whether the QTI could distinguish between the classrooms of exemplary and other teachers. This characteristic was explored using a one-way ANOVA with class membership as the main effect using the individual as the unit of analysis. The results in Table II indicate that each scale differentiated significantly (p < 0.01) between classes. The eta2 statistic, which represents the amount of
variance in
TABLE II
Cronbach Alpha Reliability, Item Mean, Standard Deviation and Ability to Distinguish Between Classes for Each Scale of the QTI
Scale No. of
items
Unit of analysis
Alpha reliability
Scale item mean
Standard deviation
ANOVA results
(eta2)
Leadership 6 Individual 0.82 0.58 0.20 0.36*
Helping/friendly 6 Individual 0.86 0.65 0.23 0.36* Understanding 6 Individual 0.87 0.61 0.22 0.36* Student responsibility/ 6 Individual 0.75 0.54 0.18 0.32* freedom
Uncertain 6 Individual 0.77 0.26 0.17 0.26*
Dissatisfied 6 Individual 0.80 0.29 0.20 0.35* Admonishing 6 Individual 0.84 0.33 0.23 0.42*
Strict 6 Individual 0.69 0.46 0.18 0.17*
N = 493 students and 25 teachers. *p < 0.01.
student-teacher interaction scores accounted for by class membership, ranged from 0.17–0.42.
4.2. Identification of Exemplary Teachers
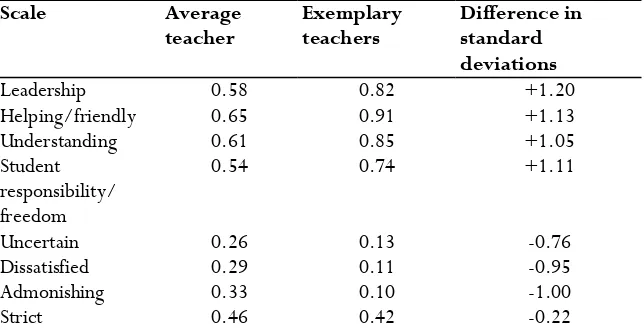
Of the 25 teachers involved in the study, there were five teachers whose students reported interaction scores on the QTI that were quite different from those of the other teachers. We refer to these teachers as the exemplary teachers. It is clear from the results presented in Table III, and depicted in Figure 2, that these teachers did indeed have higher scores (more than one standard deviation above the mean) on the scales of Leadership, Helping/Friendly, and Understanding and lower scores (about one standard deviation below the mean) on the Uncertain, Dissatisfied and Admonishing scales.
In order to check the QTI scores, we discussed the quality of each of these five teachers with their principals. The principals had been told that these teachers were being chosen from classes that had reported very favourable student-teacher interactions. The principals indicated that they were not surprised that these teachers were chosen and that they could understand why these classes were chosen as these teachers were considered to be highly exemplary. As some principals stated:
I can easily understand why you chose these teachers. She/he is my best teacher.
The students really like her and feel that she has empathy with them. He always respects his students and they feel that he wants them to learn.
TABLE III
Mean Scores for Average and Exemplary Teachers and Difference in Standard Deviations for Each Scale of the QTI
Scale Average
teacher Exemplary teachers Difference in standard deviations
Leadership 0.58 0.82 +1.20
Helping/friendly 0.65 0.91 +1.13
Understanding 0.61 0.85 +1.05
Student
responsibility/ 0.54 0.74 +1.11
freedom
Uncertain 0.26 0.13 -0.76
Dissatisfied 0.29 0.11 -0.95
Admonishing 0.33 0.10 -1.00
Strict 0.46 0.42 -0.22
4.3. Student Interviews
As described in the research methods section, four students from each of the five classes that had indicated very positive student-teacher interactions were interviewed to examine why these students had such positive perceptions. The interviews therefore examined the veracity of the students’ perceptions.
Figure 2. Mean scores for average and exemplary teachers for each scale of the QTI.
As discussed earlier, the QTI utilises opposing dimensions and it became apparent in the interviews that the students’ comments reflected these opposing dimensions. Therefore, it was decided to report each pair of opposing dimensions together.
4.3.1. Leadership Versus Uncertain Behaviours
These scales are designed to measure the extent to which teachers make it clear that they know what they are doing in the classroom. When we interviewed the students about the degree of leadership that their teacher displayed, students indicated that they learnt a lot from the teacher and that all course-related material was explained clearly in the class. These students, when asked about how uncertain their teacher was, always emphasised the positive leadership qualities of their teacher:
Student: She knows how to communicate with the kids – explains things really well.
Some teachers can’t communicate with the kids. It’s really hard to teach and to learn. She really does bring it down to our level. She is really friendly.
Interviewer: Does he know what is happening in the classroom?
[image:7.595.138.460.110.275.2]Interviewer: How do you know that he is listening?
Student: She is a pretty good teacher. You can hardly ever get her mad. She comes
in with a positive attitude. Everyone starts. I don’t know what it is. There is something about her that makes everyone want to learn. My science has just skyrocketed because of her. She makes it fun and enjoyable.
Interviewer: Would you want to change teachers?
Student: No. Because she is leaving at the end of this year, I am dropping science for next year. I know that, if I get our male teacher, my marks will go down again.
Student: She is interested in hearing people’s answers and wants to know what they
have to say. Even if they get it right first off, she will ask if anyone has something different. So she is interested in what you have got.
Student: Looks at you in the eye. She has got that way that, when she wants us to listen, she just stops and we know that she wants us to listen. We get told that we have to stop and listen and she acts that way.
Interviewer: Does she know what is happening in the classroom?
Student: Yep. She is fully aware. If some students are talking, she will separate them.
4.3.2. Helping/Friendly Versus Dissatisfied Behaviours
The intent of these scales was to measure the extent to which the teachers helped them and viewed them as being capable students. These students saw that their teacher was very helpful and friendly:
Student: He is like so laid back. He is a good teacher and knows what he is talking about mainly and helps. Like, when he is helping us, he is not talking to us as if we know how to do it and saying we should know. He helps us a lot.
Student: She knows how to communicate with the kids and explains things really well. Some
teachers can’t communicate with the kids. It’s really hard to teach and to learn. She really does bring it down to our level. She is really friendly.
Student: She goes through the question with you and she explains it bit by bit so that you understand what the question is about.
In particular, students saw that their teachers were willing to help them, especially to explain material with which they had difficulty:
Student: He listens to things I have to say. Sometimes he can be mean to kids in the class, which kind of gets on my nerves. He does lots of experiments that I like. He is a pretty fun sort of teacher, but he can get really mean which isn’t kind of nice. He does pretty easy work for those not up to date with everything.
Student: At the start, there used to be a unit like VCE science. She takes us through parts of it. We can do this part now and she explains what’s in them and we choose in which order we want to do them. In assignments, when we did minerals, we got to choose which mineral we wanted to do and pretty well how we wanted to present it.
Student: Helpful, yeah, he’s a very helpful person. We have to come and do an assignment and he’ll
come and work with everybody, answer our questions, and help when it’s needed.
Student: If we’re having trouble, we’ll usually go and ask him. He’ll come up to people and ask if they’re having trouble, how they’re getting started with this and, yeah, he’ll help kids with work that they need to be helped with.
4.3.3. Understanding Versus Admonishing Behaviours
Students in these classes saw that their teachers knew the extent to which their students understood, listened to them and did not become angry quickly:
Student: She is interested in hearing people’s answers and wants to know what they have to say. Even if they get it right first off, she will ask if anyone has something different. So she is interested in what you have got.
back and tell you again and she will have maths help. She does lots of things for us like makes up booklets for us to do when we have spare time. She makes it really fun and games.
Schools that emphasised concepts of ‘caring’ had their students emphasising the view that students and staff did care for each other. Finally, these students emphasised that their contributions in class were valued by the teacher, they were active in the learning process and challenged by their teachers:
Student: Yes, she is always asking people for their opinions even if the other kids don’t think that it is very good. She always tries to understand. She tries to explain to the others in a bit better way than you did, to try and have them understand what you mean.
Student: He would go through it all over again if you say that you don’t understand that bit, especially in physics or all the formulas and stuff. He will write it all up on the board and you will say: “I don’t get it.” And he will go over it and say it all over again.
Student: He makes you feel really comfortable in the class and, if you don’t really understand things, he won’t make you feel embarrassed about it. If you don’t understand it, he won’t get you out the front and explain it.
Student: Yes, she is always asking people for their opinions even if the other kids don’t think that it is very good. She always tries to understand. She tries to explain to the others in a bit better way than you did to try to have them understand what you mean.
Student: If we don’t understand, we know that we’re allowed to ask him questions. So he knows
that, I think, everyone will ask him if they don’t get it.
Student: No, he doesn’t really get angry. He sometimes does when everyone’s talking. A lot of the time, no-one listens to him. The other day, I was just looking around the class and I just noticed the different things that everyone was doing. Like one person was playing with their hair, and the next person was chatting. There were some writing letters to people. There were only like a couple of people listening. Sometimes he just keeps on talking anyway, or sometimes he just stops and yells, and then everyone listens.
Student: I’ve never seen him angry.
4.3.4. Student Responsibility and Freedom Versus Strict Behaviours
Students in the better classrooms felt that they were given some choice in how they approached their learning. Their teachers gave them responsibility and allowed them to make suggestions. The students felt that they were given responsibility:
Student: He gives us lots of choice. Like sometimes we have choices in how to do maths problems.
He gives us problems on the board and gives us all day to solve them. At the end of the day, if we get them right, he will give us rewards like lollies and stuff like that. He understands and lets us use the video camera. He trusts us a lot with that. We look after the bins at school, and take the bins out the front. We have to look after the tuckshop. The principal has to trust us as well.
Student: If we are doing practical work, she lets us do it and she will just watch us. If we are doing something wrong, she will tell us what we are doing wrong.
Interviewer: Does he give you much choice?
Student: Yes, like when we did designs (this house design), we could do what design we wanted but
we had to make sure that it had passive heating and stuff like that.
Student: If we come in to do an assignment, he’ll let us work it out and let us start in our own way sometimes, and just let us try to think things out for ourselves.
Student: Every time that he goes away, he trusts us to be good with the other teacher. And he trusts us when we’re using chemicals and all that.
Student: Once, when he was away one lesson, he left these books and equipment, and he made this
The concept of strict was somewhat relative. When students were pressed to indicate whether they preferred more or less strict behaviour, students expressed the status quo or for their teachers to be slightly more strict. They felt that teachers becoming less strict would provide a negative effect on learning. They saw that the present level of strict behaviour was fair and essential for learning:
Interviewer: If you had to choose between being more or less strict, what would you choose? Student: Probably more strict. In physics, because that is his main subject, he is
probably more strict and pushes it a bit more. He probably doesn’t push chemistry as much, and this is the hardest. So, I think, more strict in certain areas.
Student She is not so strict that people don’t really like her. Kids can get really annoyed at that. She does have discipline.
Interviewer: If you had to choose between being more or less strict, what would be your choice?
Student: More strict. We would learn more. She is good as she is.
When they were asked to suggest how their teachers could improve their teaching, the students struggled to provide an answer for this question. Students from one class suggested that they would like more challenges than they were currently having. Another request was for more opportunity for student-student discussion of issues. These students do enjoy their science lessons. All these students made the point that they were involved in the science learning process:
Interviewer If you had to choose between more or less strict, what would you choose?
Student: Sometimes he is strict in the way of saying to do this and to get it done by
then. Then we don’t know how to do it and sometimes he is not strict. It just depends on what we are doing. In a way, yes probably.\
Interviewer How would it help you if he was more strict?
Student: I think that we would be taught not as freely and taught more about what
we are learning.
Even when they were pushed to state what faults their teacher had, students tended to struggle to identify any:
Student: Tell him his faults. Um, I can’t really see any, other than, I don’t know, I just think that I don’t really like science. But he is a good teacher.
5. D
ISCUSSIONThis article has provided further evidence supporting the validity of the QTI, which assesses eight scales of teacher interactions with secondary school students. The Cronbach alpha reliability coefficient for each scale ranged between the acceptable values of 0.69 and 0.87. Additionally, the QTI’s ability to distinguish between classes was confirmed, and this was an important attribute for this study.
It was found that exemplary teachers could be identified through the perceptions of their students on the scales of the QTI. The exemplary teachers were those whose students’ perceptions were more than one standard deviation above the mean on the scales of Leadership, Helping/Friendly, and Understanding and about one standard deviation below the mean on the Uncertain, Dissatisfied and Admonishing scales.
Student No. I would reckon that she is the best science teacher. Out of all the others, she is easy to understand. She helps you with everything. Some teachers don’t want to help you if you have problems.
Interviewer: Would you want to change her?
Student: No. Because she is leaving at the end of this year, I am dropping science
for next year. I know that, if I get our male teacher, my marks will go down again.
It is apparent from these interviews that these exemplary teachers tried to interest students in the learning process, understood the needs of their students in the learning process, were friendly, gave students responsibility, and had a level of strict behaviour with which students were comfortable and which students felt was conducive to their learning.
R
EFERENCESBrown, S. A. (1974). Scottish science teachers’ perceptions of effective science teaching. The British Journal of Educational Psychology, 44, 57–64.
Cruikshank, D. R. (1986). Profile of effective teacher. Educational Horizons, 64(2), 80– 86.
Fisher, D., Fraser, B., & Wubbels, T. (1993). Interpersonal teacher behavior and school environment. In T. Wubbels & J. Levy (Eds.), Do you know what you look like?: Interpersonal relationships in education (pp. 103–112). London: Falmer Press.
Fisher, D., Fraser, B., Wubbels, T., & Brekelmans, M. (1993). Associations between school learning environment and teacher interpersonal behaviour in the classroom. In D. Fisher (Ed.), The study of learning environments, Volume 7 (pp. 32–41). Perth, Australia: Science and Mathematics Education Centre, Curtin University of Technology.
Fisher, D., Henderson, D., & Fraser, B. (1995). Interpersonal behaviour in senior high school biology classes. Research in Science Education, 25(2), 125–133.
Fisher, D., & Rickards, T. (1997). Cultural and gender differences in teacher-student interpersonal behaviour in science classrooms. In D. Fisher & T. Rickards (Eds.), Science, mathematics and technology education and national development (Proceedings of the International Conference on Science, Mathematics and Technology Education, Hanoi, Vietnam) (pp. 1–9). Perth, Australia: Curtin University of
Technology.
Fisher, D., Rickards, T., & Fraser, B. J. (1996). Assessing teacher-student interpersonal relationships in science classes. Australian Science Teachers Journal, 42(3), 28–33.
Fisher, D. L., & Waldrip, B. G. (1999). Cultural factors of science classroom learning environments, teacher-student interactions and student outcomes. Journal of Science Education and Technology, 17(1), 83– 96.
Fraser, B. J. (1998). Science learning environments: Assessment, effects and determinants. In B. J. Fraser & K. G. Tobin (Eds.), The international handbook of science education (pp. 527–564). Dordrecht, The Netherlands: Kluwer.
Fraser, B., & Walberg, H. (Eds.). (1991). Educational environments: Evaluation, antecedents and consequences. Oxford, UK: Pergamon.
Goodrum, D., Hackling, M., & Rennie, L. (2001). The status and quality of teaching and learning of science in Australian schools. Canberra, Australia: Department of Education, Training and Youth Affairs.
Harlen, W. (1998). Teaching for understanding in pre-service science. In B. J. Fraser & K. G. Tobin (Eds.), International handbook of science education (pp. 183–198). Dordrecht, The Netherlands: Kluwer. Leary, T. (1957). An interpersonal diagnosis of personality. New York: Ronald Press Company.
Rawnsley, D., & Fisher, D. L. (1997, January). Using personal and class forms of a learning environment questionnaire in mathematics classrooms. In D. Fisher & T. Rickards (Eds.), Science, mathematics and technology education and national development (Proceedings of the International Conference on Science, Mathematics and Technology Education, Hanoi, Vietnam) (pp. 52–63). Perth, Australia: Curtin University of Technology.
She, H., & Fisher, D. (2000). The development of a questionnaire to describe science teacher communication behavior in Taiwan and Australia. Science Education, 84, 706– 726.
Melbourne, Australia: Author.
Stocker, J. (1997). Foundations for Australia’s future: Science and technology in primary schools. Canberra, Australia: Australian Government Publishing Service.
Tobin, K., & Fraser, B .J. (1988). Investigations of exemplary practice in high school science and mathematics. Australian Journal of Education, 32(1), 75–94.
Tobin, K., & Fraser, B. J. (1990). What does it mean to be an exemplary teacher? Journal of Research in Science Teaching, 27, 3–25.
Treagust, D. F. (1991). A case study of two exemplary biology teachers. Journal of Research in Science Teaching, 28, 329–342.
van den Akker, J. (1998). The science curriculum: Between ideals and outcomes. In B. J. Fraser & K. G. Tobin (Eds.), The international handbook of science education (pp. 421–448). Dordrecht, The
Netherlands: Kluwer.
Watzlawick, P., Beavin, J., & Jackson, D. (1967). The pragmatics of human communication. New York: Norton.
Wubbels, T., & Brekelmans, M. (1998). The teacher factor in the social climate of the classroom. In B. J. Fraser & K. G. Tobin (Eds.), The international handbook of science education (pp. 565–580). Dordrecht, The Netherlands: Kluwer.
Wubbels, T., Brekelmans, M., & Hooymayers, H. (1991). Interpersonal teacher behaviour in the classroom. In B. J. Fraser & H. J. Walberg (Eds.), Educational environments: Evaluation, antecedents and consequences (pp. 141–160). Oxford, England: Pergamon.
Wubbels, T., Creton, H. A., & Holvast, A. (1988). Undesirable classroom situations. Interchange, 19(2), 25–40.
Wubbels, T., Creton, H., & Hooymayers, H. (1985, April). Discipline problems of beginning teachers. Paper presented at the annual meeting of the American Educational Research Association, Chicago. Wubbels, T., & Levy, J. (Eds.). (1993). Do you know what you look like?: Interpersonal relationships in education. London: Falmer Press.
Yager, R. E., Hidayat, E. M., & Penick, J. E. (1988). Features which separate least effective from most effective science teachers. Journal of Research in Science Teaching, 25, 165–177.
BRUCE G. WALDRIP DARRELL L. FISHER Faculty of Education Science and Mathematics The University of Southern Queensland Education Centre
West Street, Toowoomba Qld 4350 Curtin University of Technology Australia Kent Street, Bentley WA 6102 E-mail: waldrip@usq.edu.au Australia
E-mail: d.fisher@curtin.edu.au
![[18F]FE@SNAP—a specific PET tracer for melanin-concentrating hormone receptor 1 imaging?](data:image/gif;base64,R0lGODlhAQABAIAAAP///wAAACH5BAEAAAAALAAAAAABAAEAAAICRAEAOw==)