Complete Citation: Sabburg, J. and Parisi, Alfio and Wong, J. C. F. (2001). Effect of cloud on UVA and exposure to humans. Photochemistry and Photobiology, 74 (3), 412-416. ISSN 0031-8655. Accessed from USQ ePrints http://eprints.usq.edu.au
Effect of cloud on UVA and exposure to humans
J. Sabburg1, 2,* , A.V. Parisi2 and J. Wong1
1
Centre for Medical and Health Physics, Queensland University of Technology, Australia.
2
Centre for Astronomy and Atmospheric Research, University of Southern Queensland,
Australia.
*National UV Monitoring Center, Department of Physics & Astronomy,
University of Georgia, Athens, GA, 30602, U.S.A.
Phone: 706-542-2127
Fax: 706-542-2492
e-mail: [email protected].
Keywords: UVA, cloud, exposure, humans, solar, radiation.
Abbreviations: AOD, aerosol optical depth; FOV, field of view; SZA, solar zenith angle; VIR, visible-infrared; UVA, 320-400 nm; UVB, 280-320 nm
*
ABSTRACT
The daily autumn and winter UVA exposures and 6-minute UVA irradiance data for a
Southern Hemisphere, subtropical site (Toowoomba, Australia, 27.6°S, 151.9°E) are presented.
This data is used to quantify the effect of cloud on UVA using an integrated sky-camera and
radiation system. Additionally, an estimate of the effect of enhanced UVA exposure on humans is
made. The measurement system consisted of broadband visible-infrared and UVA sensors
together with a sun tracking, wide-angle video camera. The mean daily June exposure was found
to be 409 kJm-2. Under the constraints of the uncertainty of both the UVA measurement system
and clear-sky model, one case of enhanced UVA irradiance was found. Three cases of cloud
enhancement of daily UVA exposure, approaching clear-sky levels, were also determined using a
calculated clear-sky envelope. It was also determined that for a fulltime outdoor worker, the
additional UVA exposure could approach approximately that of one third of a full winter’s day.
For indoor workers with an outside lunch break of noon to 1 pm, the additional UVA exposure
was on average 6.9 kJm-2 over three cloud enhanced days. To the authors’ knowledge this is the
INTRODUCTION
There has been a renewed interest in the effect of ultraviolet-A (UVA, 320 to 400 nm) radiation on
humans as researchers have measured alterations in human skin indicating tissue damage due to
UVA exposure (1). Additionally, it has been shown that irreversible premature skin photoaging
and sagging results from UVA exposure (2) and that the position of the sun in the sky is more
important when considering UVA compared to UVB (3).
The objectives of this present paper are to (a) present the 6 minute UVA irradiance and daily UVA
exposures for a Southern Hemisphere, subtropical site during the seasons of autumn and winter;
(b) quantify the effect of cloud on UVA using an integrated sky-camera and radiation system (4);
and (c) estimate the effect of enhanced UVA exposures to clear-sky conditions on humans.
An earlier research study measured the daily, ambient UVA in Glasgow (55.9oN) using a UVA
broad band detector and a spectroradiometer (5). They found that large variation of UVA occurred
in successive readings, usually relating to cloud movement, however, no cases of UVA
enhancement were discussed. The effect of solar obstruction by cloud on variations of daily,
ambient UVA has also been investigated at the high mountain station Jungfraujoch (46.55oN,
3576 m altitude) (6). Measurements of UVA were made during 16 periods of six to eight weeks by
means of an Eppley UVA radiometer. The amount of cloudiness, the range of altitude of clouds
(middle and high) and the screening of the sun by clouds (sun free, sun totally blocked), were
visually observed at 30 minute intervals according to standard meteorological practice. They also
the sun, the influence of cloudiness on the radiation was practically zero, regardless of the degree
of cloud cover.
MATERIALS AND METHODS
The integrated radiation / sky-camera system was situated at the campus of the University of
Southern Queensland (USQ), Toowoomba, Australia (27.6°S, 151.9°E, 696 m altitude). This
location was chosen because of relatively unpolluted rural skies.
Radiation measurement. Three broadband radiation sensors: visible-infrared (VIR, 400 to 950
nm), UVA (320 to 400 nm) and UVB (not used for the present research) were connected to a
commercial data-logger (Figure 1).
<Figure 1>
The VIR sensor was supplied ‘off-the-shelf’ along with the data-logger (Monitor Sensors,
Caboolture Qld) and Monitor Sensors, using specified design criteria, manufactured the UVA
sensor using a gallium arsenide material. The response of the UVA detector is half that of the
maximum response at 315 and 395 nm. The radiation sensors produced a square wave output
whose frequency increased with solar irradiance. Each sensor included a diffuser and broadband
filter (supplied by Davis UV, Sydney). The filter was selected to give the required spectral
response of the sensor. The area beneath the filter was ‘matt blacked’ to reduce re-radiation back
The frequency output of the radiation sensors was converted to digital counts by the
data-logger. The counts, together with the date and time, were transmitted to a controlling computer
at 6 minute intervals via an RS232 interface. These counts represented six-minute averages of
radiation. For the UVA sensor, Sabburg (4) describes the calibration process, traceable to the
Australian standard lamp housed at the National Measurement Laboratory, to produce an
accuracy range of ± 13 to ± 17% dependent on solar zenith angle (SZA).
The VIR irradiance data was used during digital image processing to assist with image
thresholding, additionally, this data was used in the selection process of clear-days for the
second method.
Measurement of sky properties. Figure 2 shows thesky-camera system that comprised a colour
video camera (ISSCO, 1997, Sydney NSW) and a stepper motor driver (ARC, 1995, Texas
USA).
<Figure 2>
The camera was constructed from a charged-coupled device as the image sensor. A wide-angle
lens with a 116.5° field of view (FOV) was attached (Computar, H2616FICS). The camera
transmitted a composite video signal via a 75 Ω coaxial cable to a frame grabber card (Digital
Vision, 1992, Dedham USA), located in a control computer. Three graphical interface format
occurring every 6 minutes. The resolution of the GIF images was 200 x 320 pixel (7).
The image analysis system was accessed off-line via an ethernet connection to the control
computer. It consisted of a computer (SPARC1000E) running analysis software in batch mode.
This software was written in MATLAB using the image processing toolbox (The MathWorks,
Inc., 1995, Natick, Mass. USA). The sky properties of cloud cover (percent of FOV), solar
disk obstruction (not, partially or totally obscured) and solar disk visibility (relative to an
unobscured solar disk), were automatically inferred from the sky images to an estimated
accuracy of ± 19.9 to 29.9%, dependent on SZA, ± 16.4%, and ± 5% respectively (4).
Calculation of daily totals, averages and clear days. The integrated sky-camera and radiation
system was primarily designed to record radiation and sky property data every 6 minutes between
9 am and 3 pm local time. To convert this data into daily data, the available UVA data was
integrated and converted to units of kJm-2. The sky property data were measured in the FOV of the
sky-camera, i.e. cloud cover, disk obstruction and visibility, and were averaged to give a general
indication of these daily properties. Cloud cover values ranged from 100 to 0%, disk obstruction
was recorded as 0 for not obscured, 0.5 partially and 1 corresponding to total obstruction.
Visibility was recorded between the values of 0 to 1 corresponding to total visibility and total
opacity respectively.
In order to determine whether cloud or aerosols (e.g. haze), had caused cases of UVA
enhancement, i.e. UVA levels above that of a corresponding clear day, suitable clear-sky
to distinguish the separate effects of cloud and aerosol in this current research and that it was
assumed that aerosol content remained the same for both clear and cloudy skies.
The first method relied on clear-sky UVA model calculations, using TOMS daily ozone data as
one input to the model (8). The aerosol optical depth (AOD) was based on a visibility of 15 km
and fixed for all days (4). It was recently estimated that the model uncertainty was less than ± 10%
by comparison of the model to radiative transfer theory.
To provide an alternative to using a fixed approximation of the AOD, a second method was used,
based on a combination of daily TOMS reflectivity, ground-based sky-camera and VIR
measurements, which by nature of it being a measurement and not a model, inherently included
daily variation of aerosols. By including more than one type of measurement it was possible to
compliment each measurement uncertainty. For example, it has been suggested (9) that TOMS
reflectivity, although having an overpass time of around 11:15 am (local time), is indicative of the
daily average cloud cover at the site. However, there is the possibility of cloud occurring prior to
11:15 am or during the remainder of the day, or light textured cloud/haze being undetected. In the
case of the sky-camera, although the daily measurement time was more extensive than for TOMS,
the FOV of the camera was limited, thus possibly missing cloud at large SZA (4). Finally, the
trend in the VIR sensor data was used as a quality assurance check. This longer wavelength data
has been shown (6) to have a considerably greater effect from cloudiness compared to UV
wavelengths. For this method a clear day was defined as a day for which the TOMS reflectivity
data was less than 3%, and the average cloud cover (as measured by the sky-camera) was less than
data (i.e. the absolute difference between the maximum and minimum of the clear sky
measurements), remaining after meeting the above criterion was ± 5.5%. The variation of this
data, based on 132 days, was suitably represented by a quadratic equation with an r2 of 0.994:
y = 0.0456*x2- 26.604*x + 4352.6 (1)
where y is the daily integrated UVA and x is the day number starting from March 1st 1998.
RESULTS
UVA irradiance and exposure data
Figure 3 presents a graph of 6-minute UVA irradiance data and corresponding
clear-sky modeled data at Toowoomba during autumn and winter 1998 versus SZA. The effect of
daily changes of ozone, input to the model, is apparent by the variation of the thickness of the
model data with changing SZA. The model data has been presented with error bars of the
maximum uncertainty of the model, namely ± 10%, although this uncertainty would be less for
smaller SZA. To improve the clarity of presentation, the measured irradiance data points have
not been presented with their respective uncertainty error bars (± 13 to 17%). Irradiance data
points that appear in the region constrained by the model error bars are considered to
correspond to measurements under clear-skies, or in some cases may correspond to cloudy
skies where UVA enhancement to clear-sky conditions have occurred (4). In the case of the
13% has been included to highlight that this data point is almost certainly a case of UVA
enhancement above normal clear-sky conditions. The measurement was recorded at 12:17 pm
on 21st April 1998, with a UVA ratio of 1.25 with respect to the clear-sky model. The sky was
93.5% covered in cloud and light textured cloud or haze obscured the sun. Figure 4 is a
sky-camera image corresponding to this data point.
<Figure 3>
<Figure 4>
The time-series graph of the daily-integrated UVA levels at Toowoomba during autumn and
winter 1998 is presented in Figure 5. Only days with a complete set of 6 minute UVA data
during 9 am to 3 pm are shown. The two lines are the clear-sky envelopes, method 1 and
method 2, discussed in the last section. In the case of the model (method 1), the error bars have
been set at ± 10%, and to assist in clarity of presentation, the error bars are only shown for the
five labeled data points. In the case of Equation (1) (method 2), the error bars have been set at
± 5.5%. The measured UVA exposure values have been displayed with a ± 17% error bar,
corresponding to the maximum error range of the UVA detector.
The day-by-day variation of UVA can be readily seen with data points, whose top error bars
lie below the bottom error bar of the lowest clear-sky envelope, corresponding to cloudy skies
with solar obstruction by cloud. No cases of UVA exposures can be seen above the upper error
bars of the model, thus suggesting that there were no cases of UVA exposure enhancement
second clear-sky envelope, and thus, if clouds are found to exist in the corresponding
sky-camera images, these cases may be possible examples of cloud enhanced UVA exposure to
expected clear-sky levels. This would be supported, at least in part, by the fact that the TOMS
reflectivity threshold of less than 3%, used to establish this clear-sky envelope, would not be
expected to result in cloudy days.
<Figure 5>
Enhanced UVA exposure data
On manual inspection of the sky-camera images corresponding to the five data points
identified as possible cases of cloud enhancement, clouds were not distinguishable for data
points (3 and 5), but were noticeable in a number of images corresponding to data points (1, 2
and 4). Therefore it was not possible to classify points (3 and 5) as cloud enhanced, however,
it was also not possible to conclude that these days were indeed totally clear-sky.
The sky images shown in Figure 6 represent typical cloudy sky conditions throughout
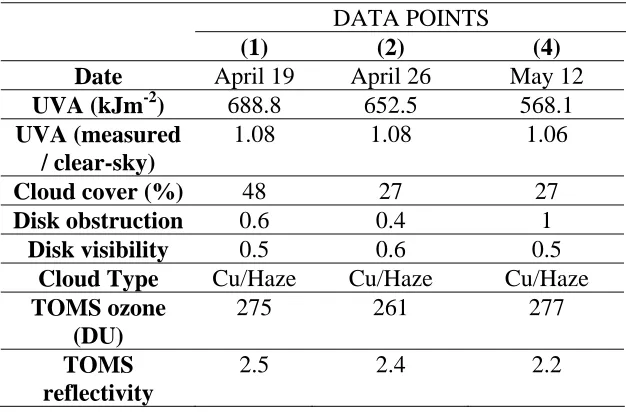
most of the day corresponding to data points (1, 2 and 4) of Figure 5. Image (a),
corresponding to data point (1), was taken at 11:59 am local time on April 19, (b) was taken at
12:29 pm on April 26 corresponding to data point (2), and (c) was taken at 11:23 am on May
12 corresponding to data point (4). Table 1 summarizes the radiation and sky conditions
<Figure 6>
<Table 1>
Of the 154 days of data recorded during April to the end of August 1998, 132 days of
these were quality UVA data corresponding to available sky images. Of these 132 days
(including clear and cloudy conditions), 42% were recorded with daily-integrated UVA levels
in the range of the error bars of the 2nd clear-sky envelope (method 2, based on a combination
of measurements) as displayed in Figure 5 (i.e. ± 5.5%). Of these days, 73% corresponded to
cases of total solar obstruction, as measured by the sky camera, for most of the day (including
light-textured cloud/haze), with cloud cover ranging from 100 to 6% and disk visibility of 1 to
0.42. Normally, based on just TOMS reflectivity measurements alone, most of these days
would be classified as cloud-less skies with no solar obstruction. This would suggest, and can
be seen from the range of the error bars corresponding to these data points, that only 27% were
likely to correspond to actual clear-sky days determined from the sky camera.
Human UVA Exposures
The scenario of outdoor workers who are outdoors all day was now considered.
The total UVA exposure above that of the 2nd clear-sky envelope (method 2), for all
five of the days in Figure 5 with a measured / clear-sky ratio greater than
one, was a total of 197 kJm-2. This corresponds to approximately 0.4 of a full winter’s day
additional UVA exposure on a horizontal plane to humans.
total of 134.6 kJm-2 above the 2nd clear-sky envelope. This corresponds to an additional UVA
exposure to humans, on a horizontal plane, of approximately one third of a full winter’s day
exposure due to possible cloud enhancement to clear-sky conditions. For the scenario of
indoor workers who are outdoors during a lunch break of noon to 1 pm, the additional UVA
exposure on a horizontal plane, which would not be present if the clouds were distributed in a
different way to cause a decrease in UVA irradiance, is 8.9, 6.1and 5.6 kJm-2 respectively for
each of day 1, 2 and 4.
DISCUSSION
The 6 minute UVA irradiance and daily UVA exposures for a Southern Hemisphere,
subtropical site have been presented during the seasons of autumn and winter. The daily variation
of UVA has been presented and the variation has been shown to relate to cloudy skies, as for (4, 5,
6), and with solar obstruction by cloud, as for (6). The mean daily June exposure was 409 kJm-2,
which is approximately ten times the corresponding value for the winter month of December in
the Northern Hemisphere reported in Glasgow (5).
It has been shown that the effect of cloud on UVA, as measured using an integrated
sky-camera and radiation system incorporating maximum error ranges, can lead to cloud enhancement
approaching 25 ± 23%. This finding is based on a 6 minute irradiance data point using a clear-sky
model as the reference. It was also found that 4% of the available UVA exposure data were
possible candidates of cloud enhanced UVA to clear-sky values, in which it was found that haze,
of the sun. This unexpected solar obstruction by cloud and haze producing UV enhancement was
also reported for UVB (10).
Finally, an estimate of the effect of cloud enhanced UVA exposure on humans has
been made. For the fulltime outdoor worker, additional UVA exposure could approach
approximately one third of a full winter’s day exposure. For indoor workers with an outside
lunch break of noon to 1 pm, the additional UVA exposure was on average 6.9 kJm-2 over the
Acknowledgments--This work has been supported in part by QUT and USQ Physics staff who
played a vital role in establishing the instrumentation used for this study. TOMS data was
REFERENCES
1. Lavker, R.M., D.A. Veries, C.J. Irwin, and K.H. Kaidbey (1995) Quantitive assessment of
cumulative damage from repetitive exposures to suberythemogenic doses of UVA in
human skin. Photochem Photobiol, 62, 348-352.
2. Bissett, D.L., D.P. Hannon, J.F. McBride, and L.F. Patrick (1992) Photoaging of skin by
UVA. In Biological Responses to Ultraviolet A Radiation, ed. F. Urbach, 181-188,
Valdenmar Publishing Co., Kansas.
3. Blumthaler, M., J. Grobner, M. Huber, and W. Ambach (1996) Measuring spectral and
spatial, variations of UV-A and UV-B sky radiance. Geophys Res Ltrs, 23, 547-550.
4. Sabburg, J. (2000) Quantification of cloud around the sun and its correlation to global UV
measurement. PhD thesis, Queensland University of Technology, Brisbane, Australia.
5. Moseley, H., M. Davison, and R. M. MacKie (1983) Measurement of daylight UVA in
Glasgow. Phys Med Biol, 28, 589-597.
6. Blumthaler, M., W. Ambach, and M. Salzgeber (1994) Effects of Cloudiness on Global and
7. Sabburg, J. and J. Wong (1999) Evaluation of a sky camera for use in radiation
measurement, J. of Atmospheric and Oceanic Technology, 16, 752-759.
8. Rundel, R. (1986) Computation of Spectral Distribution and Intensity of Solar UV-B
Radiation: in 'Stratospheric Ozone Reduction, Solar Ultraviolet Radiation and Plant Life’. ed.
R.C. Worrest, M.M. Caldwell, Springer-Verlag, Berlin.
9. Udelhofen, P.M., P. Gies, C. Roy, and W.J. Randel (1999) Surface UV radiation over
Australia, 1979-1992: Effects of ozone and cloud cover changes on variations of UV radiation,
J. Geophys. Res. 104, 19135-19159.
10. Sabburg, J. and J. Wong (2000) The effect of clouds on enhancing UVB irradiance at the
earth’s surface: a one year study. Geophys Res Ltrs, 27, 3337-3340.
Table 1. Summary of UVA, sky properties and TOMS data for the possible cases of UVA enhancement to clear-sky conditions, based on the 2nd clear-sky envelope.
DATA POINTS
(1) (2) (4) Date April 19 April 26 May 12
UVA (kJm-2) 688.8 652.5 568.1
UVA (measured / clear-sky)
1.08 1.08 1.06
Cloud cover (%) 48 27 27
Disk obstruction 0.6 0.4 1
Disk visibility 0.5 0.6 0.5
Cloud Type Cu/Haze Cu/Haze Cu/Haze
TOMS ozone (DU)
275 261 277
TOMS reflectivity
FIGURE LEGENDS
Figure 1. The radiation measurement system with the VIR and UVA sensors (from left to right). The view is looking Southwest.
Figure 2. The sky-camera system with the power supply for the camera and cooling system housed in the adjacent semi-weather proof box (bottom-right). The view is looking South. The
radiation sensors were situated to the right of the camera, out of view of the picture.
Figure 3. Graph of 6-minute UVA irradiance data (♥) and corresponding clear-sky modeled data (μ) at Toowoomba during autumn and winter 1998 versus SZA. The model data includes
variation of daily ozone and contains error bars of length ± 10%, and one measured UVA data
point has an error bar of length ± 13%.
Figure 4. A sky-camera image corresponding to the UVA data point with the error bars shown in Figure 3. The UVA ratio was 1.25. The image was taken at 12:17 pm on 21st April 1998.
The sky was 93.5% covered in cloud and light textured cloud or haze obscured the sun.
Figure 5. Daily integrated UVA exposure (λ) at Toowoomba during autumn and winter 1998. The top line (---) is the clear-sky model envelope (method 1) with ± 10% error bars for the
five numbered data points (υ). The lower line (––––) is the clear-sky calculated envelope
(method 2) with ± 5.5% error bars for all data ponts. The numbered data points refer to days
when the UVA exposure exceeded the error bars of the lower clear-sky envelope (method 2).
Figure 6. Example sky-camera images corresponding to the numbered data points of Figure 5. Image (a) was taken at 11:59 am local time on April 19 corresponding to (1), (b) was taken at
12:29 pm April 26 corresponding to (2), and (c) was taken at 11:23 am May 12 corresponding
(a)
(b)
(c)