ERRORS IN DETERMINING BROADBAND ULTRAVIOLET
IRRADIANCES FROM SPECTRAL MEASUREMENTS
A.V. Parisi1*, J.C.F. Wong2, M.G. Kimlin1 and L.R. Meldrum1
1
Centre for Astronomy and Atmospheric Research, University of Southern Queensland, Toowoomba, 4350, Australia. Ph: 07 46 312226. FAX: 07 46 312721. Email:
parisi@usq.edu.au
2
Centre for Medical and Health Physics, Queensland University of Technology, GPO Box 2434, Brisbane 4001, Australia. Ph: 07 38642585. FAX: 07 38641521.
(*To whom correspondence should be addressed.)
Abstract
The errors in determining the biologically effective and broadband UV irradiances from spectroradiometer measurements depend critically on procedures employed in the calibration process. A series of intercomparisons of two calibration standards and a spectroradiometer were undertaken in two laboratories. The near UV (320-400 nm) and shorter wavelength (280-320 nm) waveband irradiances of one standard obtained employing the other lamp for calibration agreed to within 3% and the erythemal irradiances agreed to within 5 to 6%. This was also the case if the lamps were swapped. There was no significant drift with time over five weeks in the measured standard lamp output. The variation of the spectroradiometer calibration during this period was less than 6%. It was observed that the calibration of the spectroradiometer varied by about 10% per degree of the temperature change in the temperature range between 22 and 25oC.
INTRODUCTION
The effectiveness of ultraviolet (UV) radiation for the production of a particular photobiological effect is dependent on the wavelength with the biologically effective irradiance (UVBE) defined as:
(1)
∫
= uv d A SUVBE (λ) (λ) λ
where S(λ) is the spectral irradiance and A(λ) is the action spectrum for a particular photobiological process. Spectral measurements of solar UV radiation and artificial UV sources are necessary for calculation of the biologically effective radiation and a number of papers have reported these measurements (for example, 1-4). Additionally, spectral measurements are generally employed for the calibration of broadband UV meters and UV dosimeters. It is necessary to calibrate broadband UV meters and dosimeters against spectroradiometers for the spectrum they will measure (5). UV radiometers are generally provided with a calibration certificate from the supplier. These calibrations should be verified for the source to be measured (6). Spectral measurements in the UV waveband are a demanding task requiring both a high and consistent level of quality assurance and control. Accurate measurements of the UV spectral irradiance require a spectroradiometer with the minimum equipment of entrance optics with a diffuser or integrating sphere, monochromator, detector, amplifier and a control and acquisition unit (7). A comprehensive description of spectroradiometry is provided by Kostkowski (8). The system must have (5):
• High wavelength resolution of usually 1 nm, wavelength precision of the order of
±0.1 nm and wavelength repeatability of the order of ±0.02 nm;
• Sensitivity of about 0.1 μW cm-2 at 300 nm;
• Stray light level of the order of 10-8 at 285 nm;
• Stable detector;
• Integrating sphere or suitable diffuser to reduce the cosine error;
• Fast automatic scans with a scan time of 1 to 2 minutes from 280 to 400 nm.
In addition to the above requirements, spectroradiometers must be calibrated against a standard lamp with calibration traceable to the National standard. A number of intercomparisons of systems employed in research measuring solar UV irradiances have been performed to determine the magnitude of inherent uncertainties within specific systems. These have been performed both in the laboratory (9) and in the field (2,7,10). These intercomparisons are required to assure the absolute and relative comparison of results. Although, these intercomparisons compare the entire spectroradiometer system, very little research has been performed on the errors due to the standards against which these systems are calibrated. Webb et al. (9) compared spectral irradiances of three standards against their calibration certificates and Wong et al. (5) have established the errors in the calibration of broadband UV meters and dosimeters against spectroradiometers. No previous research has determined the errors due to the standard lamps employed in the field and the errors due to drift with time in these standards. This current paper estimates the resulting errors in determining broadband irradiances using the data of spectral measurements.
MATERIALS AND METHODS
Standards
black on the inside. In this paper the lamps will be referred to as S1 and S2. The lamp housings were approximately 220 mm long and 150 mm diameter for S1 and approximately 205 mm long and 158 mm diameter for S2. The lamp filament is close to the centre of the housing and the lamp and cylinder axes are parallel. An opening of 39 mm x 38 mm for S1 and 50 mm x 50 mm for S2 on the wall of the cylinder opposite the filament provides the exit point for the radiation. The lamps have marked negative and positive terminals and they are always operated at the same polarity and the same orientation of the lamp. Both lamps were powered by 9.5 A from a constant current power supply (Kenwood PD35-20D, Kenwood Co., Tokyo, Japan) with current regulation to 5 mA. One end of the lamp cylinders contains a socket for connection of a flexible air pipe of approximately 50 mm diameter connected to an air blower for creation of an artificial draft for ventilation of the lamp and the opposite end has a vent that acts as a light baffle.
The lamp to spectroradiometer distance was measured from the plane of the lamp filament to the top of the opening on the integrating sphere. This distance was set to 15 cm with an error of approximately ±0.05 cm. Both lamps had been calibrated with absolute irradiances at each 5 nm within the previous four months with the Australian standard lamp at the National Measurement Laboratory, CSIRO, Lindfield.
The spectroradiometer employed in this research utilized a double holographic grating UV monochromator (model DH10, Jobin-Yvon Co., France) connected to a R212 photomultiplier (Hamamatsu Co., Japan) operated at 500 V. The gratings were concave holographic with 1200 lines/mm. Temperature stabilization of the photomultiplier was provided by a Peltier element to 15.0 ± 0.5 oC. The input optics were provided by a 15 cm diameter integrating sphere (model OL IS-640, Optronics Laboratories, Orlando, USA). Data acquisition and control were provided by SpectraMax software V.1.1 (Jobin-Yvon Co., France) operated on a Pentium laptop computer with a scan in the UV waveband between 280 and 400 nm in 1 nm steps taking approximately 1 minute. For each measurement session, the wavelength calibration was performed against the mercury 365 nm spectral line.
Temperature Drift
The drift of the combined spectroradiometer and standard lamp system with changes in ambient temperature was investigated by calibrating the system against standard S1 and measuring the spectral irradiance of a QTH lamp (SYL 235, Sylvania Lighting, Japan) powered at 9.5 A at a distance of 10 cm for six ambient temperatures between 25.6 and 22.2 oC. The ambient temperature was measured with a thermocouple at the input side of the monochromator.
Responsivity Comparison
Following measurement of the temperature drift of the combined spectroradiometer and standard lamp system, the temperature was maintained constant in the following experiments. The response of the spectroradiometer system, R(λ), was calculated employing standard S1 by scanning the lamp output between 280 and 400 nm followed by a scan of the photomultiplier dark count output resulting from random noise in the system as follows:
Dk V C R − = ) ( ) ( ) ( λ λ λ (2)
scanned wavelengths. For comparison, the response of the system was also calculated with the standard S2.
Irradiance Comparison
The above spectroradiometer calibration employing S1 was utilized to calculate the spectral irradiance, S(λ) of S2 as follows:
[
V Dk RS(λ)= (λ)* (λ)−
]
(3)This was compared to the spectral irradiance of S2 on the calibration certificate. For S2, the near UV (320 – 400 nm) and a shorter wavelength UV waveband (280 – 320 nm) irradiances were calculated along with the erythemal irradiances employing Equation (1) and the CIE (11) action spectrum. These broadband irradiances were compared to those calculated employing the spectral irradiances on the calibration certificate. The process was repeated by calibrating the system with S2 and comparing the spectral irradiances and broadband irradiances of S1 against the spectral irradiances and broadband irradiances derived from the calibration certificate.
Time Drift
The time drift of the calibration was determined by employing the spectroradiometer system calibrated against the S1 standard to measure the spectral irradiance of the QTH lamp powered at 9.5 A at a distance of 10 cm. This was repeated over a period of five weeks.
RESULTS
Temperature Drift
The effect of changes between 25.6 and 22.2 oC in the ambient temperature of the monochromator are provided in Table 1. There is a significant effect due to temperature on the irradiances measured of up to approximately 30% compared to the first temperature in Table 1. Although the temperature of the photomultiplier was maintained at a constant level, the change in the ambient temperature can still influence both the wavelength and sensitivity calibration of the spectroradiometer. This confirms previous research (12) that found the monochromator temperature to affect the biologically effective irradiances calculated from the recorded spectra. In order to estimate a correction for the temperature drift between 22.2 to 25.6 oC, the erythemal UV, shorter wavelength UV waveband and near UV waveband irradiances at 22.2 and 25.6 oC were employed to calculate a trendline to allow calculation of a correction for temperature changes between 22.2 and 25.6 oC. For the erythemal UV, shorter wavelength UV waveband and near UV waveband irradiances, the correction was 0.032 W m-2oC-1, 0.058 W m-2oC-1 and 0.57 W m-2oC-1, respectively. The irradiances for the intermediate four temperatures in Table 1 were recalculated and compared to the measured values provided in the Table. The average differences were 11%, 10% and 9% for the erythemal UV, shorter wavelength UV waveband and near UV waveband irradiances, respectively.
Comparison
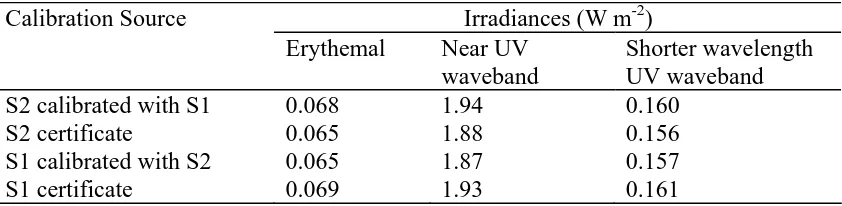
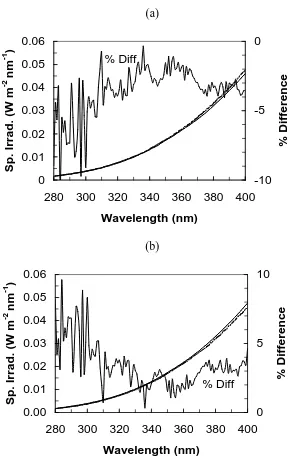
In Figure 2(a), the spectral irradiance of S2 obtained with the system calibrated with S1 compared to the spectral irradiance of S2 on the calibration certificate is provided. The percentage differences between the two averaged over all wavelengths are within 3.6%. Similarly, Figure 2(b) shows the spectral irradiance of S1 obtained with the system calibrated with S2, compared to the spectral irradiance of S1 on the calibration certificate. Table 2 provides the erythemally weighted irradiances calculated employing Equation (1) and the erythema action spectrum (11) along with the near UV and shorter UV waveband irradiances for the S1 and S2 lamps compared to the irradiances calculated with the spectral irradiances on the respective certificates. The near UV and shorter UV waveband irradiances agree to within 3% and the erythemal irradiances agree to 5 to 6%. This higher percentage for the erythemal irradiances is due to the erythema action spectrum possessing a higher weighting at the shorter wavelengths.
Time Drift
The variations in the broadband irradiances of the QTH lamp measured with the spectroradiometer calibrated against the standard S1 are provided in Table 3. The variations are within 5 to 6% of the average and over the period there is no obvious drift.
DISCUSSION
The ambient temperature affects the monochromator with significant changes in the erythemal and broadband irradiances. This emphasises the necessity to maintain the temperature of the monochromator as close as possible to that employed in the calibration against the standard lamp. Any changes in the ambient temperature or variations in the temperature of the monochromator due to solar heating for field measurements or heating by the source lamp for indoor measurements will require a recalibration of the spectroradiometer system against the standard lamp. Alternatively, as this may be a time consuming and lengthy process, a correction factor has been estimated in this paper for the temperature range of the monochromator 22.2 to 25.6 oC. For this temperature range, this reduces the error from approximately 30% to an average of approximately 10%.
The reliability of spectroradiometer measurements for determining the biologically effective and broad band UV irradiances depends critically on procedures employed in the calibration process. The errors due to the standard lamps have been determined in a series of experiments in the laboratory. There was no obvious drift with time in the broad band irradiances of an unknown lamp measured with the spectroradiometer calibrated against one of the standards. The estimates of the uncertainties in the quoted values of spectral irradiance on the standard lamp calibration certificate are stated as ±3.0% at 240 nm, decreasing linearly to ±2.0% at 350 nm. Previous research (5) has found that the effects of stray light and other issues, for example dark current in UV spectroradiometry contribute to no more than 5% variations in the spectral irradiance recorded by the spectroradiometer. The percentage errors found in this research are within these uncertainties in the calibration certificate and operation of the spectroradiometer.
REFERENCES
1. McKenzie, R. L., Johnston, P. V., Kotkamp, M., Bittar, A. and Hamlin, J. D., “Solar ultraviolet spectroradiometry in New Zealand: instrumentation and sample results from 1990”, Applied Optics (1992), 31, 6501-6509.
2. McKenzie, R. L., Kotkamp, M., Seckmeyer, G., Erb, R., Roy, C. R., Gies, H. P. and Toomey, S. J., “First southern hemisphere intercomparison of measured solar UV spectra”, Geophysical Research Letters (1993), 20, 2223-2226.
3. Seckmeyer, G., Mayer, B., Bernhard, G., McKenzie, R. L., Johnston, P. V., Kotkamp, M., Booth, C. R., Lucas, T., Mestechkina, T., Roy, C. R., Gies, H. P. and Tomlinson, D., “Geographical differences in the UV measured by intercompared spectroradiometers”, Geophysical Research Letters (1995), 22, 1889-1892.
4. Bernhard, G., Mayer, B. and Seckmeyer, G., “Measurements of spectral solar UV irradiance in tropical Australia”, Journal of Geophysical Research (1997), 102, 8719-8730.
5. Wong, C. F., Toomey, S., Fleming, R. A. and Thomas, B. W., “UV-B radiometry and dosimetry for solar measurements”, Health Physics (1995), 68, 175-184.
6. Roy, C.R., Gies, H.P., and Toomey, S., “The solar UV radiation environment: measurement techniques and results,” Journal of Photochemistry and Photobiology B: Biology (1995), 31, 21-27.
7. Seckmeyer, G., Mayer, B., Erb, R. and Bernhard, G., “UV-B in Germany higher in 1993 than in 1992”, Geophysical Research Letters (1994), 21, 577-580.
8. Kostkowski, H.J., “Reliable Spectroradiometry”, Spectroradometry Consulting, Maryland, USA (1997).
9. Webb, A. R., Gardiner, B. G., Blumthaler, M., Forster, P., Huber, M. and Kirsch, P. J., “A laboratory investigation of two ultraviolet spectroradiometers”, Photochemistry and Photobiology (1994), 60, 84-90.
10. Slaper, H., Reinen, H. A. J. M., Blumthaler, M., Huber, M. and Kuik, F., “Comparing ground-level spectrally resolved solar UV measurements using various instruments: A technique resolving effects of wavelength shift and slit width”, Geophysical Research Letters (1995), 22, 2721-2724.
11. CIE (International Commission on Illumination), “A reference action spectrum for ultraviolet induced erythema in human skin”, CIE J. (1987), 6, 17-22.
Table 1 - Variations with temperature in the broadband irradiances of the QTH lamp.
Temperature (oC) Irradiances (W m-2)
Erythemal Near UV waveband Shorter wavelength UV waveband
Table 2 – The measured irradiances of S2 compared to those calculated from the certificate and the measured irradiances of S1 compared to the calibration certificate.
Calibration Source Irradiances (W m-2)
Erythemal Near UV
waveband
Shorter wavelength UV waveband S2 calibrated with S1 0.068 1.94 0.160
Table 3 – The variation with time of the irradiances of the QTH lamp employing the spectroradiometer calibrated against S1.
Date Irradiances (W m-2)
Erythemal Near UV waveband Shorter wavelength UV waveband
27 February 0.21 4.04 0.365
13 March 0.22 4.32 0.395
20 March 0.20 3.89 0.350
FIGURE CAPTIONS
Figure 1 - Responsivity of the spectroradiometer system calculated with (1) the S1 standard and (2) the S2 standard.
(1)
(2)
0.0E+00 2.0E-06 4.0E-06 6.0E-06 8.0E-06 1.0E-05 1.2E-05 1.4E-05
280 300 320 340 360 380 400
Wavelength (nm)
Responsivity (W m
[image:12.595.171.423.128.317.2]-2 V -1 )
(a)
% Diff
0 0.01 0.02 0.03 0.04 0.05 0.06
280 300 320 340 360 380 400
Wavelength (nm)
Sp. Irrad. (W m
-2
nm
-1 )
-10 -5 0
% Difference
(b)
% Diff
0.00 0.01 0.02 0.03 0.04 0.05 0.06
280 300 320 340 360 380 400
Wavelength (nm)
Sp. Irrad. (W m
-2
nm
-1 )
0 5 10
[image:13.595.129.423.90.560.2]% Difference