Contents
Key points ... 1
Key points ... 1
Introduction ... 2
External influences ... 4
Table of key statistics ... 7
Number of certificates awarded ... 8
Analysis ... 9
Background notes ... 19
Glossary of terms ... 27
Your feedback ... 30
Appendix ... 31
Contents
Key points ... Error! Bookmark not defined. Introduction ... 2External influences ... 4
Table of key statistics ... 7
This release presents information on the range and number of, and certificates issued for, regulated qualifications during January to March 2016 (2016 Q1), excluding GCSEs and A levels. The key findings are:
Just under 1.3 million certificates were awarded, a decrease of 5% on the same quarter of 2015 and the lowest number of certificates awarded during quarter 1 since 2011.
The number of available qualifications this quarter decreased by 1% from 21,924 in the previous quarter to 21,676.
The qualification with the most certificates this quarter was Cambridge International Level 1/ Level 2 certificate in First Language English with 37,700 certificates
awarded.
The number of certificates issued for Level 1 qualifications decreased by 8% (from 325,500 to 299,750) and Level 2 qualifications decreased by 9% (from 629,000 to 571,100) on the same quarter in 2015. The number of certificates issued for Level 3
qualifications increased by 2% (from 187,400 to 191,300).
The number of certificates awarded for qualifications at
Level 4 and above has decreased by 2% on the same quarter in 2015 (from 26,250 to 25,600). The decrease was mainly in qualifications in the sector of Education and training.
The highest number of certificates awarded by Sector
Subject Area of qualification in this quarter was for Preparation for Life and Work (374,500 certificates).
Ofqual/16/6042
Vocational and Other Qualifications Quarterly
January to March 2016
Key pointsVocational and Other Qualifications
Quarterly
January to March 2016
Key points
Key points
Published: 7 July 2016
Published: 7 July 2016 Vikas Dhawan
Head of Profession
statistics@ofqual.gov.uk
Vikas Dhawan Head of Profession
Introduction
Ofqual regulates qualifications and assessments in England and until May 2016 (that is, including the period covered by this bulletin), it also regulated vocational
qualifications in Northern Ireland. This bulletin includes data on vocational and other qualifications on behalf of Qualifications Wales, the regulator in Wales, and on ‘other general’ qualifications (see glossary) and entry level qualifications on behalf of the regulator in Northern Ireland (CCEA). Ofqual’s objectives include promoting public confidence in and awareness of regulated qualifications.
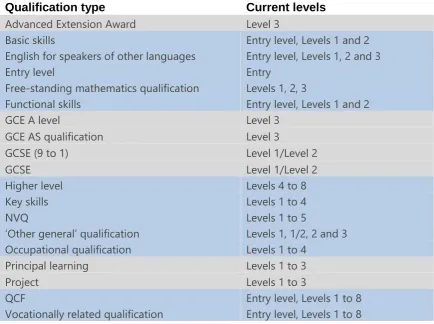
Regulated qualifications are classified into 19 qualification types with an associated ‘level’, which is indicative of the level of demand. The table below shows the current levels for each type of qualification and the relationship between them. Level 3 is at about the same level of demand, but not necessarily the same size, as an A level, and Level 2 is at about the same level of demand as a GCSE at grade C or above.
[image:2.595.76.511.447.771.2]On 1 October 2015, Ofqual withdrew the Qualifications and Credit Framework (QCF) requirements. This means that from that date, the QCF type has ceased to exist. However, for administrative reasons, awarding organisations can still use the QCF type on the system for new qualifications when no other type is appropriate, until our new system is introduced this summer.
Table of qualification types and levels
Qualification type Current levels
Advanced Extension Award Level 3
Basic skills Entry level, Levels 1 and 2
English for speakers of other languages Entry level, Levels 1, 2 and 3
Entry level Entry
Free-standing mathematics qualification Levels 1, 2, 3
Functional skills Entry level, Levels 1 and 2
GCE A level Level 3
GCE AS qualification Level 3
GCSE (9 to 1) Level 1/Level 2
GCSE Level 1/Level 2
Higher level Levels 4 to 8
Key skills Levels 1 to 4
NVQ Levels 1 to 5
‘Other general’ qualification Levels 1, 1/2, 2 and 3
Occupational qualification Levels 1 to 4
Principal learning Levels 1 to 3
Project Levels 1 to 3
QCF Entry level, Levels 1 to 8
This release presents data on regulated vocational and other qualifications1 (coloured
blue in the table above) for both the January to March 2016 quarter and the 12-month period ending March 2016.
This release does not include the rest of the qualifications given in the above table - Advanced Extension Award, GCSEs, AS and A levels, project and principal learning, on which data are published separately. Neither does it include university degrees, which Ofqual does not regulate.
1 Vocational and other qualifications are taken in order to develop and demonstrate the skills needed
External influences
Changes in the number of qualifications available and the number of certifications are likely to be influenced by changes to government policies in England, including
changes in government funding, performance tables and study programmes.
Public funding changes by the Skills Funding Agency
2In the last few years, the funding rules for vocational qualifications aimed at students who are over 19 years of age have seen a number of changes that are likely to have had some effect on the number of certificates awarded each year. The Skills Funding Agency (SFA) introduced new business rules3 in September 2013 to target funding at
qualifications that most closely align with the government’s skills policy. A particular aspect of these rules was the withdrawal of funding for qualifications with low
enrolment. The funding rule changes for 2014/15 included a requirement that
qualifications have at least 15 credits for adult learning and have clear outcomes for progression to employment or the next level of learning. New funding rules4 have
been introduced during 2015/16. However, it is too early to find any visible impact of the new rules on the statistics reported in this bulletin. Throughout these statistics, there are examples of continued declines in the numbers of certifications for
qualifications which do not meet these rules, and from which funding has therefore been removed.
Legal entitlement and local flexibility
Only certain qualifications are now eligible for funding through the legal entitlement5
for 2016 to 2017. This is for learners aged 16 to 23 who are studying their first qualification at level 2 and/or level 3. These include the qualifications that are included in the Performance Tables.
2The Skills Funding Agency funds adult skills training for further education in England. It supports
over 1,000 colleges, private training organisations and employers with more than £4 billion of funding each year.
3 Skills Funding Statement 2013–2016: https://www.gov.uk/guidance/sfa-funding-rules
4
https://www.gov.uk/government/uploads/system/uploads/attachment_data/file/414800/Funding_Rules _v2_summary_of_changes_March_2015.pdf
The SFA is working towards full devolution, putting greater power in the hands of local authorities to meet skills gaps for their area. The latest changes, for 2016 to 20176, set out how qualifications that do not qualify for legal entitlement, outside of
apprenticeships, are eligible for funded delivery as part of its ‘local flexibility’ policy. The local flexibility policy is based on the view that local areas, colleges and other training organisations are best placed to decide on the most appropriate type of training provision to respond to local needs. To support local area needs and deliver agreed local outcomes, funding allocations will be decided by local authorities - and colleges and other training organisations will decide on the most appropriate form of training provision. This may or may not include qualifications.
Advanced learner loans are now available for all learners aged over 24, and will be available for learners aged 19+ from 1 August 2016 for level 3 to level 6
qualifications7.
These changes are beginning to have an impact on types of qualifications taken, the numbers of certifications and the risks those qualifications face.
School performance tables
8Over the last few years, there has been a considerable change in the way that qualifications are used in schools following the Wolf Report9. In 2013, any
qualification on the section 9610 funding list could count towards the school and
6https://www.gov.uk/government/uploads/system/uploads/attachment_data/file/510278/Qualification_E ligibility_Principles_v1.pdf
7 https://www.gov.uk/government/publications/advanced-learner-loans-qualifications-catalogue
8The key government benchmark for the attainment of Key Stage 4 pupils (aged 15 to 16) is the
percentage of pupils gaining the equivalent of at least five A* to C GCSE passes, including English
and mathematics, though this is changing. Some other qualifications can also be counted in performance tables.
9 Review of Vocational Education – The Wolf Report (March 2011) considered how the Department for
Education can improve vocational education for those aged 14 to 19:
www.gov.uk/government/uploads/system/uploads/attachment_data/file/180504/DFE-00031-2011.pdf
10 Where section 96 approval has been awarded to a qualification, it enables that qualification to be
college performance tables at key stage 4 and key stage 5. Since 2014, only a small number of non-GCSEs or A levels have been included in performance tables. This is likely to have led to changes in schools’ and colleges’ curriculum and qualifications choices, away from qualifications that are not included in performance tables.
Moreover, qualifications in these tables were previously weighted; larger
Table of key statistics
October - December 2015
January - March 2016
% change on previous qtr
Number of available qualifications 21,924 21,676 -1
Number of awarding organisations
with available qualifications this quarter 160 155 -3
154 150 -3
Number of available qualifications by type
Basic skills 6 4 -33
English for speakers of other languages 169 142 -16
Entry level 173 175 1
Free-standing mathematics qualification 14 14 0
Functional skills 203 221 9
Higher level 86 81 -6
Key skills 97 91 -6
NVQ 94 48 -49
Occupational qualification 7 11 57
Other general qualification 660 663 0
QCF 19,855 19,669 -1
Vocationally related qualification 560 557 -1
35
Number of available qualifications by level
Entry level 2,706 2,666 -1
Level 1 3,023 2,991 -1
Level 1/2 181 194 7
Level 2 6,953 6,888 -1
Level 3 6,373 6,246 -2
Level 4 1,496 1,496 0
Level 5 709 708 0
Level 6 256 255 0
Level 7 220 225 2
Level 8 7 7 0
Number of available qualifications by sector subject area
Agriculture, horticulture and animal care 849 840 -1
Arts, media and publishing 1,567 1,503 -4
Business, administration, finance and law 2,566 2,555 0 Construction, planning and the built environment 1,348 1,367 1
Education and training 1,218 1,207 -1
Engineering and manufacturing technologies 2,245 2,210 -2
Health, public services and care 2,449 2,473 1
History, philosophy and theology 46 46 0
Information and communication technology 469 475 1 Languages, literature and culture 1,177 1,070 -9
Leisure, travel and tourism 957 942 -2
Preparation for life and work 4,184 4,170 0
Retail and commercial enterprise 2,628 2,597 -1
Science and mathematics 194 194 0
Social sciences 27 27 0
Number of certificates awarded
Note: All figures are rounded to the nearest 50. Figures are rounded independently and may not sum to the total.
January - March 2015 January - March 2016
% change on previous year's same quarter April 2014 - March 2015 April 2015 - March 2016
% change on previous 12
months
Overall number of certificates awarded
1,362,600 1,296,050 -5 8,631,800 8,109,800 -6
Number of certificates by type of qualification
Basic skills 50 0 1,800 50 -97
English for speakers of other languages 72,650 52,850 -27 374,950 230,450 -39
Entry level 3,150 2,300 -27 85,400 72,750 -15
Free-standing mathematics qualification 550 450 35,900 37,250 4
Functional skills 186,100 158,650 -15 1,067,100 995,150 -7
Higher level 1,450 2,950 103 5,750 9,950 73
Key skills 16,650 15,700 -6 113,200 97,650 -14
NVQ 700 200 -71 4,550 2,300 -49
Occupational qualification 0 0 0~ 0~
Other general qualification 93,700 95,600 2 948,800 1,262,100 33
QCF 981,050 960,550 -2 5,825,300 5,357,750 -8
Vocationally related qualification 6,650 6,850 3 169,150 44,400 -74
Number of certificates by qualification level
Entry level 148,400 146,050 -2 981,100 953,750 -3
Level 1 325,500 299,750 -8 1,972,100 1,767,500 -10
Level 1/ Level 2 46,100 62,250 35 439,150 894,050 104
Level 2 629,000 571,100 -9 3,749,300 2,994,200 -20
Level 3 187,400 191,300 2 1,367,300 1,364,650 0
Level 4 12,050 13,050 8 59,650 71,400 20
Level 5 9,750 9,300 -5 46,150 46,000 0
Level 6 2,700 2,450 -9 10,950 12,600 15
Level 7 1,600 750 -53 5,850 5,350 -9
Level 8 100 50 -50 300 250 -17
Number of certificates by sector subject area
Agriculture, horticulture and animal care 19,400 7,800 -60 114,100 105,800 -7
Arts, media and publishing 107,750 128,050 19 894,100 837,050 -6
Business, administration, finance and law 98,600 78,550 -20 620,300 512,900 -17 Construction, planning and the built environment 47,600 48,600 2 256,000 279,900 9
Education and training 17,600 17,150 -3 95,300 89,150 -6
Engineering and manufacturing technologies 73,150 68,550 -6 398,250 391,550 -2
Health, public services and care 259,800 253,700 -2 1,203,950 1,175,850 -2
History, philosophy and theology 550 600 9 33,950 31,250 -8
Information and communication technology 48,900 63,200 29 490,900 423,700 -14
Languages, literature and culture 78,200 78,650 1 484,850 595,550 23
Leisure, travel and tourism 51,550 50,000 -3 456,700 411,300 -10
Preparation for life and work 413,550 374,500 -9 2,577,350 2,359,150 -8
Retail and commercial enterprise 133,600 114,850 -14 670,850 584,550 -13
Science and mathematics 12,250 11,800 -4 328,750 302,500 -8
Social sciences 100 100 0 6,400 9,600 50
Number of certificates by country
England 1,237,250 1,181,800 -4 7,775,100 7,301,500 -6
Wales 94,050 86,200 -8 627,950 606,600 -3
Analysis
This section presents figures on the number of qualifications that are available for students to enrol on (even if only for one day during the quarter), and those that may have expired (where students can no longer enrol) but which remain active until the final certificate has been issued.
Qualifications available
This quarter, the number of available qualifications decreased by 1% compared to the previous quarter, from 21,924 to 21,676 (see the table of key statistics on page 7). The number of available qualifications decreased or stayed the same for all types of qualifications, except for entry level, functional skills and occupational
qualifications. The change in the number of available qualifications resulted from 412 new qualifications becoming available (of which 302 were classified as Qualifications and Credit Framework (QCF) qualifications, and 54 were vocationally related
qualifications) and 660 qualifications expiring (most of these being QCF (488)). Nearly two thirds (63%) of the qualifications that expired had no certifications in the 12 months ending December 2015. The 412 newly available qualifications are offered by 62 awarding organisations.
Table 1 of the appendix presents the number of available qualifications over the past five years, broken down by type.
Awarding organisations
The number of recognised awarding organisations (155) offering regulated qualifications is slightly lower than in the previous quarter (160). The number of organisations that issued certificates this quarter was 150 (from 154 last quarter). This is similar to the number of awarding organisations offering regulated
qualifications that issued certificates in quarter 1 of 2015 (156).
Certificates issued
There was a decrease of 5% in the number of certificates issued compared with the same quarter of 2015 (from 1.4 million to 1.3 million). The number of certificates awarded this quarter is the lowest for quarter 1 (January to March) since 2011.
The number of certificates issued in each quarter since January to March 2011, and in the 12-month period to each quarter end, is presented in table 2 of the appendix.
Certificates by country
This quarter, 91% of all certificates issued were in England, 7% were in Wales and 2% were in Northern Ireland (see figure 2). This distribution is similar to the same quarter of 2015.
There was a decrease in the number of certificates awarded this quarter in all three countries compared with the same quarter in 2015. Over the 12 months to March 2016, there was a decrease of 6% in England, 3% in Wales and 12% in Northern Ireland.
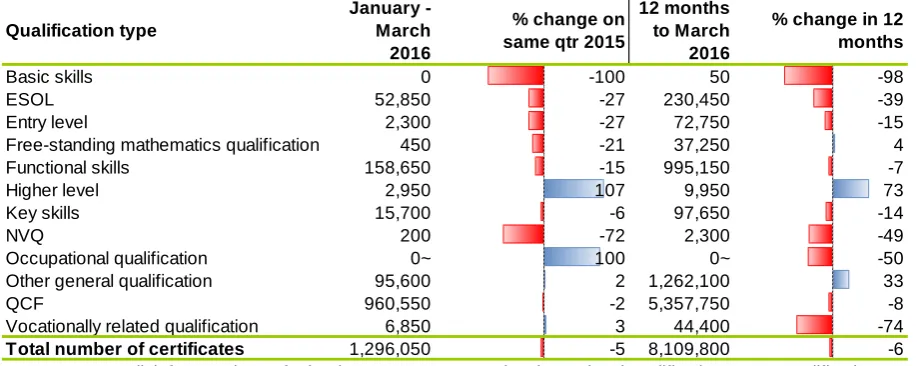
Certificates by type of qualification
Figure 3 presents the number of certificates issued by qualification type in this quarter and during the 12 months ending March 2016. Table 3 of the appendix
presents the number of certificates issued each quarter since January to March 2011 by type of qualification. Most certificates issued this quarter were for QCF
qualifications (960,550 certificates out of 1.30 million, or 74%). Since the QCF was introduced in 2010, the number of awards of qualifications meeting QCF
requirements has grown rapidly. This growth followed the SFA’s preference to mainly fund qualifications on the QCF.
The number of certificates awarded for QCF qualifications decreased by 2% this quarter compared with the same quarter of 2015. This is the eighth consecutive quarter where the number of certificates awarded for QCF qualifications has
decreased, compared to the same quarter the year before. Ofqual withdrew the QCF requirements at the beginning Q3 2015, and the SFA withdrew its preference for funding them.
Country Proportion
of total
January - March 2016
% change on previous year's same quarter
12 months to March 2016
% change in 12 months
England 91 1,181,800 -4 7,301,500 -6
Wales 7 86,200 -8 606,600 -3
Northern Ireland 2 28,100 -10 201,700 -12
Total number of
certificates issued 100 1,296,050 -5 8,109,800 -6
The number of certificates awarded for English for speakers of other languages (ESOL) qualifications decreased by 27% compared with the same quarter of 2015. It is the fifth quarter where the number of certificates for ESOL qualifications has decreased, compared to the same quarter the year before. The 12-month trend shows a decrease of 39% compared to the 12 months ending March 2015. This is likely to be due to a change in the funding arrangements for ESOL qualifications. From December 2014, the SFA stopped funding the existing ESOL qualifications. From January 2015, funding for ESOL qualifications is only available when a student completes a QCF ESOL Skills for Life qualification.11
Certificating awarding organisations
Over the last 12 months, 150 awarding organisations issued certificates, representing 97% of the awarding organisations with available qualifications.
Figure 4 shows the ten awarding organisations that issued the most certificates this quarter, along with figures for the 12 months to quarter end. The combined total number of certificates issued by these ten organisations represents 61% of all awards during this quarter (784,150 out of 1.30 million certificates).
11 www.gov.uk/government/publications/esol-qualifications-interim-arrangements/new-qualifications-
and-credit-framework-english-for-speakers-of-other-languages-skills-for-life-qualifications-funding-arrangements-for-2014-to-2015
Qualification type
January - March 2016
% change on same qtr 2015
12 months to March 2016
% change in 12 months
Basic skills 0 -100 50 -98
ESOL 52,850 -27 230,450 -39
Entry level 2,300 -27 72,750 -15
Free-standing mathematics qualification 450 -21 37,250 4
Functional skills 158,650 -15 995,150 -7
Higher level 2,950 107 9,950 73
Key skills 15,700 -6 97,650 -14
NVQ 200 -72 2,300 -49
Occupational qualification 0~ 100 0~ -50
Other general qualification 95,600 2 1,262,100 33
QCF 960,550 -2 5,357,750 -8
Vocationally related qualification 6,850 3 44,400 -74
[image:12.595.70.529.110.293.2]Total number of certificates 1,296,050 -5 8,109,800 -6
Figure 3: Number of certificates issued in this quarter and in the 12 months to March 2016 by qualification type (with % change on previous year's same period)
Note: Pearson Education Ltd includes awards from Edexcel and Education Development International
(EDI).
Six of the ten awarding organisations that issued the most certificates recorded decreases this quarter compared with the same quarter in 2015.
OCR had a decrease of 25% in the number of certificates awarded (from 70,500
to 52,650). Most of this decrease is due to the decrease in the number of certificates awarded in QCF qualifications (from 46,950 to 34,050).
Pearson Education Ltd had a decrease of 24% in the number of certificates awarded (from 228,650 to 174,350). Most of this decrease is due to the decrease in the number of certificates awarded in QCF qualifications (from 118,350 to 81,150) and functional skills (82,000 to 62,250).
City and Guilds of London institute also had a decrease in the number of certificates they awarded this quarter compared to the same quarter of 2015 (from 238,650 to 196,600). Most of this decrease is due to the decrease in the number of certificates awarded in QCF qualifications (from 151,450 to 122,200).
The increase in certificates awarded this quarter by Trinity College London (from 28,150 to 46,050) is mainly due to an increase in the number of
certificates awarded in QCF (from 12,650 to 22,700) and ESOL (from 15,500 to 23,350) qualifications.
The increase in certificates awarded this quarter by Cambridge International Examinations (from 27,900 to 39,200) is mainly due to an increase in the number of certificates awarded for the Level 1/ Level 2 certificate in first language English (from 26,200 to 37,700).
Awarding organisation January – March 2016
% change on same qtr 2015
12 months to March 2016
% change in 12 months
City and Guilds of London Institute 196,600 -18 1,283,800 -9
Pearson Education Ltd 174,350 -24 1,795,950 -17
Chartered Institute of Environmental Health 61,150 -14 250,350 -15
NCFE 58,000 -5 331,400 -7
Highfield Awarding Body for Compliance 57,000 -13 255,500 -3
Cambridge English Language Assessment 53,500 2 293,250 36
OCR 52,650 -25 440,600 -27
Trinity College London 46,050 64 208,100 16
Qualsafe Awards 45,700 15 160,700 17
Cambridge International Examinations 39,200 41 292,450 74
Total number of certificates for the 10 awarding
[image:13.595.76.524.110.285.2] The number of certificates awarded by Qualsafe Awards increased by 15% this quarter (from 39,650 to 45,700). This increase is mainly due to the increase in the number of certificates awarded in the sub-sector of health and social care (37,700 to 43,100).
The 50 organisations that awarded the highest numbers of qualifications this quarter are shown in table 4 of the appendix.
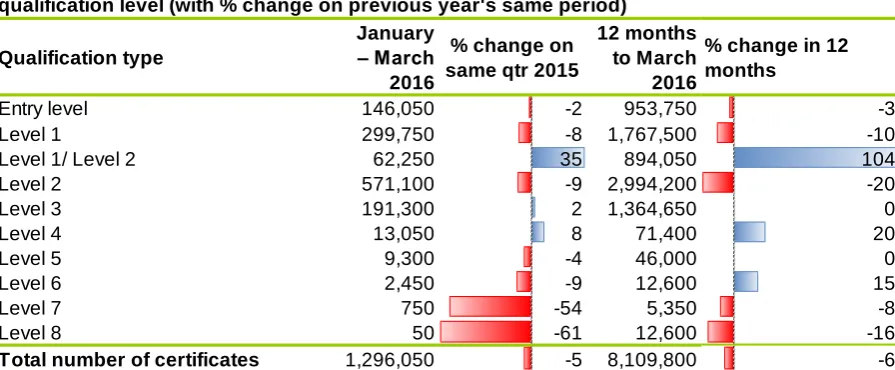
Certificates by level of qualification
This section presents figures on the number of certificates issued this quarter and during the 12 months ending March 2016, by level of qualification. Each regulated qualification has a level between Entry level and Level 8, which indicates the broad level of demand of the qualification.12
Figure 5 gives a breakdown of the number of certificates by level of qualification.
The number of certificates issued for Level 1 and Level 2 qualifications has declined year-on-year for the eleventh consecutive quarter (compared to the same quarter the year before). The number of certificates issued for Level 1 decreased by 8 percent and the number of certificates issued for Level 2 decreased by 9%. The decline in both levels this quarter, compared to the same quarter in 2015, is partly because of a decrease in the number of certificates awarded in Functional skills (from 86,550 to 72,150 for level 1) and QCF (from 505,000 to 470,350 for level 2).
12 Further details on comparing qualification levels are available on Ofqual’s website: www.gov.uk/what-different-qualification-levels-mean
Qualification type
January – March 2016
% change on same qtr 2015
12 months to March 2016
% change in 12 months
Entry level 146,050 -2 953,750 -3
Level 1 299,750 -8 1,767,500 -10
Level 1/ Level 2 62,250 35 894,050 104
Level 2 571,100 -9 2,994,200 -20
Level 3 191,300 2 1,364,650 0
Level 4 13,050 8 71,400 20
Level 5 9,300 -4 46,000 0
Level 6 2,450 -9 12,600 15
Level 7 750 -54 5,350 -8
Level 8 50 -61 12,600 -16
[image:14.595.74.522.345.530.2]Compared to the same quarter last year, there was an increase of 35% in the number of certificates awarded for Level 1/ Level 2 qualifications (from 46,100 to 62,250). There was a very large increase in the number of Level 1/Level 2
qualifications awarded in the last 15 months compared to 2014, reflecting the switch by many schools to Level 1/Level 2 certificates instead of GCSEs.
As mentioned at the start of this report, the number of certificates awarded for
qualifications at Level 4 and above decreased by 2% this quarter compared with the same quarter in 2015 (from 26,250 to 25,600), with the decrease mainly occurring in education and training (from 3,600 to 3,200).
Table 5 of the appendix presents the number of certificates awarded by qualification level in each quarter from January to March 2011 to this quarter.
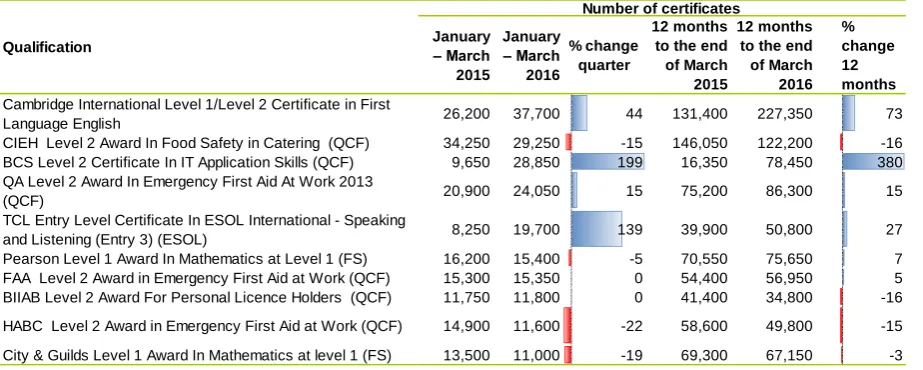
Certificates by qualification
This quarter 8,805 qualifications had certificates issued, representing 41% of all available qualifications. This is similar to the same quarter of 2015. The 50
qualifications with the most certificates awarded this quarter are listed in table 6 of the appendix.
The ten qualifications with the highest number of certificates issued this quarter and in the 12 months ending March 2016 are shown in figure 6.
The qualification with the most certificates issued this quarter was the Cambridge International Examinations Level 1/ Level 2 certificate in first language English with 37,700 certificates awarded. This is an increase of 44% compared to the same quarter of 2015 when there were 26,200 certificates awarded.
January – March 2015
January – March 2016
% change quarter
12 months to the end of March 2015
12 months to the end of March 2016
% change 12 months
Cambridge International Level 1/Level 2 Certificate in First
Language English 26,200 37,700 44 131,400 227,350 73
CIEH Level 2 Award In Food Safety in Catering (QCF) 34,250 29,250 -15 146,050 122,200 -16 BCS Level 2 Certificate In IT Application Skills (QCF) 9,650 28,850 199 16,350 78,450 380 QA Level 2 Award In Emergency First Aid At Work 2013
(QCF) 20,900 24,050 15 75,200 86,300 15
TCL Entry Level Certificate In ESOL International - Speaking
and Listening (Entry 3) (ESOL) 8,250 19,700 139 39,900 50,800 27 Pearson Level 1 Award In Mathematics at Level 1 (FS) 16,200 15,400 -5 70,550 75,650 7 FAA Level 2 Award in Emergency First Aid at Work (QCF) 15,300 15,350 0 54,400 56,950 5 BIIAB Level 2 Award For Personal Licence Holders (QCF) 11,750 11,800 0 41,400 34,800 -16
HABC Level 2 Award in Emergency First Aid at Work (QCF) 14,900 11,600 -22 58,600 49,800 -15
[image:15.595.71.533.488.673.2]City & Guilds Level 1 Award In Mathematics at level 1 (FS) 13,500 11,000 -19 69,300 67,150 -3
Figure 6: The ten qualifications with the highest number of certificates awarded this quarter and in the 12 months to the end of March 2016 (figures for the 12 months to the end of March 2015 shown for comparison)
Qualification
Six of the qualifications on the list were QCF qualifications. The qualification with the largest increase, based on the number of certificates awarded, was BCS level 2 certificate in IT application skills with an increase of more 19,200 certificates (from 9,650 in 2015 to 28,850 in 2016).
Certificates by Sector Subject Area
Regulated qualifications are allocated by the awarding organisations to one of 15 sector subject areas. This section presents figures on the number of certificates issued this quarter and during the 12 months ending March 2016, by the sector subject area of the qualification.
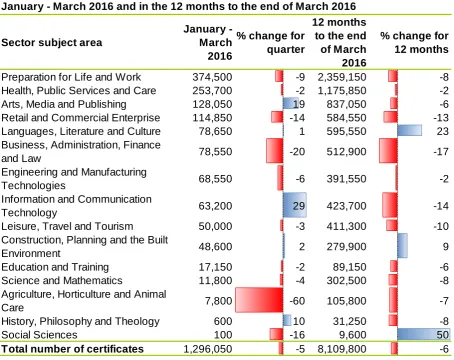
Figure 7 shows the areas ordered by size, in terms of the number of certificates issued this quarter, with the largest sector subject area first.
The highest number of certificates was issued in the Preparation for Life and Work sector (374,500, representing 29% of the total issued this quarter and 29% of the total issued in the 12 months ending March 2016). However, this sector had the largest decrease in the actual number of certificates awarded this quarter compared to the same quarter in 2015, with a 9% decrease (from 413,550 certificates to 374,500). The majority of this decrease is for certificates in the foundations for learning and life sub-sector (from 370,550 to 337,450).
The largest increase in the actual number of certificates awarded this quarter compared with the same quarter in 2015 was in Arts, media and publishing (from 107,750 to 128,050). This is due to the increase in the number of certificates awarded for the performing arts sub-sector (from 99,050 to 121,000). The largest percentage increase in the number of certificates awarded this quarter compared with the same quarter in 2015 was Information and communication technology
(29%). This was due to the increase in the number of certificates awarded for the ICT for users sub-sector (from 43,550 to 57,750).
Table 7 of the appendix presents the number of certificates awarded in vocational qualifications by sector subject area by quarter from January to March 2011 to this quarter. Table 8 of the appendix gives a more detailed breakdown of the sector subject areas for these certificates.
Certificates issued in England, Wales and Northern Ireland
The overall number of certificates awarded has decreased for all three countries for the 12-month period to March 2016 (see figure 2).
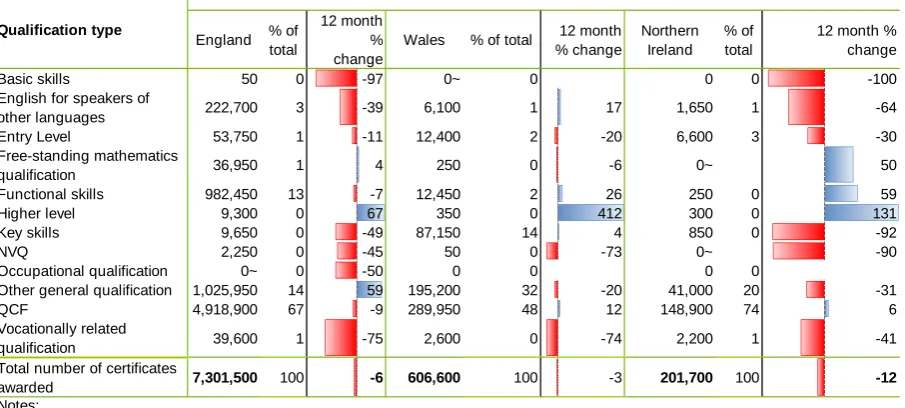
Figure 8, shows that the QCF qualifications dominate in England (67%), Wales (48%) and Northern Ireland (74%). Compared to the same period in 2015, these numbers have decreased in England but have increased in Wales and Northern Ireland.
The number of certificates issued for functional skills qualifications in Wales and Northern Ireland increased in the 12 months ending March 2016 compared with the same period in 2015, although the total number of certificates awarded in Northern
Sector subject area
January - March 2016
% change for quarter
12 months to the end of March 2016
% change for 12 months
Preparation for Life and Work 374,500 -9 2,359,150 -8
Health, Public Services and Care 253,700 -2 1,175,850 -2
Arts, Media and Publishing 128,050 19 837,050 -6
Retail and Commercial Enterprise 114,850 -14 584,550 -13
Languages, Literature and Culture 78,650 1 595,550 23
Business, Administration, Finance
and Law 78,550 -20 512,900 -17
Engineering and Manufacturing
Technologies 68,550 -6 391,550 -2
Information and Communication
Technology 63,200 29 423,700 -14
Leisure, Travel and Tourism 50,000 -3 411,300 -10
Construction, Planning and the Built
Environment 48,600 2 279,900 9
Education and Training 17,150 -2 89,150 -6
Science and Mathematics 11,800 -4 302,500 -8
Agriculture, Horticulture and Animal
Care 7,800 -60 105,800 -7
History, Philosophy and Theology 600 10 31,250 -8
Social Sciences 100 -16 9,600 50
[image:17.595.72.527.113.473.2]Total number of certificates 1,296,050 -5 8,109,800 -6
Skills qualifications). For the same period, the number of certificates awarded in England decreased by 7%.
The number of certificates issued for ‘other general’ qualifications for the 12 months ending March 2016 represents 14% of the total in England, 32% in Wales and 20% in Northern Ireland. The number of certificates awarded is rising in England for this category of qualification but shows a decrease in Northern Ireland and Wales13.
Tables 9 to 11 in the appendix present the 50 organisations that awarded the most qualifications in England, Wales and Northern Ireland, respectively, during April 2015 to March 2016.
13 Direct comparisons of ‘other general’ qualifications between England, Wales and Northern Ireland
[image:18.595.74.527.198.402.2]are difficult as this category includes Essential Skills, which are the Wales and Northern Ireland equivalent of functional skills.
Figure 8: Number of certificates in the 12 months to the end of March 2016, by country and type of qualification
England % of total
12 month % change
Wales % of total 12 month % change
Northern Ireland
% of total
12 month % change
Basic skills 50 0 -97 0~ 0 0 0 -100
English for speakers of
other languages 222,700 3 -39 6,100 1 17 1,650 1 -64
Entry Level 53,750 1 -11 12,400 2 -20 6,600 3 -30
Free-standing mathematics
qualification 36,950 1 4 250 0 -6 0~ 50
Functional skills 982,450 13 -7 12,450 2 26 250 0 59
Higher level 9,300 0 67 350 0 412 300 0 131
Key skills 9,650 0 -49 87,150 14 4 850 0 -92
NVQ 2,250 0 -45 50 0 -73 0~ -90
Occupational qualification 0~ 0 -50 0 0 0 0
Other general qualification 1,025,950 14 59 195,200 32 -20 41,000 20 -31
QCF 4,918,900 67 -9 289,950 48 12 148,900 74 6
Vocationally related
qualification 39,600 1 -75 2,600 0 -74 2,200 1 -41
Total number of certificates
awarded 7,301,500 100 -6 606,600 100 -3 201,700 100 -12
Qualification type
Notes:
Background notes
This release presents data on available regulated vocational and other qualifications and the number of certificates issued. It does not include the Advanced Extension Award, GCSEs, AS and A level qualifications, project and principal learning. The number of certificates awarded for these qualifications can be found on the Joint Council for Qualifications website.14
The data cover regulated qualifications in England, Wales and Northern Ireland, whether regulated by Ofqual, Qualifications Wales or CCEA (Northern Ireland regulator). The figures cover both the January to March 2016 quarter and the 12-month period ending March 2016.
This document is produced in line with Ofqual’s statistics policies15 and the Code of
Practice for Official Statistics.16
A glossary of terms is available in the next section to help you interpret this release.
Data sources
Information on qualifications is taken from Ofqual’s Register of Regulated Qualifications.17 Data on available qualifications, covering title, type, awarding
organisation, sector subject area and level, are taken from the Register, and awarding organisations send Ofqual the number of certificates awarded. Further information on the administrative sources is available within Ofqual’s statistical policies.
This release shows the number of awards broken down by awarding organisation, sector subject area, type of qualification, level of qualification and country.
Limitations of data
Data are collected at the earliest point available, which is the first day of the next reporting period. This reduces the time between the activity and reporting on the activity.
14www.jcq.org.uk/examination-results
15www.gov.uk/government/publications/ofquals-statistics-policies-and-procedures
16www.statisticsauthority.gov.uk/assessment/code-of-practice/index.html
The main source of potential error18 is in the information provided by awarding
organisations. Ofqual cannot guarantee that the number of certificates submitted is correct and there may be systematic bias when the information is sent, although awarding organisations are expected to provide the correct data. Ofqual compares the data over time and checks for systematic issues. Summary data are then sent back to awarding organisations to be checked and confirmed. The figures reported in this release reflect the certificates issued by awarding organisations at the time of data collection.
Quality assurance procedures are carried out as explained in the Quality Assurance
Framework for Statistical Publication and the Data Audit Framework19 to ensure the
accuracy of the data and to challenge or question it where necessary. Ofqual continually manages this process by:
ensuring that data suppliers are clear about what is required of them, in part achieved by consulting them during the initial design and any subsequent change phases;
reminding all suppliers (if appropriate) that, as a condition of being regulated, all data must be completely accurate;
being alert to unexpected changes in the data submitted by comparing individual returns over time from the same supplier;
actively challenging any unexpected results with data suppliers;
seeking explanations for changes and trends in the data;
checking the data provided against other data either within Ofqual or available from third parties such as the Department for Education’s National Pupil Database;20
18Statement of Administrative Sources includes information about the potential sources of error and
how Ofqual mitigates these: www.gov.uk/government/publications/ofquals-statistics-policies-and-procedures
19www.gov.uk/government/publications/ofquals-statistics-policies-and-procedures
20 The National Pupil Database contains detailed information about pupils in schools and colleges in
having a proportionate data auditing framework in place allowing for auditing of suppliers, information collection, collation and delivery processes as necessary, using a wide range of tools from questionnaires to on-site process audits.
Publication may be deferred if the statistics are not considered fit for purpose.
Comparisons in this release are mainly made with data from the same quarter of the previous year and the 12-month period up ending the same quarter of the previous year. This is because of seasonal changes in the number of certificates issued over the year.
After data collection, the trends are interpreted by a group of colleagues from Ofqual who are aware of the latest changes in policies. Before being released, the
publication has to be signed off by Ofqual’s Head of Profession for Statistics who confirms the quality of the release.
Geographical coverage
In this release, Ofqual presents data on certificates issued for all regulated
qualifications (excluding GCSEs, AS and A levels, Advanced Extension Award and Principal Learning21) in England, Wales and Northern Ireland during the January to
March 2016 quarter.
Statistics for Scotland are on the Scottish Qualifications Authority website.22
Ofqual started to collect data for England, Wales and Northern Ireland individually in 2011.
Revisions
Once published, data on the number of certificates issued for any qualification are not usually subject to revision, although subsequent releases may be revised to insert late data or to correct an error. Qualifications may also be re-categorised to a different type, level, sector subject area or awarding organisation. In some cases, data may be amended to reflect the new categorisation.
In this release, previous years’ figures from five awarding organisations (City and Guilds of London Institute, OCR, SFJ Awards, Pearson Education and Cambridge International Examinations) have been revised. The table of revision, published
21 Data for GCSEs, AS and A levels can be found on the Joint Council for Qualifications website: www.jcq.org.uk/examination-results
22 The Scottish Qualifications Authority is the national accreditation and awarding organisation in
alongside this publication, shows the changes for each quarter by level, type of qualification and sector subject area.
Completeness of the data
Awarding organisations send data to Ofqual each quarter. Any awarding organisation that does not return a complete set of data within the collection period is contacted to make sure that the data are as complete as possible. For this quarter, Ofqual
received data from all the awarding organisations that were in a position to award qualifications.
Confidentiality
To ensure confidentiality of the published accompanying data in accordance with Ofqual’s Statement on Confidentiality,23 the number of certificates awarded has been
rounded to the nearest five. If the value is less than five, it is represented as 0~. A 0 represents zero achievements.
Rounding
In accordance with Ofqual’s Rounding Policy,24 figures in the commentary and tables
for the number of certificates issued are rounded to the nearest 50 for ease of use. As a result of rounded figures, the percentages shown in any pie charts may not necessarily add up to 100. The raw data published alongside this publication are rounded to the nearest five to protect confidentiality.
The numbers of qualifications have been left as exact figures because there is no issue with confidentiality and also because some of the numbers are so small that it aids the user to have actual figures.
Users of these statistics
This publication attracts a wide variety of users who use the statistics in various ways:
Internal (Ofqual) users use the statistics to monitor the market, to target resources and for input into analysis and reports.
Central government officials use the statistics for policy implementation and ministerial briefings about government-funded provision and to draw on for their own publications.
23www.gov.uk/government/publications/ofquals-statistics-policies-and-procedures
Awarding organisations use the statistics and underlying data as market intelligence, to monitor market share and to understand more about their competitors and product availability.
Sector skills councils and other employer groups use the statistics to understand training uptake within their sectors and to assist them in understanding how the qualifications are meeting employer demand.
Other users, including colleges and training providers, have varying needs, from using the information to assist in research projects to focusing on individual qualifications within their industry.
Users from central government and internal users focus on the detailed published data, as do some awarding organisations. Others draw on the aggregate official statistics and commentary to provide context.
Related statistics and publications
There are a number of related statistical releases and publications:
The Statistical First Release: GCSE and Equivalent Results in England
2014/15,25 published by the Department for Education, covers students’
achievements in GCSEs and equivalent regulated qualifications in schools at the end of key stage 4.
The Statistical First Release: A Level and Other Level 3 Results in England,
Academic Year 2014 to 201526 covers achievements for those aged 16 to 18 at
schools and colleges in all Level 3 qualifications. These releases can be used to add context to the trends seen in Level 2 and Level 3 GCE and GCSE
equivalent qualifications.
The quarterly Statistical First Release,27 published by the Department for
Business, Innovation & Skills, reports on apprenticeship volumes that cover
25Statistical First Release: GCSE and Equivalent Results in England 2013/14 (Provisional):
https://www.gov.uk/government/statistics/provisional-gcse-and-equivalent-results-in-england-2014-to-2015
26 https://www.gov.uk/government/statistics/provisional-gcse-and-equivalent-results-in-england-2014-to-2015
statistics on adult (19+) government-funded participation, achievement and success rates for further education, and apprenticeships participation and achievements for all ages (16+) in England. It also shows figures on certificates issued for vocational qualifications in the UK, as collected by Ofqual and
through the National Vocational Qualifications Database.
Useful information
The data behind these statistics are published alongside this statistical release at 9.30am on the day of release.28 The data set is not revised until the next publication
is released. You can find the publication schedule for the next releases on the GOV.UK website.29
The Register gives information on regulated qualifications and recognised awarding organisations in England, Wales and Northern Ireland.30
User feedback
Ofqual has recently asked its user groups for feedback on this publication. Here is a summary of the improvements suggested, organised into those that have already been put in place and those that Ofqual will not be able to accommodate. Ahead of each publication, user feedback is reviewed to determine the content that should be included in the publication.
Ofqual has already put in place a number of suggestions:
round the raw data to the nearest five as rounding is needed for confidentiality. Following feedback from users that they needed the numbers of certificates to be as close to the actual figures as possible, rounding was reduced to the nearest five.
keep the breakdown by type of qualifications, although the majority of qualifications and certificates were for qualifications on the QCF, users still found the detailed breakdown useful.
provide more analysis outside the ten awarding organisations with the most certificates; comment will be made where an awarding organisation has had a
28www.gov.uk/government/statistical-data-sets/vocational-qualifications-dataset
29www.gov.uk/government/statistics/announcements?utf8=%E2%9C%93&organisations%5B%5D=ofq ual
significant change in certifications in relation to all certifications. Tables and published data give details on all awarding organisations.
provide more analysis of the major growth areas.
present the number of certificates awarded by second-tier sector subject area.
include a table in the appendix covering the number of available qualifications by qualification level.
Ofqual will be unable to implement the following suggestions:
present data on graded qualifications – Ofqual does not collect information on
certifications by grade achieved.
present data on the progression between award, certificate and diploma –
Ofqual does not collect the necessary candidate-level data.
present the number of registrations as well as certificates – Ofqual collects the
number of registrations from awarding organisations on a voluntary basis and does not have complete information.
present shared unit data – the data needed to carry out this analysis are not
currently available.
present data broken down by regions within the UK – regional information is not
mandatory as part of the data collection process and would add considerable burden to some awarding organisations.
present more information for the smaller awarding organisations on the state of the market – there are too many organisations to cover within the commentary but Ofqual does provide raw data for each qualification to enable users to do their own analysis.
present the breakdown of key awarding organisations in each sector based on the number of certificates – this is already published by Ofqual in the Annual Qualification Market Report.
The SFA’s Individualised Learner Record Database31 and the Department for
Education’s National Pupil Database provide data on graded qualifications and data
31 The Individualised Learner Record Database is the primary data collection on funded further
Glossary of terms
A levels – also known as General Certificates of Education, were available in this quarter as advanced level qualifications (A levels) and advanced subsidiary (AS). They are the main qualifications that young people use to gain entry to university.
Accreditation – a process by which Ofqual reviews and confirms that proposed qualifications meet specific criteria before they can be offered. Ofqual no longer requires all regulated qualifications to have been accredited.
Accredited qualification – this is an old term that is sometimes used to mean ‘regulated qualification’ (see below). Ofqual now allows awarding organisations to submit most qualifications for regulation without having been accredited, so it is strictly incorrect to refer to regulated qualifications as accredited.
Active qualification – a qualification where a certificate has been awarded.
Available qualification – a qualification eligible for an award or a qualification that has made an award even if it is no longer eligible (no longer available for students to enrol on). For the purpose of this release, a qualification is available until the
certification end date or if an award has been certified during the reporting period.
Awarding organisation – an organisation recognised by Ofqual to develop, deliver and award qualifications.
Certificate/certification – a formal acknowledgement of a student’s achievement. This will be any award that is not graded as U, absent or X (fail).
Certification end date – the last date on which a student may be issued with a certificate of achievement for the qualification.
GCSEs – General Certificates of Secondary Education are the main school-leaving qualifications in England, Wales and Northern Ireland. They are available in a range of subjects and can be studied alongside other qualifications. They are generally sat by 15 to 18 year olds in schools and colleges but are open to anyone who wants to gain a qualification.
Level – qualifications are assigned a level from entry level, then Level 1 through to Level 8 (equivalent to a doctorate), indicating the broad level of demand of the qualification.
‘Other general’ qualifications – qualifications that assess a particular subject area, such as music or art, other than GCSEs, AS and A levels. These qualifications are not directly work related but may support career development. They are often graded. The category also includes Level 1/Level 2 certificates and Essential Skills.
Qualifications and Credit Framework (QCF) – a set of regulatory rules for vocational qualifications that Ofqual has withdrawn from October 2015 in England and Northern Ireland.
Quarter – refers to calendar quarters. Quarter 1 (Q1) refers to January – March, quarter 2 (Q2) to April – June, quarter 3 (Q3) to July – September, and quarter 4 (Q4) to October to December.
Recognition – the formal process that Ofqual operates, whereby awarding organisations that wish to offer regulated qualifications can demonstrate that they meet Ofqual’s recognition criteria.32 The scope of recognition is the qualifications or
types of qualification that the awarding organisation is recognised to offer, which may be quite narrow or very broad. Recognition is a robust gateway into the regulated marketplace. Only applicants who meet the criteria in full will be recognised. Recognised organisations have to meet Ofqual’s Conditions of Recognition on an ongoing basis.
Register – the Register of Regulated Qualifications33 contains details of recognised
awarding organisations and the regulated qualifications they offer.
Regulated qualification – a qualification that is offered by a recognised awarding organisation within the scope of its recognition. Regulated qualifications must be added to the Register of qualifications and have to meet Ofqual’s requirements. Some qualifications are subject to an accreditation requirement and have to be checked by the regulator before they can be offered as regulated qualifications.
Sector Subject Area (SSA) - SSA code is used for classifying subjects into different sectors (for instance Arts, media and publishing). The number of sector subject areas is 15 and most of the sector subject areas have a number of secondary subject areas or tiers. For example, sector subject area Construction, planning and the built
32www.gov.uk/awarding-organisations-understanding-our-regulatory-requirements
environment covers Architecture, Building and construction, Building services and Construction crafts. Ofqual is the lead body for managing this classification system34.
Vocationally related qualifications – work-related qualifications designed to give students the broad skills and knowledge they need to do a job. They are related to employment but, unlike NVQs, do not necessarily require a work placement.
Your feedback
Ofqual is conducting a rolling series of online surveys to help statistical releases meet your needs.
Ofqual would especially like to invite you to take part in the online survey for this release.
https://www.surveygizmo.com/s3/1473109/vocational-and-other-qualifications-quarterly-v1
It will take about ten minutes to complete. Your responses will remain entirely confidential in any reports published about the survey.
Appendix
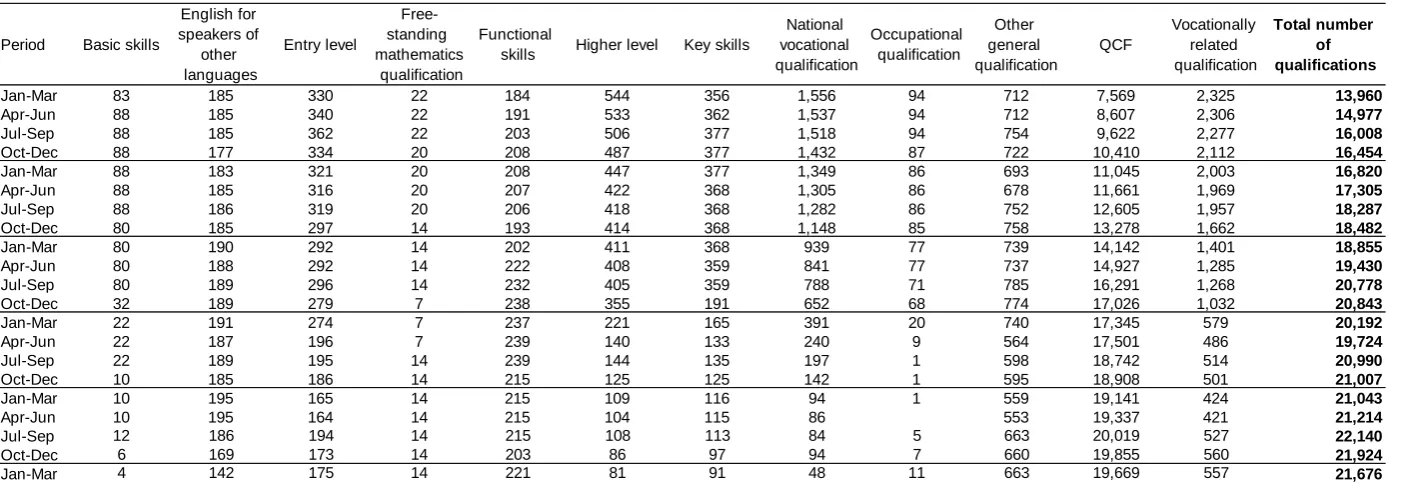
Table 1 Number of regulated vocational and other qualifications, from January to March 2011 to January to March 2016
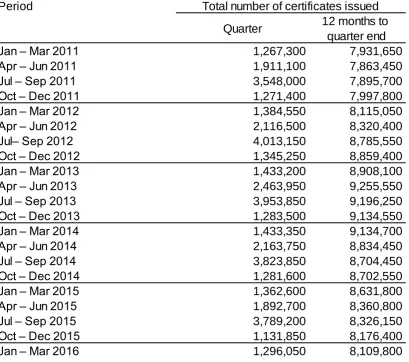
Table 2 Total number of certificates issued in vocational and other qualifications, from January to March 2011 to January to March 2016, showing certificates issued per quarter and per 12 months to quarter end
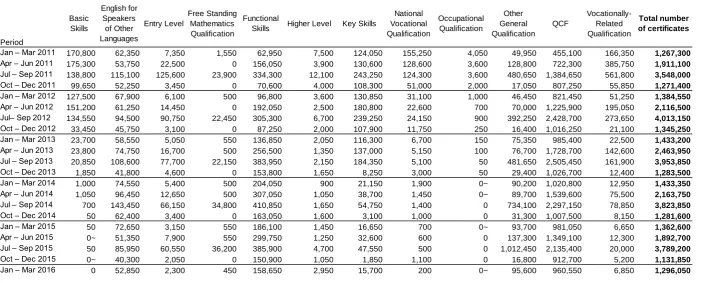
Table 3 Number of certificates issued for regulated vocational and other qualifications by type of qualification, from January to March 2011 to January to March 2016
Table 4 The 50 awarding organisations that issued the highest number of
certificates in vocational and other qualifications for the quarter January to March 2016 (January to March 2015 shown for comparison)
Table 5 Total number of certificates issued in vocational and other qualifications by level of qualification, from January to March 2011 to January to March 2016
Table 6 The 50 qualifications with the most certificates issued in vocational and other qualifications for the quarter January to March 2016 (January to
March 2015 shown for comparison)
Table 7 Total number of certificates issued in vocational and other qualifications by sector subject area, from January to March 2011 to January to March 2016
Table 8 Total number of certificates issued in vocational and other qualifications by second-tier sector subject area, for the quarter January to March 2016 (January to March 2015 shown for comparison)
Table 9 England – the 50 awarding organisations with the highest number of
certificates issued in vocational and other qualifications for April 2015 to March 2016
Table 10 Wales – the 50 awarding organisations with the highest number of
certificates issued in vocational and other qualifications for April 2015 to March 2016
Table 11 Northern Ireland – the 50 awarding organisations with the highest number
Table 1: Number of regulated vocational and other qualifications, from January to March 2011 to
January to March 2016
Period Basic skills
English for speakers of
other languages
Entry level
Free-standing mathematics qualification
Functional
skills Higher level Key skills
National vocational qualification
Occupational qualification
Other general qualification
QCF
Vocationally related qualification
Total number of qualifications
Jan-Mar 83 185 330 22 184 544 356 1,556 94 712 7,569 2,325 13,960
Apr-Jun 88 185 340 22 191 533 362 1,537 94 712 8,607 2,306 14,977
Jul-Sep 88 185 362 22 203 506 377 1,518 94 754 9,622 2,277 16,008
Oct-Dec 88 177 334 20 208 487 377 1,432 87 722 10,410 2,112 16,454
Jan-Mar 88 183 321 20 208 447 377 1,349 86 693 11,045 2,003 16,820
Apr-Jun 88 185 316 20 207 422 368 1,305 86 678 11,661 1,969 17,305
Jul-Sep 88 186 319 20 206 418 368 1,282 86 752 12,605 1,957 18,287
Oct-Dec 80 185 297 14 193 414 368 1,148 85 758 13,278 1,662 18,482
Jan-Mar 80 190 292 14 202 411 368 939 77 739 14,142 1,401 18,855
Apr-Jun 80 188 292 14 222 408 359 841 77 737 14,927 1,285 19,430
Jul-Sep 80 189 296 14 232 405 359 788 71 785 16,291 1,268 20,778
Oct-Dec 32 189 279 7 238 355 191 652 68 774 17,026 1,032 20,843
Jan-Mar 22 191 274 7 237 221 165 391 20 740 17,345 579 20,192
Apr-Jun 22 187 196 7 239 140 133 240 9 564 17,501 486 19,724
Jul-Sep 22 189 195 14 239 144 135 197 1 598 18,742 514 20,990
Oct-Dec 10 185 186 14 215 125 125 142 1 595 18,908 501 21,007
Jan-Mar 10 195 165 14 215 109 116 94 1 559 19,141 424 21,043
Apr-Jun 10 195 164 14 215 104 115 86 553 19,337 421 21,214
Jul-Sep 12 186 194 14 215 108 113 84 5 663 20,019 527 22,140
Oct-Dec 6 169 173 14 203 86 97 94 7 660 19,855 560 21,924
Jan-Mar 4 142 175 14 221 81 91 48 11 663 19,669 557 21,676
England, Wales & Northern Ireland
Notes:
Table 2: Total number of certificates issued in vocational and other
qualifications, from January to March 2011 to January to March
2016, showing certificates issued per quarter and per 12 months to
quarter end
Period
Quarter 12 months to
quarter end
Jan – Mar 2011 1,267,300 7,931,650
Apr – Jun 2011 1,911,100 7,863,450
Jul – Sep 2011 3,548,000 7,895,700
Oct – Dec 2011 1,271,400 7,997,800
Jan – Mar 2012 1,384,550 8,115,050
Apr – Jun 2012 2,116,500 8,320,400
Jul– Sep 2012 4,013,150 8,785,550
Oct – Dec 2012 1,345,250 8,859,400
Jan – Mar 2013 1,433,200 8,908,100
Apr – Jun 2013 2,463,950 9,255,550
Jul – Sep 2013 3,953,850 9,196,250
Oct – Dec 2013 1,283,500 9,134,550
Jan – Mar 2014 1,433,350 9,134,700
Apr – Jun 2014 2,163,750 8,834,450
Jul – Sep 2014 3,823,850 8,704,450
Oct – Dec 2014 1,281,600 8,702,550
Jan – Mar 2015 1,362,600 8,631,800
Apr – Jun 2015 1,892,700 8,360,800
Jul – Sep 2015 3,789,200 8,326,150
Oct – Dec 2015 1,131,850 8,176,400
Jan – Mar 2016 1,296,050 8,109,800
Source: Regulated Qualifications Activity Database
England, Wales and Northern Ireland
Total number of certificates issued
Notes:
1. Vocational and other qualifications represent all regulated qualifications other than GCSEs, GCEs and the Diploma.
Table 3: Number of certificates issued for regulated vocational and other qualifications by type of
qualification, from January to March 2011 to January to March 2016
Period
Basic Skills
English for Speakers
of Other Languages
Entry Level
Free Standing Mathematics Qualification
Functional
Skills Higher Level Key Skills
National Vocational Qualification
Occupational Qualification
Other General Qualification
QCF
Vocationally-Related Qualification
Total number of certificates
Jan – Mar 2011 170,800 62,350 7,350 1,550 62,950 7,500 124,050 155,250 4,050 49,950 455,100 166,350 1,267,300
Apr – Jun 2011 175,300 53,750 22,500 0 156,050 3,900 130,600 128,600 3,600 128,800 722,300 385,750 1,911,100
Jul – Sep 2011 138,800 115,100 125,600 23,900 334,300 12,100 243,250 124,300 3,600 480,650 1,384,650 561,800 3,548,000
Oct – Dec 2011 99,650 52,250 3,450 0 70,600 4,000 108,300 51,000 2,000 17,050 807,250 55,850 1,271,400
Jan – Mar 2012 127,500 67,900 6,100 500 96,800 3,600 130,850 31,100 1,000 46,450 821,450 51,250 1,384,550
Apr – Jun 2012 151,200 61,250 14,450 0 192,050 2,500 180,800 22,600 700 70,000 1,225,900 195,050 2,116,500
Jul– Sep 2012 134,550 94,500 90,750 22,450 305,300 6,700 239,250 24,150 900 392,250 2,428,700 273,650 4,013,150
Oct – Dec 2012 33,450 45,750 3,100 0 87,250 2,000 107,900 11,750 250 16,400 1,016,250 21,100 1,345,250
Jan – Mar 2013 23,700 58,550 5,050 550 136,850 2,050 116,300 6,700 150 75,350 985,400 22,500 1,433,200
Apr – Jun 2013 23,800 74,750 16,700 500 256,500 1,350 137,000 5,150 100 76,700 1,728,700 142,600 2,463,950
Jul – Sep 2013 20,850 108,600 77,700 22,150 383,950 2,150 184,350 5,100 50 481,650 2,505,450 161,900 3,953,850
Oct – Dec 2013 1,850 41,800 4,600 0 153,800 1,650 8,250 3,000 50 29,400 1,026,700 12,400 1,283,500
Jan – Mar 2014 1,000 74,550 5,400 500 204,050 900 21,150 1,900 0~ 90,200 1,020,800 12,950 1,433,350
Apr – Jun 2014 1,050 96,450 12,650 500 307,050 1,050 38,700 1,450 0~ 89,700 1,539,600 75,500 2,163,750
Jul – Sep 2014 700 143,450 66,150 34,800 410,850 1,650 54,750 1,400 0 734,100 2,297,150 78,850 3,823,850
Oct – Dec 2014 50 62,400 3,400 0 163,050 1,600 3,100 1,000 0 31,300 1,007,500 8,150 1,281,600
Jan – Mar 2015 50 72,650 3,150 550 186,100 1,450 16,650 700 0~ 93,700 981,050 6,650 1,362,600
Apr – Jun 2015 0~ 51,350 7,900 550 299,750 1,250 32,600 600 0 137,300 1,349,100 12,300 1,892,700
Jul – Sep 2015 50 85,950 60,550 36,200 385,900 4,700 47,550 500 0 1,012,450 2,135,400 20,000 3,789,200
Oct – Dec 2015 0~ 40,300 2,050 0 150,900 1,050 1,850 1,100 0 16,800 912,700 5,200 1,131,850
Jan – Mar 2016 0 52,850 2,300 450 158,650 2,950 15,700 200 0~ 95,600 960,550 6,850 1,296,050
England, Wales & Northern Ireland
Notes:
Rounding: All figures are rounded to the nearest 50, values less than 25 will appear as 0~. Zero represent no achievements.
Table 4: The 50 awarding organisations that issued the highest
number of certificates in vocational and other qualifications for the
quarter Jan to Mar 2016 (Jan to Mar 2015 shown for comparison)
England, Wales & Northern Ireland
Jan – Mar 2015 Jan – Mar 2016
City and Guilds of London Institute 238,650 196,600
Pearson Education Ltd 228,650 174,350
Chartered Institute of Environmental Health 70,800 61,150
NCFE 60,900 58,000
Highfield Awarding Body for Compliance 65,550 57,000
Cambridge English Language Assessment 52,600 53,500
OCR 70,500 52,650
Trinity College London 28,150 46,050
Qualsafe Awards 39,650 45,700
Cambridge International Examinations 27,900 39,200
BCS, The Chartered Institute for IT 24,250 38,450
Associated Board of the Royal Schools of Music 25,750 33,950
WJEC-CBAC 36,950 29,150
First Aid Awards Ltd 23,750 26,800
BIIAB 18,700 16,850
Excellence, Achievement & Learning Limited 16,950 16,850
Imperial Society of Teachers of Dancing 15,500 16,200
LAMDA 10,850 15,600
Ascentis 13,000 15,500
NOCN 18,000 14,400
Royal Academy of Dance 12,700 14,100
Training Qualifications UK Ltd 11,350 13,400
1st4sport Qualifications 12,850 12,400
AoFA Qualifications 9,500 11,700
British Safety Council 8,250 11,200
Royal Society for Public Health 9,750 10,850
Cskills Awards 11,600 10,700
IQL 6,750 10,050
Active IQ 11,600 10,000
Skillsfirst Awards Ltd 7,550 8,950
Open College Network Eastern Region trading as Gateway Qualifications 4,000 8,150
International Dance Teachers Association 6,700 7,750
Rock School Ltd 6,650 7,450
Innovate Awarding 6,800 7,200
Association of Accounting Technicians 6,200 7,150
AQA Education 9,300 7,000
The Learning Machine 3,700 6,900
Sports Leaders UK 7,350 6,500
The Institute of the Motor Industry 6,200 6,300
Safety Training Awards 4,000 5,750
Laser Learning Awards 2,400 5,100
Industry Qualifications 4,500 4,250
VTCT 4,350 4,200
Future (Awards and Qualifications) Ltd 5,500 4,150
AIM Awards 2,900 3,850
iCan Qualifications Limited 3,200 3,850
Chartered Insurance Institute 2,600 3,800
University of West London 5,100 3,550
English Speaking Board (International) Ltd 4,400 3,400
ITC First 2,300 3,100
Total number of certificates issued (for the quarter)
Source: Regulated Qualifications Activity Database
Notes:
Table 5: Total number of certificates issued in vocational and other
qualifications by level of qualification, from Jan to Mar 2011 to Jan
to Mar 2016
Entry
level Level 1 Level 1/2 Level 2 Level 3 Level 4 Level 5 Level 6 Level 7 Level 8
Total number of achievements
Jan – Mar 2011 103,850 315,600 0 659,300 159,900 18,150 7,450 1,450 1,550 50 1,267,300
Apr – Jun 2011 160,250 487,700 0 1,029,900 207,100 16,750 6,350 1,850 1,150 0 1,911,100
Jul – Sep 2011 451,200 908,450 7,950 1,614,850 515,750 27,700 15,700 4,200 2,100 100 3,548,000
Oct – Dec 2011 115,450 361,550 0 621,000 146,900 15,100 6,950 1,550 2,850 50 1,271,400
Jan – Mar 2012 128,050 394,600 1,200 682,500 150,600 15,200 7,100 2,950 2,250 100 1,384,550
Apr – Jun 2012 185,850 561,550 0 1,121,050 221,000 16,500 6,950 1,500 2,050 50 2,116,500
Jul– Sep 2012 458,050 965,750 36,200 1,900,950 603,950 28,150 13,950 3,550 2,500 50 4,013,150
Oct – Dec 2012 122,850 403,050 0 634,200 158,100 16,400 6,500 2,400 1,700 50 1,345,250
Jan – Mar 2013 134,000 421,250 20,350 671,750 159,800 14,300 7,350 2,800 1,450 100 1,433,200
Apr – Jun 2013 223,350 620,850 0 1,295,000 299,900 14,050 7,750 1,650 1,250 100 2,463,950
Jul – Sep 2013 452,200 954,950 138,650 1,728,100 632,150 26,150 14,850 4,050 2,700 100 3,953,850
Oct – Dec 2013 123,800 354,700 7,700 608,000 166,600 11,750 7,200 1,950 1,750 100 1,283,500
Jan – Mar 2014 163,000 361,200 29,950 681,900 176,250 11,800 6,600 1,500 1,050 50 1,433,350
Apr – Jun 2014 230,100 516,700 8,350 1,069,950 314,300 12,100 8,800 2,350 1,050 50 2,163,750
Jul – Sep 2014 463,700 796,600 381,000 1,451,700 683,300 22,900 18,750 4,050 1,850 50 3,823,850
Oct – Dec 2014 138,900 333,300 3,750 598,650 182,300 12,600 8,850 1,900 1,350 50 1,281,600
Jan – Mar 2015 148,400 325,500 46,100 629,000 187,400 12,050 9,750 2,700 1,600 100 1,362,600
Apr – Jun 2015 226,400 465,400 75,050 787,500 309,450 14,600 10,050 2,800 1,350 100 1,892,700
Jul – Sep 2015 467,550 715,600 752,050 1,112,150 687,100 29,750 17,150 5,750 2,050 100 3,789,200
Oct – Dec 2015 113,800 286,800 4,700 523,400 176,800 14,000 9,500 1,600 1,200 0~ 1,131,850
Jan - Mar 2016 146,050 299,750 62,250 571,100 191,300 13,050 9,300 2,450 750 50 1,296,050
England, Wales & Northern Ireland
Source: Regulated Qualifications Activity Database
Notes:
1. Vocational and other qualifications represent all regulated qualifications other than GCSEs, GCEs and the Diploma. 2. Data are supplied by awarding organisations.
Table 6: The 50 qualifications with the most certificates issued in
vocational and other qualifications for the quarter Jan to Mar 2016
(Jan to Mar 2015 shown for comparison)
England, Wales & Northern Ireland
Jan – Mar 2015 Jan – Mar 2016
Cambridge International Level 1/Level 2 Certificate in First Language English 26,200 37,700 CIEH Level 2 Award In Food Safety in Catering (QCF) 34,250 29,250 BCS Level 2 Certificate In IT Application Skills (QCF) 9,650 28,850 QA Level 2 Award In Emergency First Aid At Work 2013 (QCF) 20,900 24,050 TCL Entry Level Certificate In ESOL International - Speaking and Listening (Entry
3) (ESOL)
8,250 19,700
Pearson Level 1 Award In Mathematics at Level 1 (FS) 16,200 15,400 FAA Level 2 Award in Emergency First Aid at Work (QCF) 15,300 15,350 BIIAB Level 2 Award For Personal Licence Holders (QCF) 11,750 11,800 HABC Level 2 Award in Emergency First Aid at Work (QCF) 14,900 11,600 City & Guilds Level 1 Award In Mathematics at level 1 (FS) 13,500 11,000 Pearson Level 1/2 Certificate In English Literature (OG) 7,250 10,800 Pearson Level 2 Award In Mathematics at Level 2 (FS) 10,750 10,100 City & Guilds Level 2 Award In English at Level 2 (FS) 12,300 9,500
QA Level 3 Award In First Aid at Work (QCF) 9,250 9,500
Pearson Level 1 Award In English at Level 1 (FS) 9,900 9,250
City & Guilds Level 2 Award In Functional Skills mathematics (FS) 10,200 9,100 ABRSM Level 1 Award In Graded Examination in Music Performance (Grade 1)
(QCF)
6,600 9,000
Cambridge English Level 1 Certificate In English (IELTS 5.5-6.5) (ESOL) 14,400 9,000
Pearson Level 2 Award In English at Level 2 (FS) 8,450 8,850
City & Guilds Level 1 Award In English at Level 1 (FS) 11,100 8,500 BSC Level 1